ANALYSIS OF THE OECD/NEA SFR BENCHMARK WITH ANTS REDUCED-ORDER NODAL DIFFUSION SOLVER AND THE SERPENT MONTE CARLO CODE
←
→
Page content transcription
If your browser does not render page correctly, please read the page content below
EPJ Web of Conferences 247, 04021 (2021)                                                               https://doi.org/10.1051/epjconf/202124704021
PHYSOR2020

                      ANALYSIS OF THE OECD/NEA SFR BENCHMARK WITH
                       ANTS REDUCED-ORDER NODAL DIFFUSION SOLVER
                           AND THE SERPENT MONTE CARLO CODE

                                                       Marton Szogradi
                                           VTT Technical Research Centre of Finland Ltd
                                             P.O. Box 1000, FI-02044 VTT, Finland

                                                           marton.szogradi@vtt.fi

                                                                  ABSTRACT

               In order to meet modern industrial and scientific demands the Kraken multi-physics plat-
               form’s development was recently launched at VTT Technical Research Centre of Fin-
               land. The neutronic solver of the framework consists of two calculation chains, provid-
               ing full core solutions by the Serpent high fidelity code (1) and the AFEN/FENM-based
               reduced-order diffusion solver called Ants (2) capable of handling square and hexagonal
               geometries in steady-state. Present work introduces the simulation of a large 3600 MWth
               Sodium-cooled Fast Reactor (SFR) described within the activities of the Working Party
               on Scientific Issues of Reactor Systems (WPRS) of OECD. Full-core 3D results were ob-
               tained by Serpent for carbide- and oxide-fuel cores, moreover group constants were gener-
               ated for Ants utilizing 2D super-cell and single assembly infinite lattice models of Serpent.
               The continuous-energy Monte Carlo method provided the reference results for the verifi-
               cation of the reduced-order method. Implementing the spatially homogenized properties,
               3D solutions were obtained by Ants as well for both core configurations. Comparison was
               made between the various core designs and codes based on reactivity feedbacks (Doppler
               constant, sodium voiding, control rod worth) considering power distributions. Regarding
               reactivity sensitivity on geometry, axial fuel- and radial core expansion coefficients were
               evaluated as well.

         KEYWORDS: SFR, nodal diffusion solver, Ants, Serpent

                                                           1. INTRODUCTION

         Benchmark data from report [1] was used to construct 3D full-core SFR models in Serpent with
         respect to given boundary conditions. Two configurations, one of carbide (CA) and one of oxide
         (OX) fuel was defined with Beginning of Cycle (BoC) isotopic composition. In Section 2 the core
         design is discussed and the performance of the models under various perturbations e.g. Doppler
         effect, sodium voiding and diagrid expansion. In Section 3 few-group constants’ generation is de-
         scribed with 2D spatial homogenization highlighting the sensitivity of various condensation meth-
         ods. In Section 4 the diffusion solver is introduced briefly regarding theoretical background and
         capabilities. Finally the assessment of Ants will be carried out with respect to 3D Serpent results.

  © The Authors, published by EDP Sciences. This is an open access article distributed under the terms of the Creative Commons Attribution License 4.0
  (http://creativecommons.org/licenses/by/4.0/).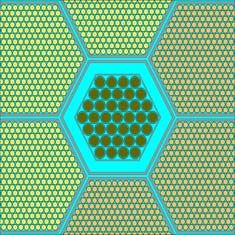
EPJ Web of Conferences 247, 04021 (2021) https://doi.org/10.1051/epjconf/202124704021
PHYSOR2020
2. SERPENT FULL-CORE 3D MODELS
Both studied cores have medium power density, structural materials are identical (e.g. Oxide
Strenghtened Steel - ODS cladding) and helium bonded fuel pellets. Each design bears benefits
and disadvantages therefore considering both configurations gives a wider perspective regarding
code versatility and reliability. The CA core’s main motivation was to achieve a low linear fuel
temperature gradient providing an increased safety margin for pellet-centerline temperature. The
OX configuration was conceived with the ”fat pin with small wire” approach i.e. the core could
reach self-breeding without fertile blanket. The models represent BoC conditions thus the helium
bonded fuel pellets are not in contact with the cladding.
2.1. Core Configurations
The CA core contains 487 fuel assemblies (206 inner / 201 outer), 270 radial reflector elements and
27 control assemblies whereas 18 and 9 assemblies represent the primary and secondary control
system, respectively. The (U,Pu)C pellets are whole, the fuel cladding is made of ODS alloy while
the shroud tube and the axial reflector elements consist of EM10 SS (Euralloy). The OX core has
453 fuel assemblies (225 inner / 228 outer) and the same radial reflector shield and control systems
as the CA. The (U,Pu)O2 pellets are hollow with ODS cladding and similar EM10 structures as
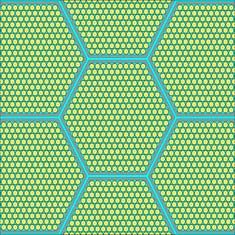
the CA fuel. Major geometry and material properties of the cores are tabulated in Table 1. The
core layouts are shown in Fig. 1. Regarding the control rods, both system contains B4 C pellets as
absorber material, whereas the primary rods have natural isotopic composition while the secondary
assemblies are loaded with enriched (90 % 10 B) boron carbide.
Table 1: Comparison of Core Design.
Property CA OX
Overall height (cm) 301.70 311.16
Active core height (cm) 100.56 100.56
Subassembly pitch (cm) 20.9889 21.2205
Number of fuel pins (-) 469 271
Pellet radius (mm) 3.319 4.742
Inner/Outer core Pu content (wt%) 13.76/17.60 15.81/17.60
2.2. Present Models
Full-core 3D model inputs were built for Serpent 2.1.31 [2] based on Ref. [1] whereas He pressure
(atomic density) was chosen to be 10 bar according to MOX fuel recommendations reported by
the Halden Reactor Project [3]. The fuel pins of the inner and outer core were divided into 5 axial
nodes representing different Pu enrichments. The control assemblies were fully withdrawn from
the core in every test case except for the control rod worth (CRW) simulations. A total of 1700
cycles (1500 active / 200 inactive cycles) were calculated with 600 000 neutron histories/cycle
2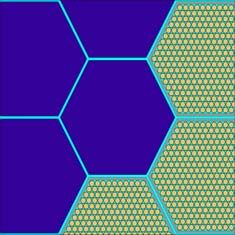
EPJ Web of Conferences 247, 04021 (2021)                                                    https://doi.org/10.1051/epjconf/202124704021
PHYSOR2020

                                                 Figure 1: SFR Core Layouts.

         utilizing the JEFF-3.1.2 library. Besides the benchmark criticality case Doppler constants (KD )
         were calculated with 1000 K fuel temperature raise ∗ (ΔTf ) for each configuration:
                                                        dρ      ρl − ρ 0
                                             KD = T f      ≈                 (pcm),                                       (1)
                                                        dT   ln(Tf,1 /Tf,0 )

         where index 0 refers to the benchmark case, index 1 denotes the perturbed case and ρ is reactivity.
         The sodium void reactivity (SVR) and CRW values were obtained by simply taking the difference
         between the nominal and the perturbed cases as SVR = ρ0 − ρSV,100 and CRW = ρ0 − ρCRs,in ,
         respectively. The axial fuel and radial core expansion reactivity feedback was calculated with the
         same logic as SVR and CRW comparing the two cases whereas the Lf length of the fuel slug had
         to be modified in the Serpent model by:

                                   Lf (T1 ) = Lf (T0 ) 1 + αCA/OX (T1 − T0 ) (cm),                      (2)

         yielding a ΔLf /Lf of + 1.29/1.77 % for CA/OX with corresponding fuel density reduction, where
         αCA/OX is the linear expansion coefficient of the fuel [4,5]. Radial expansion of core diagrid was
         derived from the pitch (p) perturbation:

                                     p1 (T1 ) = p0 (T0 ) 1 + αrad,g (T1 − T0 ) (m),                     (3)

         giving a Δp/p of + 0.99 % for both cases based on the same 316L SS structural material, where
         αrad,g was the global linear expansion coefficient of the diagrid.

            ∗
              The benchmark suggested doubling the fuel temperature for both CA/OX cores however admittedly such temper-
         atures were not physical. In order to approximate these temperatures as close as possible and keep temperatures below
         fuel melting point the 1000 K increase was applied.

                                                                  3
EPJ Web of Conferences 247, 04021 (2021) https://doi.org/10.1051/epjconf/202124704021
PHYSOR2020
2.3. Serpent Results
Results were compared with benchmark data summarized in [6] and studies conducted by Nikitin
et al. [7,8] with Serpent. The benchmark averages are distorted by codes with homogeneous cell
description while [7,8] represent a heterogeneous approach. One has to account for inherent differ-
ences of code versions and boundary conditions e.g. cross section libraries, Table 2 summarizes the
results. In general the discrepancies are acceptable considering the ±500 pcm uncertainty ranges
in [6] however the SVR values highlight larger differences. Axial fuel and radial diagrid expansion
feedback indicated that the cores are more sensitive to pitch perturbation than thermal elongation
of the fuel slug. Regarding statistics, present Serpent calculations showed an average deviation of
±1.4 pcm and Ref. [7,8] incorporated ±2.0 pcm uncertainty. Available standard deviation values
(± σ) of the benchmark cases are included in Table 2 below.
Table 2: 3D Full-Core Results for CA/OX Cores.
Reference keff (-) KD (pcm) SVR (pcm) CRW (pcm) Δρax (pcm) Δρrad (pcm)
[6] 1.0136/1.0096 −1002/−895 2048/1932 −4326/−6092 - -
± σ [6] 0.0090/0.0048 167/89 398/171 1124/995 - -
Present model 1.0067/1.0120 −945/−936 1552/1336 −4217/−6127 −179/−103 −421/−405
[7,8] (OX) 1.0107 −852 1864 −6046 −120 −429
3. FEW-GROUP CONSTANTS’ GENERATION FOR ANTS
3.1. 2D Models and Boundary Conditions
Supercell and colorset lattices were composed in order to obtain 2D homogenized few-group cross
sections of non-fissile and fissile cells. In cases of interfaces between fissile and non-fissile cells
colorset models were written for subchannels e.g. outer core FA with one, two or three adjacent
radial reflector cells. Fuel lattices had periodic boundary conditions while other models e.g. control
rod models were treated with reflective boundary conditions.
Figure 2: Serpent 2D Inputs (left - inner core infinite lattice, middle - primary CR, right -
radial reflector)
Regarding the few-group energy condensation the ECCO-33 structure was considered first, after-
wards a simplified 24-group equal-lethargy bin structure was derived lumping the thermal region
4EPJ Web of Conferences 247, 04021 (2021) https://doi.org/10.1051/epjconf/202124704021
PHYSOR2020
groups into one group (24th) hence reducing statistical errors of the lowest energy groups [9]. The
SCALE238 structure was used for micro-group condensation.
A sensitivity study of homogenization methods was carried out as well, considering B1 and P1
leakage corrections and FM leakage correction with out-scattering diffusion coefficients. The study
utilized a CA inner fuel 2D infinite lattice model in order to demonstrate the bias of the methods
(see Fig. 2 left). Each run had 2 500 cycles (2 000 active / 500 passive) with a population of 60 000
neutrons. Calculations were performed with varying neutron populations between 2 000 – 100 000
whereas it was concluded that statistical errors did not show noticeable variance with populations
over 60 000 particles, later on the same boundary conditions were applied in XS generation for
Ants.
3.2. Few-Group Cross Section Generation Sensitivity Study
Group constants e.g. Σa , νΣa , κΣf and D describe materials in Ants, Fig. 3 represents the trends of
the mentioned terms on the 10-11 –20 MeV spectrum. It can be seen that for most cases the various
methods showed little to negligible discrepancies except for the 24th energy-group where the B1
leakage correction had the lowest XSs systematically. Regarding Σa , νΣf , κΣf the average and
maximum difference was −0.24 / 0.64 % between no-leakage and corrected values, respectively.
As for the diffusion coefficient the maximum average difference was 1.52 % given by the P1
method followed by B1 (0.33 %) and out-scattering (0.07 %) that were noticeably lower than the
P1 error.
These tendencies confirm an earlier conclusion of Faure et al. [10] whereas leakage-corrected XS
generation methods were studied in in fast systems. It was reported that the leakage models had
a low impact on cross section generation. Such insensitivity can be explained by the fact that the
introduction of a leakage term does not change noticeably the structure of the local multi-group
flux within a macro-group. Considering scattering cross sections, in general for the scattering
matrix the maximum error between leakage-corrected and no-leakage methods was −0.23 % (P1 ).
4. ANTS REDUCED-ORDER NODAL DIFFUSION SOLVER
4.1. Code and Input Structure
The development of the Ants reduced-order nodal diffusion solver has started at VTT in 2018
[11,12]. The in-house built code is based on the analytic function expansion nodal (AFEN) - and
function expansion nodal methods (FENM) [13,14]. The algorithm tackles the large number of
nodal variables without transverse integration which is beneficial considering hexagonal geometry
but has a negative impact on solver speed. The expansion of the intranodal flux is based on analytic
basis functions which’ solutions are obtained from the steady-state multi-group diffusion equation.
Regarding the model structure the user has to provide basic geometry data e.g. core lattice pitch,
number and length of axial nodes with respect to benchmark data [1]. The material of each node
is described by a set of cross sections in a 24-group condensed format, extracted from the 2D
supercell results as mentioned above. Finally convergence limits can be defined for keff and fission
source for instance, calculations presented in Section 4.2 had a εkeff = 10−8 and εS = 10−6 limits.
5EPJ Web of Conferences 247, 04021 (2021) https://doi.org/10.1051/epjconf/202124704021
PHYSOR2020
(a) Σa (b) νΣf
(c) κΣf (d) D
Figure 3: Group Constants in CA Inner Fuel 2D Supercell.
4.2. Comparison of Ants and Serpent
In order to compare power distribution of Ants and Serpent cores the assembly-wise relative pow-
ers were normalized to the maximum value in each solution, the differences between these nor-
malized distributions are depicted in Fig. 4. Comparing Serpent to Ants the average and absolute
maximum error was 0.00 / 1.52 % in case of CA and 0.19 / 2.66 % for OX, respectively.
The axial power distribution comparison is shown in Fig. 5 highlighting that Ants provided a
more symmetric distribution for CA than Serpent meaning that the CRs had smaller worth in the
reduced-order model as discrepancies started to increase in the upper section of the core. The OX
core followed the axial profile of Serpent better in the upper part, noticeable +0.39 % and +1.85 %
for CA and +0.52 % and +2.23 % for OX, respectively.
The Ants radial power profiles (see Fig. 6) show good agreement with the MC results with largest
absolute error of 1.26 % for CA and 1.86 % for OX, comparing Ants to MC. The label ”Ants-simp.”
denotes a simplified case where the local geometry was neglected on the radial reflector/outer core
boundary i.e. outer core FA 2D infinite lattice cross sections were used for fuel assemblies with
6EPJ Web of Conferences 247, 04021 (2021) https://doi.org/10.1051/epjconf/202124704021
PHYSOR2020
(a) CA (b) OX
Figure 4: Comparison of Power Distributions in Criticality Case.
(a) CA (b) OX
Figure 5: Axial Power Profiles in Criticality Case.
reflector neighbours. The deviation is clear between the two CA Ants results indicating that local
heterogeneities affecting flux did alter the global results, moreover, the maximum absolute error
increased to 2.17 %. The OX results are similar comparing maximum absolute errors where the
finer mesh and the simplified case gave 1.87 % and 3.03 %, respectively. Hence the OX system
with larger flux gradient on the outer core edge was more sensitive to perturbation from mesh
resolution.
Table 3 summarizes the Ants-Serpent comparisons considering several test cases described in Sec-
tion 2.3. Regarding the criticality case the discrepancies between keff results were 7 pcm (CA) and
136 pcm (OX). Even though the OX error is significantly larger than its CA counterpart, earlier
studies on the OX core showed similar discrepancy ranges with Serpent-PARCS (84 pcm) and
Serpent-DYN3D (128 pcm) [7]. Has to be mentioned that using superhomogenization (SPH) the
7EPJ Web of Conferences 247, 04021 (2021) https://doi.org/10.1051/epjconf/202124704021
PHYSOR2020
(a) CA (b) OX
Figure 6: Radial Power Profiles (in Main Diagonal.
nodal solution can be significantly improved as reported in [15]. SVR coefficients show larger de-
parture comparing Ants to Serpent, further analysis is required to study the effect of self-shielding
in heterogeneous and homogeneous codes. Looking at CRW, Δρax and Δρrad the trends are
acceptable in general although Δρax,OX did not show satisfying similarity between the high fi-
delity and the reduced-order values. This underlines that the depiction (by 2D homogenization)
of a composition-perturbation in fuel material can translate into varying discrepancies comparing
stochastic and deterministic codes.
Table 3: 3D Full-Core Results for CA/OX with High-Fidelity and Reduced-Order Solvers.
Code keff (-) KD (pcm) SVR (pcm) CRW (pcm) Δρax (pcm) Δρrad (pcm)
Serpent 1.00670/1.01198 −945/−936 1552/1336 4217/6127 −179/−106 −421/−405
Ants 1.00806/1.01241 −947/−957 1895/1290 4212/6180 −182/−159 −414/−404
5. CONCLUSIONS
The Serpent full-core 3D simulation of two SFR cores was presented and compared to benchmark
data [6] where Serpent showed satisfying agreement with previous works considering heteroge-
neous geometry description. The 2D supercell models highlighted the insensitivity of few-group
constants to leakage-correction methods in a fast system. The methodology and performance of
the Ants reduced-order diffusion solver was demonstrated as a potential surrogate of Serpent. Re-
activity feedbacks showed good agreement with benchmark data and MC results however larger
differences were observed in cases of SVRs and axial fuel expansion of the OX core indicating
that the applied homogenization had larger impact on composition-related perturbations compared
8EPJ Web of Conferences 247, 04021 (2021) https://doi.org/10.1051/epjconf/202124704021
PHYSOR2020
to changes in geometry. Further studies are needed to improve the efficiency of group constant
generation with special care to fissile and non-fissile cell interfaces.
References
[1] D. Blanchet, L. Buiron, N. Stauff, T. K. Kim, T. Taiwo, AEN - WPRS Sodium Fast Reactor
Core Definitions (v1.2), OECD/NEA, 19th September 2011.
[2] J. Leppänen, M. Pusa, T. Viitanen, V. Valtavirta, T. Kaltiaisenaho, “The Serpent Monte Carlo
code: Satus, development and applications in 2013” Annals of Nuclear Energy, Volume 82,
pp. 142-150 (2015).
[3] Terje Tverberg, Mixed-oxide (MOX) fuel performance benchmark, Summary of the Results
for the Halden Reactor Project MOX Rods, NEA/NSC/DOC(2007)6, OECD HRP, 2007.
[4] Ï. Ë. Êèðèëëîâ, Òåïëîôèçè÷åñêèå ñâîéñòâà ìàòåðèàëîâ ÿäåðíîé òåõíèêè - ó÷åá-
íîå ñïðàâî÷íîå ïîñîáèå 2-å èçä., Îáíèíñêèé Èíñòèòóò Àòîìíîé Ýíåðãåòèêè , Îá-
íèíñê, Russian Federation (2007).
[5] Þ. Ã. Ãîäèí, À. Â. Òåíèøåâ, Êàðáèäíîå ÿäåðíîå òîïëèâî, Ìîñêîâñêèé Èíæåíåðíî-
Ôèçè÷åñêèé Èíñòèòóò, Ìîñêâà, Russian Federation (2007).
[6] L. Buiron et al., “Evaluation of Large 3600 MWth Sodium-Cooled Fast Reactor Neutronic
OECD benchmarks” Proceedings of PHYSOR 2014, Kyoto, Japan, September 28 - October
3, (2014).
[7] E. Nikitin, E. Fridman, K. Mikityuk, “Solution of the OECD/NEA neutronic SFR bench-
mark with Serpent-DYN3D and Serpent-Parcs code systems” Annals of Nuclear Energy,
Volume 75, pp. 492-497 (2014).
[8] E. Nikitin, E. Fridman, “Extension of the reactor dynamics code DYN3D to SFR appli-
cations - Part I: Thermal expansion models” Annals of Nuclear Energy, Volume 119, pp.
382-389 (2018).
[9] E. Fridman, “Generation of few-group constants with Serpent: Application examples” Pro-
ceedings of PHYSOR 2014, Kyoto, Japan, September 28 - October 3, (2014).
[10] B. Faure, G. Marleau, “Simulation of a sodium fast core: Effect of B1 leakage models on
group constant generation” Annals of Nuclear Energy, Volume 99, pp. 484-494 (2017).
[11] V. Sahlberg, A. Rintala, “Development and first results of a new rectangular nodal diffusion
solver of Ants” Proceedings of PHYSOR 2018, Cancún, Mexico, 22-26 April, (2018).
[12] A. Rintala, V. Sahlberg, “Extension of nodal diffusion solver of Ants to hexagonal geome-
try” Kerntechnik, Volume 84, pp. 252-261 (2019).
[13] N. Z. Cho, J. M. Noh, “Analytic function expansion nodal method for hexagonal geometry”
Nuclear Science and Engineering, Volume 121, pp. 245-253 (2014).
[14] B. Xia, Z. Xie, “Flux expansion nodal method for solving multigroup neutron diffusion
equations in hexagonal-z geometry” Annals of Nuclear Energy, Volume 33, pp. 370-376
(2006).
[15] E. Nikitin, E. Fridman, K. Mikityuk, “On the use of the SPH method in nodal diffusion
analyses of SFR cores” Annals of Nuclear Energy, Volume 85, pp. 544-551 (2015).
9You can also read