Performance of heat pump system for water heating in European climate
←
→
Page content transcription
If your browser does not render page correctly, please read the page content below
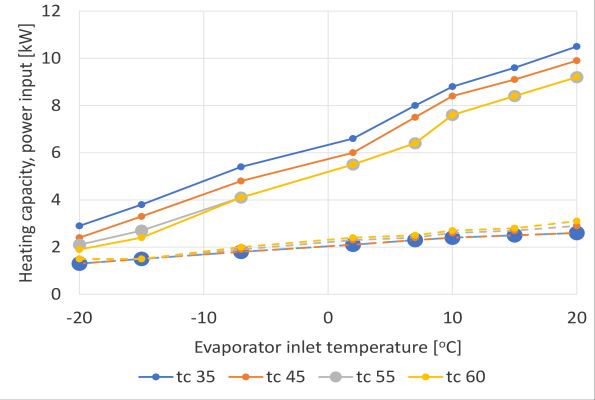
E3S Web of Conferences 182, 03006 (2020) https://doi.org/10.1051/e3sconf/202018203006
CPEEE 2020

 Performance of heat pump system for water heating in European
 climate
 Yauheni Kachalouski1,*, Matuška Tomáš2
 1
 Department of Environmental Engineering Faculty of Mechanical Engineering, Czech Technical University in Prague, Technická 4,
 16607, Prague, Czech Republic
 2
 University Centre for Energy Efficient Buildings, Czech Technical University in Prague, Třinecká 1024, 27343 Buštěhrad, Czech
 Republic

 Abstract. A performance of air-to-water and brine-to-water heat pump for domestic hot water preparation
 was analyzed in different climates of Europe. Air-source heat pumps are widely used energy source for
 domestic applications with low operation costs. Their system SPF was found at level of 3.0 for domestic hot
 water preparation for medium latitudes in Europe. Investigations on the ground-source heat pump
 performance show their average SPF are close to air-source technology.

 1 Introduction
 Use of air source pump (ASHP) and ground source heat
 Heat pumps are widely used as an ambient heat pump (GSHP) for DHW preparation has been analyzed for
 transformer for space heating (SH) and domestic hot water single family house with 4 persons with total hot water
 (DHW) preparation in Europe [1], however a lot of demand of 206 l at 45 oC. Analysis has been performed by
 countries have only small share of installed heat pump means of simulations using TRNSYS software [4].
 power, e.g. such as Czech Republic. But general tendency Analyzed system for DHW preparation consists of heat
 in the market growth can be seen from statistics and reports pump, hot water storage (TES), circulating pumps,
 [1]. Overall, the industry is optimistic for a continued controller and back-up heater (see Figure 1).
 market growth and more markets we return to growth in
 future. Moreover, according to the field measurements the
 overall performance of heat pumps in service is increasing
 [2]. This takes place in connection with new heat pump
 installations. It was investigated that on average the air-
 source heat pumps perform with a system performance
 factor (SPF) in the range of 2.2 - 4.2 with an average value
 of 3.1, and at the same time the ground-source heat pumps
 perform with SPF in the range of 3.0 - 5.4 with the average
 value of 4.3 [2]. The numbers indicated above are for
 newly built single-family dwellings. Furthermore,
 European standard on design of heat pump heating systems Fig. 1. Scheme of water heating ground-source heat pump
 specifies the minimum and target values of heat pump system.
 performance, i.e. for air-source heat pump minimum and
 target SPF values are 2.3 and 2.8, respectively and 3.0 and
 The heat pumps of both types have been sized to allow
 3.5 for the ground-source heat pumps with application for
 the hot water preparation and there were considered
 DHW and SH.
 specific products available on the market. ASHP has the
 Thus, the study of air- and ground-source heat pump
 heat output 6.6 kW and COP = 3.1 at A2/W35 conditions,
 performance for DHW preparation under different climate
 at the same time GSHP has a heat output 5.8 kW and
 conditions in Europe was carried out. The results
 demonstrate the scope of heat pump applicability for DHW COP = 4.5 at B0/W35 conditions. The performance of
 preparation in European countries in regard to the standard heat pumps has been modelled with use of bi-quadratic
 [3]. curve fits for the heat output and electric power input. The
 curve-fit parameters were obtained for commercially
 available heat pumps by least-square fitting from
 2. Analysis of water heating heat pump manufacturer’s data [5] (see Figure 2). For the modelling
 system of the heat pump performance, several restrictions have
 been imposed on heat pump operation, such as maximum

 *
 Corresponding author: Yauheni.Kachalouski@fs.cvut.cz
© The Authors, published by EDP Sciences. This is an open access article distributed under the terms of the Creative Commons Attribution
License 4.0 (http://creativecommons.org/licenses/by/4.0/).
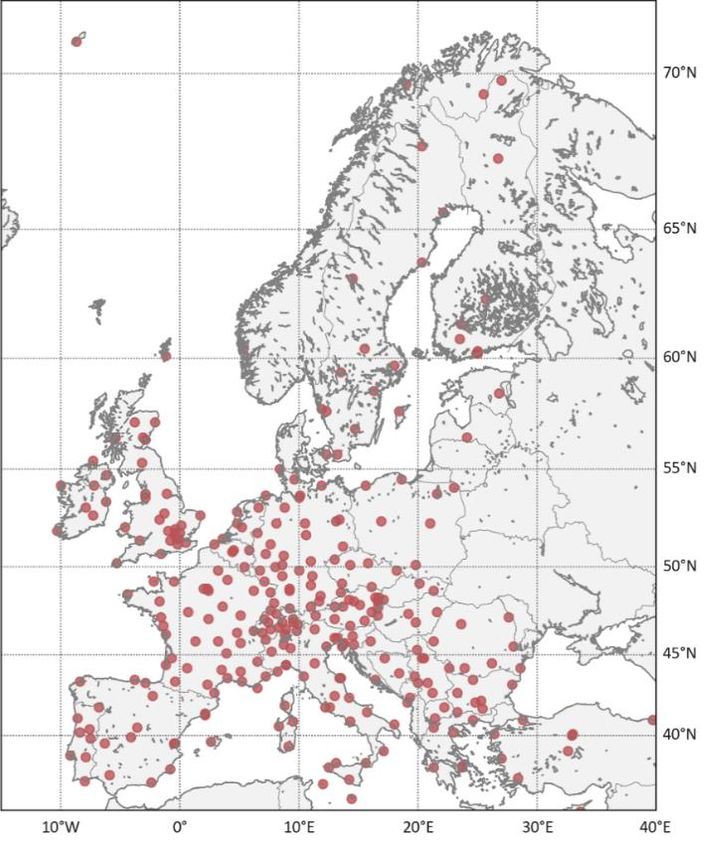
E3S Web of Conferences 182, 03006 (2020) CPEEE 2020 https://doi.org/10.1051/e3sconf/202018203006
CPEEE 2020

 and minimum condenser and evaporator operating
 temperatures and minimal standby time between its start
 and stop (10 min).

 Fig. 3. DHW load profile adopted from M profile [8].

 To model a realistic hot water load with
 morning/evening peaks and night load profile M has been
 taken from EU Commission Regulation 814/2013 on eco-
 design of water heaters [8]. Daily profile corresponding to
 the hot water consumption of single family of 4 persons is
 shown in Figure 3. However, the load profile M was
 adjusted from delivering temperature of 55 oC to 45 oC
 temperature of water intake keeping the same amount of
 energy consumed (see Figure 2). Reduction of the hot
 water temperature has been applied as more realistic
 requirement when using heat pumps in single-family
 houses.
 The heat pump system has been considered in different
 climate locations throughout the Europe. Hourly climate
 data for each location has been obtained from
 meteorological database Meteonorm [4]. Data sets for
 358 locations in the Europe (see Figure 4) have been
 selected for the analysis. The northernmost location is
 Barentsburg, Norway (GPS 78.1, 14.2), the southernmost
 location is Funchal, Portugal (GPS 32.6, -16.9). Cold
 water mains temperature has been derived by using the
 following algorithm adopted from [9]:
 Evaporator inlet temperature [oC]
 , 360 (1)
 Fig. 2. Heat output, compressor power input and COP for air- t = ( ̅ + ) + ( ) sin ( ( − 15 − ) − 90)
 2 365
 source and ground-source heat pumps where is
 ̅
 , , average and maximum ambient
 The volume of the hot water storage is considered 200 l. temperature [oC];
 To transfer the heat from the heat pump into water the off, r, lag fitting coefficients [-], offset, ratio and
 immersed tube heat exchanger is applied. DHW tank has lag values were obtained by fitting data
 been modelled as the stratified fluid storage tank with compiled by Abrams and Shedd and
 internal heat exchanger known as type 340 [6]. The UA- Sandia Labs [9];
 value of heat exchanger is 640 W/K and it is considered as day current day of simulation [day].
 a function of temperature difference between fluid in the
 heat exchanger and in the storage. The heat loss of the
 DHW tank is characterized by overall UA-value of
 1.58 W/K, distributed by 23 % for top heat loss, 70 % to
 wall heat loss and 7 % to bottom heat loss. The whole
 storage volume is divided into 30 completely mixed
 volume segments. The temperature sensor is placed at the
 0.7 of relative height of the total tank height. Set-point
 temperature of sensor in the storage tank for hot water
 preparation control is 50 °C with a deadband of ± 2 K.
 Ground-source heat pump is equipped with single U-
 tube borehole of 68 m depth. Here, to simplify the
 parametric analysis the sizing has been used universally
 for all cases. The model of borehole used in simulations is
 type 557 of TESS library for TRNSYS [7]. The ground and
 fill material thermal conductivity was set to 2 W/m.K.

 2
E3S Web of Conferences 182, 03006 (2020) CPEEE 2020 https://doi.org/10.1051/e3sconf/202018203006
CPEEE 2020

 mountain areas or northern part of Europe than it is in the
 southern Europe.
 Moving from south to north increasing latitude of the
 location the total system electrical energy consumption
 (which includes electrical consumption of heat pump,
 circulation pump and back-up heater) increases. Again, the
 spike between 45° and 50° latitude indicates high altitude
 of given sites in mountains characterized by significantly
 higher heat demand for hot water preparation (see Figure
 6) and extreme conditions for heat pump operation.
 System total electrical consumption in this mountain area
 is thus approximately 1.5 times higher than it is in the same
 latitude location but with low altitude (1500 kWh versus
 1000 kWh).

 Fig. 6. DHW heat demand, system electrical energy
 consumption and TES heat loss for different locations (latitude)
 for ASHP.
 Fig. 4. Locations considered in the simulations.
 In general air-source and ground-source heat pump
 The operation conditions of hot water preparation by system simulations resulted in similar system performance
 air source heat pump: ambient air temperature and cold for given location. Figure 6 provides simulations results of
 water temperature are influenced not only by geographical DHW heat demand, system electricity consumption and
 latitude but also altitude (see Figure 5). Data of high storage tank heat loss for air-source heat pump only. Due
 altitude around latitude value of 48° is for locations in Alps to these values are barely distinguishable from those
 mountains. The fitting coefficients proposed by Abrams obtained for the ground-source heat pump, to investigate
 and Shedd in Equation 1 lead the water mains key difference in performance of two types of heat pumps
 temperatures decrease below 0oC in high latitudes, hence the SPF values were evaluate alone (Figure 7).
 it was suggested to limit water mains temperature down to Significant correlation was identified between system
 4oC in these latitudes, which is seen in Figure 5. performance and the boundary conditions the heat pump
 was exposed to. By exploiting overall system seasonal
 performance factor (SPF) the heat pump system can be
 evaluated as follows:

 = (2)
 ,ℎ + , + ,

 where is
 Fig. 5. Average annual ambient and mains temperature. QDHW heat delivered to hot water load [kWh];
 Wel,hp electricity consumed by heat pump [kWh];
 The extensive number of numerical simulations were Wel,aux electricity consumed by circulating pump
 performed in TRNSYS software [4] which was controlled [kWh];
 over the Python script. This approach allows to generate Wel,bu electricity consumed by back-up heater
 newly compounded TRNSYS input file (*.dck-file) [kWh].
 containing all the boundary conditions for each simulation. The efficiency of heat pump described as coefficient of
 performance COP. The annual COP has been calculated
 according to the Equation (2) as follows:
 3. Results
 = (3)
 Heat demand for hot water preparation differs in different ,ℎ
 locations (Figure 6) due to the water mains temperature where is
 differs throughout the year (Figure 5) influencing DHW Qc condenser heat output [kWh];
 energy delivered to the consumer. Thus, heat demand Wel,hp electricity consumed by heat pump [kWh].
 increases with latitude when moving to the north or with
 the altitude of the location. It is about double in the

 3
E3S Web of Conferences 182, 03006 (2020) CPEEE 2020 https://doi.org/10.1051/e3sconf/202018203006
CPEEE 2020

 Fig. 8. COP and SPF (top) and DHW tank heat loss (bottom) of
 ASHP in different locations

 The heat pump system efficiency decreases due to the
 operation under low inlet temperatures to the evaporator in
 high latitudes and/or altitudes. System SPF in all locations
 has less obvious trend than the trend for COP of the heat
 pump, but it is also decreasing with the latitude
 (see Figure 8). It is given by the fact that the heat loss of
 hot water storage tank is covered by heat pump and thus
 included in surplus electricity consumption and reflected
 in worsening the system parameter SPF, while COP
 characterizes only the efficiency of the heat pump alone.
 The heat loss from the hot water storage tank to the
 surroundings is also varying with the location, it is higher
 in warmer climate than it is in colder climate. It seems
 surprising at least for first sight, however it is logic and it
 is followed by detailed explanation.
 Fig. 7. SPF of heat pump system in different locations: top – The heat loss of storage tank to the surroundings occurs
 ASHP, bottom – GSHP. due to temperature difference between the storage tank
 volume and the surroundings (technical room where
 Figure 7 reflects that seasonal performance factor SPF storage tank is placed), as follows:
 of ASHP at considered locations is close to normal
 distribution with peak in value 3.0. On the other hand, ̇ = ( − ̅ ) (4)
 GSHP has two peaks for SPF near the 3.1 and 2.9 values. where is
 Also, one can see that GSHP outperforms ASHP in warm overall heat transfer coefficient of the
 climate (low latitudes) but has a bit worse efficiency in storage tank [W/(m2K)];
 mid- and high latitudes (mid- and cold climate). This fact
 surface area of the storage tank
 can be good explained from the Figure 3 that reveals the
 envelope [m2];
 heat pump coefficients of performance, and the GSHP has
 mean storage tank temperature [oC];
 a steeper global regression line of COP.
 ̅ room temperature [oC], for the
 As it is known the heat pump performance is dependent
 simulations considered to be constant
 on the condensing and evaporating temperatures, hence in
 and equal to 20 oC.
 case of air source heat pump technology on the condenser
 supply temperature (which is influenced by water mains
 As one can see from the Equation 3 the higher the
 temperature) and on the ambient temperature. Thus, the
 temperature difference between DHW tank and the
 only parameters that have a key influence on the heat pump
 surroundings, the higher heat loss rate under constant UA-
 COP and SPF are the ambient temperature and water
 value. Considering a stratification behavior of the DHW
 mains temperature.
 tank and that the temperature sensor is installed at the top

 4
E3S Web of Conferences 182, 03006 (2020) CPEEE 2020 https://doi.org/10.1051/e3sconf/202018203006
CPEEE 2020

 part of the tank (at 70 % of the tank height), the bottom
 part of the DHW tank after finished charging cycle is
 usually filled with the cold water and it is not mixed with
 the top part, due to the thermocline. Thus, the top part of
 DHW tank is heated up to the desired set temperature
 50 oC, however the bottom part remains at low temperature
 close to the temperature of cold water. Since the set
 temperature of the DHW tank is the same in all the
 simulations, temperature of the cold water mains has the
 Fig. 10 DHW tank standby hours versus different mean storage
 huge impact on the mean tank temperature. Therefore, the
 temperatures in three climate locations.
 lower the water mains temperature is the lower the mean
 tank temperature tST finally will be. Higher temperature of
 As it can be seen from Figure 9, mean water
 water mains in low latitude locations then results in higher
 temperature in the tank in cold climate is lower compared
 heat loss of DHW system (see Figure 8).
 with southern climate, this consequently causes lower rate
 To show the influence of water mains temperature on
 of heat loss to the surroundings (20 oC) in colder climate
 heat loss and further to seasonal efficiency expressed by
 (Helsinki) compared to warmer climate (Athens).
 SPF, three locations have been selected representing warm
 Further, for the Helsinki climate simulation (Figure 10)
 climate (Athens, Greece), medium climate (Strasbourg,
 the bottom part of storage tank is colder than surroundings
 France) and cold climate (Helsinki, Finland).
 leading to the heat flow direction to be from surrounding
 to the tank, i.e. bottom part of the storage tank obtains heat
 gains. This phenomenon has in its turn an influence on
 DHW tank heat loss at given location. Figure 10 also
 reveals a strong temperature stratification in case of colder
 water inlet to the DHW tank, which is no longer take place
 in warm climate (sensor 0.1).
 The observed bias of TES loss can be satisfactorily
 explained with Figure 10 presenting TES standby hours at
 each mean temperature in three climates. Selected system
 setup (component parameters, control settings, etc.) often
 results in higher mean temperature of the storage in warm
 climate (Athens) compared to cold climate (Helsinki).
 As discussed and concluded above, GSHP has a steeper
 regression line of COP (see Figure 3), nevertheless on the
 other hand system SPF is greater for ASHP than GSHP
 (Figure 7). To shed light on this discrepancy Figure 11
 compares GSHP evaporator inlet temperatures for three
 climates. If one compares average ambient air temperature,
 i.e. evaporator inlet temperature for ASHP, with average
 borehole outlet temperatures, i.e. evaporator inlet
 Fig. 9 System one-day simulation in Athens (upper) and Helsinki
 (lower) climate. temperature for GSHP, for the same location GSHP
 outperforms ASHP only in warm climate, despite the fact
 Simulation of one-day period is compared for the ambient air temperature Athens is 17.6 °C, while outlet
 significantly distinct locations Athens and Helsinki. of borehole keeps at level of 7.5 °C (Figure 11).
 Temperature in 5 positions of DHW tank relative height Temperature values for given locations are given in the
 (0.9 / 0.7 / 0.5 / 0.3 / 0.1) has been monitored during the Table 1.
 simulations. As it can be seen from Figure 10 the heat
 pump operates before large tapping in the evening (21 h) Table 1. Average evaporator inlet temperatures for ASHP and
 for cold climate causing mean DHW tank temperature to GSHP for three climate locations.
 drop after this tapping occurred, though monitoring
 temperature remains high enough for the heat pump Average borehole
 Heat pump Average ambient air
 outlet temperature
 controller not to start DHW tank charging again. Since technology / temperature (ASHP
 (GSHP evaporator
 there is no tapping during the night time the mean DHW location evaporator inlet)
 inlet)
 tank temperature is lower in comparison with the warmer Athens 17.6 7.5
 climate (Figure 10), where the heat pump operates even Strasbourg 9.8 1.5
 after last tapping in the day keeping the DHW tank charged Helsinki 4.5 -2.5
 and at high temperature.

 5
E3S Web of Conferences 182, 03006 (2020) CPEEE 2020 https://doi.org/10.1051/e3sconf/202018203006
CPEEE 2020

 study was around 3.1, the lowest – 2.4, however the GSHP
 simulations resulted in SPF of 3.2 - 2.0 range. Average
 SPF values were found to be 3.0 and 2.9 for ASHP and
 GSHP, respectively. Average values are in good
 correspondence with target values of the standard [3]
 which were given in the introduction.
 Though this study was limited to the same setup for all
 locations it demonstrated that such system (air- and
 ground-source performance does not drop lower than
 minimum value of 2.3, mainly due to lower DHW water
 intake temperature of 45 °C versus widely used 55 °C). It
 is worth to mention that the results obtained are in good
 compliance with the measurements of real installations [2].

 The authors would like to acknowledge the financial support
 received for this research from NPU (National Sustainability
 Program I, project No. LO1605).

 References
 1. Author, European Heat Pump Market and Statistics
 Report 2015 Executive Summary. pp. 7–10, EHPA,
 2015.
 2. M. Miara, “Efficiency of Heat Pumps in Real
 Operating Conditions – Results of three Monitoring
 Campaigns in Germany,” REHVA Eur. HVAC J., vol.
 51, pp. 5–12, 2014.
 3. EN 15450 Heating systems in buildings – Design of
 heat pump heating systems, CEN, 2008.
 4. U. of W.--M. S. E. Laboratory, TRNSYS, a transient
 simulation program. Madison, Wis.: The Laboratory,
 1975., 1975.
 5. E. Jones, T. Oliphant, P. Peterson, and others,
 “{SciPy}: Open source scientific tools for {Python}.”
 6. H. Drück and D.-I. H. habil Müller-Steinhagen
 Pfaffenwaldring, “MULTIPORT Store -Model for
 TRNSYS Stratified fluid storage tank with four
 internal heat exchangers, ten connections for direct
 charge and discharge and an internal electrical heater
 Type 340,” p. 27, 2006.
 7. G. Hellström, “Duct Ground Heat Storage Model,
 Manual for Computer Code,” Energy, no. March,
 1989.
 8. E. U. C. Regulation, EU Commission Regulation
 814/2013 implementing Directive 2009/125/EC of the
 European Parliament and of the Council with regard
 to ecodesign requirements for water heaters and hot
 water storage tanks, 2013, Brussel, 2013.
 9. D. W. Abrams and A. C. Shedd, “Effect of seasonal
 changes in use patterns and cold inlet water
 Fig. 11 GSHP evaporator inlet temperature: top – Athens, temperature on water-heating loads,” ASHRAE
 center – Strasbourg, bottom – Helsinki climate. Trans., vol. 102, pp. 1038–1053, 1996.

 4 Conclusions
 The system analysis shows that heat pump performance for
 hot water preparation is strongly dependent on the climate,
 i.e. ambient temperature and temperature of the water
 mains. The highest SPF reached by the ASHP during this

 6
You can also read