Measurement of the sound velocity of shock compressed water
←
→
Page content transcription
If your browser does not render page correctly, please read the page content below
www.nature.com/scientificreports
OPEN Measurement of the sound velocity
of shock compressed water
Hua Shu1*, Jiangtao Li2,3, Yucheng Tu1, Junjian Ye1, Junyue Wang4, Qili Zhang5, Huiru Tian4,
Guo Jia1, Zhiyu He1, Fan Zhang1, Zhiyong Xie1, Xiuguang Huang1, Wenbin Pei1 & Sizu Fu1
The sound velocities of water in the Hugoniot states are investigated by laser shock compression of
precompressed water in a diamond anvil cell. The obtained sound velocities in the off-Hugoniot region
of liquid water at precompressed conditions are used to test the predictions of quantum molecular
dynamics (QMD) simulations and the SESAME equation-of-state (EOS) library. It is found that the
prediction of QMD simulations agrees with the experimental data while the prediction of SESAME
EOS library underestimates the sound velocities probably due to its improper accounting for the
ionization processes.
Water at extreme conditions is one of the most concerned topics due to its significant abundance in icy giant plan-
ets like Uranus and N eptune1–5, as well as extrasolar ‘hot Neptunes’ and ‘mini-Neptunes’6,7. The thermodynamic
states of water inside the icy giant planets can be approximated by isentropic lines8, along which the derivative
of pressure with respect to density is the sound speed9. Since the sound speed is usually measured on a Hugoniot
line, the information of the intersection of the Hugoniot line with the local isentropic line is intrinsically carried
by the sound speed. Therefore, sound speed information is important if a planetary interior model needs to be
built purely based on experimental equation of state data. Apart from this, the sound speed data is also valuable
to test equation-of-state (EOS) models since as a second derivative of the Gibbs free energy they are generally
more sensitive to the minor differences between various EOS models.
The report on the sound speed of water at high pressure is scarce. However, the method of measuring the
sound speed of a material has been well established, especially in the case of gas gun e xperiment10, where the
thicknesses of the flyer and target can be measured precisely for determining the speed of the overtaking rar-
efaction waves. The technique becomes difficult to apply in the case of laser shock compression, which aims at
reaching higher pressure along the Hugoniot line. The difficulty is related to the fact that the position of the abla-
tion front is changing with respect to the laser intensity, the target material and the amount of ablated material11.
Recently, a new method is demonstrated to determine the sound speed of quartz under laser shock compres-
sion, which uses the bending boundary formed by the propagation of the lateral rarefaction wave into the shock
compressed region, as probed by a line-imaging Velocity Interferometer System for Any Reflector (VISAR)12.
In addition to that, there are other indirect methods proposed to determine the sound speed of materials under
laser shock compression, such as the detection of acoustic perturbations in the target with reference to that in
a standard material13–15. The establishment of these methods makes it possible to determine the sound speed of
water under laser shock compression.
In this work, we report the measurement of sound speed of water in the case of a combination of pre-com-
pression using diamond anvil cell (DAC) and laser shock compression. This technique makes it possible to obtain
the sound speed of water in the off-Hugoniot region with reference to the Hugoniot measurement of liquid water.
The experimental details and the results will be presented in the Experimental and Result and discussion sections.
Experiment
Figure 1 shows a schematic of the target assembly for water as well as the diagnostics. Doubly distilled pure water
was statically compressed to about 0.57 GPa (about 1.16 g/cm3 in density) between two diamond anvils. The front
anvil (150 μm in thickness) was coated by a gold film (1.5 μm in thickness) to eliminate preheating effects and a
polypropylene (CH) film (25 μm in thickness) to serve as the laser ablator. The rear anvil (1200 μm in thickness)
has an anti-reflection coating (with respect to the VISAR probe light at 660 nm) to enhance the signal-to-noise
1
Shanghai Institute of Laser Plasma, China Academy of Engineering Physics, ShangHai 201102, China. 2Fluid
Institute of Fluid Physics, China Academy of Engineering Physics, Mianyang 621900, Sichuan, China. 3State
Key Laboratory for Environment‑Friendly Energy Materials, Southwest University of Science and Technology,
Mianyang 621010, Sichuan, China. 4Center for High Pressure Science and Technology Advance Research,
ShangHai 201111, China. 5Institute of Applied Physics and Computational Mathematics, PeiJing 102311,
China. *email: shuhua1979@163.com
Scientific Reports | (2021) 11:6116 | https://doi.org/10.1038/s41598-021-84978-0 1
Vol.:(0123456789)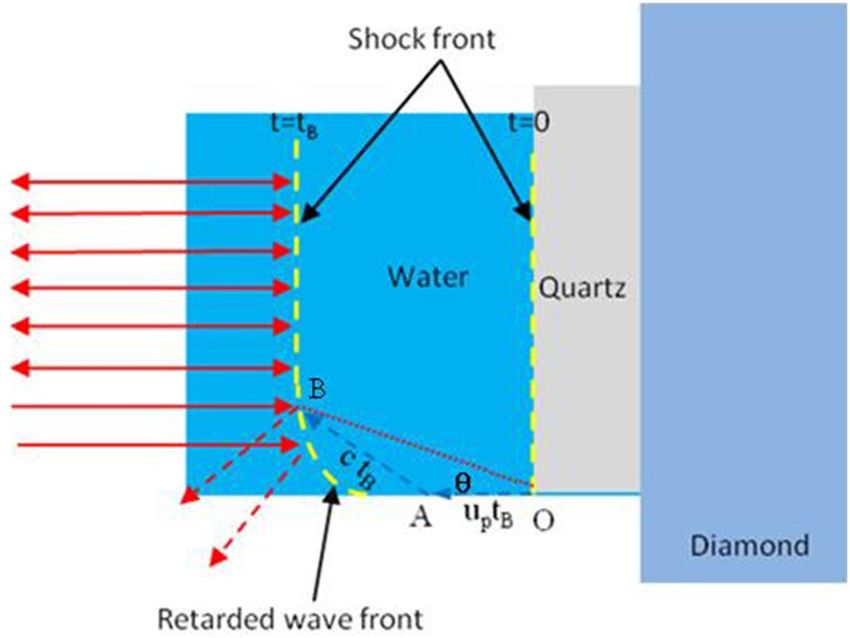
www.nature.com/scientificreports/
Figure 1. A schematic of experimental setup for laser shock compression of precompressed water in a DAC.
For the DAC precompression, the fluorescence peak of ruby is used to infer the initial pressure. For the laser
shock compression, a VISAR is used to determine both the Hugoniot state and the sound speed.
Figure 2. An illustration of how the shock wave front bends due to the propagation of the lateral rarefaction
wave.
ratio of the VISAR signals. In the chamber between the two anvils, there are a quartz plate, a ruby particle, and
the water sample. The quartz plate (with a 200 nm aluminum coating on the side contacting the diamond) serves
a standard material for performing impedance matching calculation to determine the Hugoniot state16. Under
static compression, the fluorescence signal from the ruby particle is used to determine the pressure of water17–19.
The density of water is inferred according to the well-determined equation of state up to 25 G Pa20.
For the dynamic compression, a square laser pulse (about 3 ns in duration, 351 nm in wavelength, 800–1500 J
in energy) generated from the Shenguang-II laser platform, is focused on the CH film with a spot size of about
0.65 mm in diameter. The interaction between the intense laser pulse and the CH film allows a strong shock
wave to propagate towards the statically compressed water sample. As shown in Fig. 1, the shock wave velocity is
monitored by a velocity interferometer system for any reflector (VISAR) system. Since both the shock velocities
before and after the arrival of the shock wave at the quartz-water interface are determined, the particle velocity
of shocked water can be inferred using the impedance matching m ethod21,22. As a consequence, both the pressure
and density of water after dynamic compression can be determined using the Hugoniot relations.
The sound velocity of water in the Hugoniot state can be determined from the bending boundary of the shock
wave front due to the interaction between the lateral rarefaction wave and the shock compressed region23, as
proposed by Li et al.24. This method is briefly illustrated in Fig. 2. Due to the propagation of the lateral rarefaction
wave, whose speed is essentially the sound speed in the Hugoniot state, the shock wave front narrows down in
the lateral direction. The trace of the bending boundary can be related to the triangle OAB illustrated in Fig. 2
and the sound speed (c) is expressed as,
us − up 2
c = us + tan2 θ (1)
us
Scientific Reports | (2021) 11:6116 | https://doi.org/10.1038/s41598-021-84978-0 2
Vol:.(1234567890)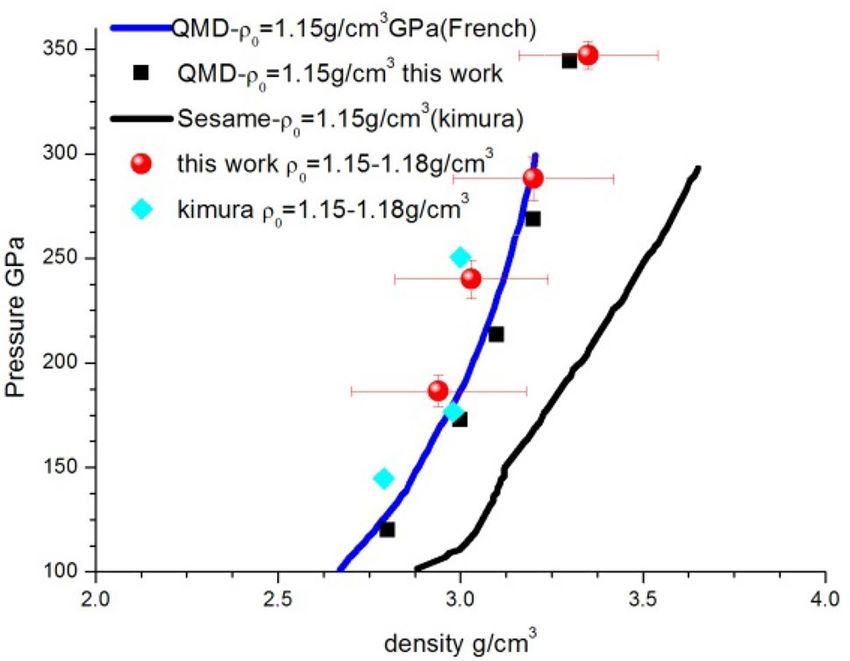
www.nature.com/scientificreports/
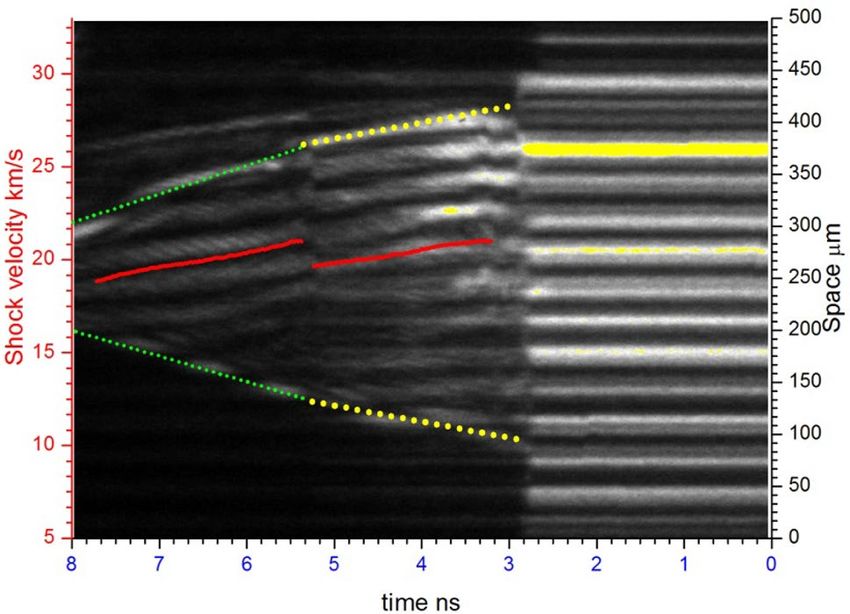
Figure 3. The bending boundary of the shock wave front monitored by the VISAR system. The trace of the
bending boundary is highlighted by the dotted line which is yellow in the quartz and green in the water. The
shock velocities for impedance matching calculation are also shown by the red solid line.
Shot ρ0 (g/cm3) UsW (km/s) PW (GPa) ρw (g/cm3) C (km/s)
1 1.166 19.72 (0.19) 288.1 (10.7) 3.20 (0.22) 16.12 (1.45)
2 1.171 18.26 (0.18) 240.0 (9.2) 3.03 (0.21) 14.54 (1.20)
3 1.153 16.32 (0.16) 186.6 (7.4) 2.94 (0.24) 14.05 (1.30)
4 1.171 21.20 (0.21) 342.2 (6.8) 3.35 (0.19) 17.70 (1.60)
Table 1. Experimental conditions of initial precompressed water (density) and shocked water (shock velocity,
pressure, density). Uncertainties are given in parentheses.
where, us is the shock velocity. up is the particle velocity. θ is the bending angle of the shock wave front which
is equivalent to the angle formed by OA and OB in Fig. 2. Therefore, with the shock velocity monitored by the
VISAR system and the particle velocity determined by the impedance matching method, the sound speed of
water can be obtained from the bending boundary of the shock wave front.
Results and discussion
The VISAR image of the bending boundary of the shock wave front is shown in Fig. 3. From this VISAR image,
we obtained two pieces of information. One is the shock velocities in the quartz and in the water, which can be
used to determine the Hugoniot state of water at the quartz-water interface. The other is the associated sound
velocity of water at the quartz-water interface, derived from the trace angle as illustrated in Fig. 2. Four shots of
water with nearly same initial precompressed pressure(0.6 GPa) were performed. The experimental conditions
of initial precompressed water (density) and shocked water (shock velocity, pressure, density and sound velocity)
are listed in Table 1. Figure 4 shows the comparison between our data with previous data.
The variation of the sound velocity of water with respect to the Hugoniot pressure is shown in Fig. 5. It is
shown that the sound velocity increases with the Hugoniot pressure, in good agreement with the prediction of
quantum molecular dynamics (QMD), which uses Vienna Ab Initio Simulation Package (VASP) to calculate
the electronic structure of 54 water molecules in a periodic simulation box. Projector augmented wave (PAW)
pseudopotentials with a cutoff energy of 1000 eV for electron–ion interaction and Perdew-Burke-Ernzerhof
(PBE) exchange–correlation functional25–27 are used. For the molecular dynamics simulation, the time step for
ion motion varies from 0.35 to 1.0 fs according to the temperature. The sound velocity is derived from the fol-
lowing relationship:
2
∂P T ∂P
c2 = + 2 (2)
∂ρ T CV ρ ∂T ρ
Here, the differential terms are determined from the slopes of isothermal or isochoric lines in the pressure-
density and pressure–temperature spaces, and the heat capacity at constant volume is determined from the
slopes of isochoric lines in the internal energy-temperature space. In contrast with the good agreement between
the experimental data and QMD result, the SESAME equation-of-state l ibrary28,29 predicts a much lower sound
velocity along the Hugoniot pressure. This is probably because the ionization processes, which was not well
Scientific Reports | (2021) 11:6116 | https://doi.org/10.1038/s41598-021-84978-0 3
Vol.:(0123456789)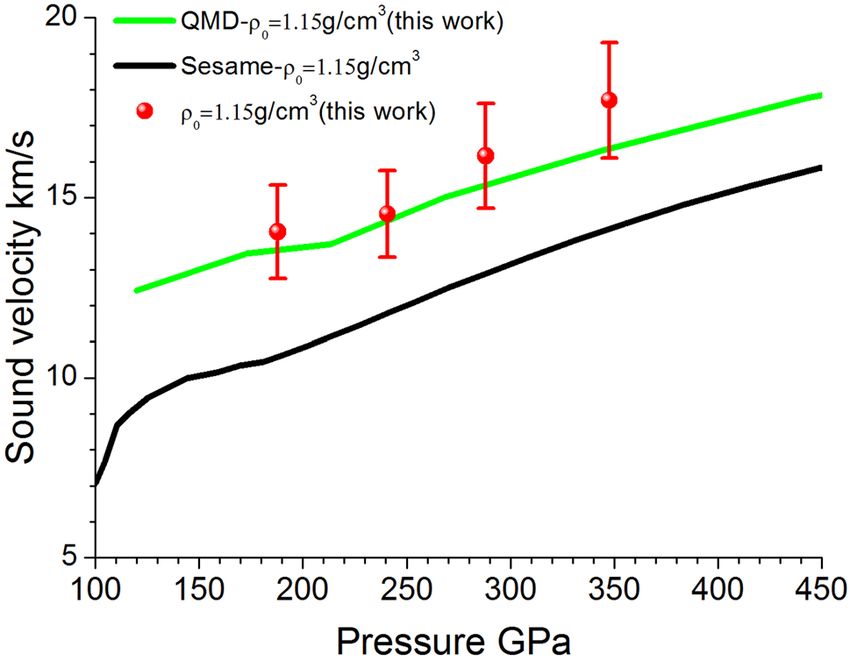
www.nature.com/scientificreports/
Figure 4. Density and pressure relations for shocked water with initial density of 1.15 g/cm3. Our experiment
imura15 in cyan diamond, QMD EOS model (kimura’s in blue line, this work in black
data in red circle and K
square) and Sesame Model in black line.
Figure 5. The variation of the sound velocity of water with its Hugoniot pressure: a comparison between
experimental data and theoretical predictions.
accounted in the model of Ree29, plays an important role and number of freedoms released result in the increase
of sound velocity.
Conclusions
The sound velocities of water in the Hugoniot states are determined by monitoring the propagation of lateral
rarefaction waves into the shock compressed region using a VISAR system. The Hugoniot states are generated
by laser shock compression of precompressed water in a DAC, which lies in the off-Hugoniot region of liquid
water at ambient conditions. The relation between the sound velocity and the Hugoniot pressure indicate that
QMD is more accurate in predicting the sound velocity of water than the widely used SESAME equation-of-state
library, which accounts poorly for the ionization processes.
Received: 1 July 2020; Accepted: 21 January 2021
References
1. Hubbard, W. B. Neptune’s deep chemistry. Science 275, 1279–1280 (1997).
2. Millot, M. et al. Experimental evidence for superionic water ice using shock compression. Nat. Phys. 14, 297–302 (2018).
3. Chau, R. et al. Chemical processes in the deep interior of uranus. Nat. Commun. 2, 1–5 (2011).
4. French, M. et al. Equation of state and phase diagram of water at ultrahigh pressures as in planetary interiors. Phys. Rev. B. 79,
054107 (2009).
Scientific Reports | (2021) 11:6116 | https://doi.org/10.1038/s41598-021-84978-0 4
Vol:.(1234567890)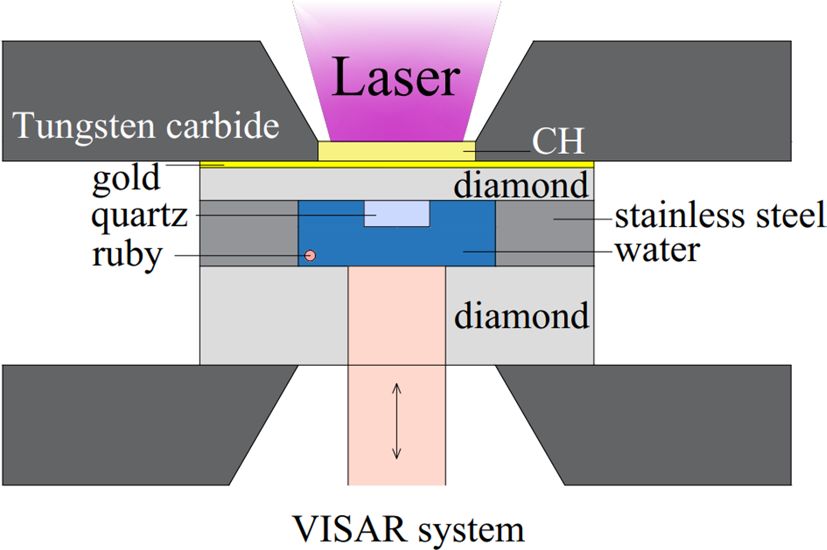
www.nature.com/scientificreports/
5. Millot, M. et al. Nanosecond X-ray diffraction of shock-compressed superionic water ice. Nature 569, 251–255 (2019).
6. Borucki, W. J. et al. A 2.4 earth-radius planet in the habitable zone of a sun-like star. Astrophys. J. 736, 1–22 (2011).
7. Knudson, M. D. et al. Probing the interiors of the ice giants: shock compression of water to 700 GPa and 3.8 g/cm3. Phys. Rev. Lett.
108, 091102 (2012).
8. Redmer, R. et al. The phase diagram of water and the magnetic fields of uranus and neptune. Icarus 211, 798–803 (2011).
9. Landau LD et al. Fluid Mechanics (Pergamon Press 1987)
10. Nguyen, J. H. et al. Molybdenum sound velocity and shear modulus softening under shock compression. Phys. Rev. B. 89, 174109
(2014).
11. Fratanduono, D. E. et al. The direct measurement of ablation pressure driven by 351-nm laser radiation. J. Appl. Phys. 110, 073110
(2011).
12. Celliers, P. M. et al. Line-imaging velocimeter for shock diagnostics at the OMEGA laser facility. Rev. Sci. Instrum. 75, 4916–4926
(2004).
13. Fratanduono, D. E. et al. Hugoniot experiments with unsteady waves. J. Appl. Phys. 116, 033517 (2014).
14. McCoy, C. A. et al. Measurements of the sound velocity of shock-compressed liquid silica to 1100 GPa. J. Appl. Phys. 120, 235901
(2016).
15. Fratanduono, D. E. et al. Measurement of the sound speed in dense fluid deuterium along the cryogenic liquid Hugoniot. Phys.
Plasma. 26, 012710 (2019).
16. Kimura, T. et al. P-ρ-T measurements of H2O up to 260 GPa under laser-driven shock loading. J. Chem. Phys. 142, 164504 (2015).
17. Mao, H. K. et al. Specific volume measurements of Cu, Mo, Pd, and Ag and calibration of the ruby fluorescence pressure gauge
from 0.06 to 1 Mbar. J. Appl. Phys. 49, 3276–3283 (1978).
18. Popov, M. Pressure measurements from raman spectra of stressed diamond anvils. J. Appl. Phys. 95, 5509–5514 (2004).
19. Chijioke, A. D. The ruby pressure standard to 150GPa. J. Appl. Phys. 98, 114905 (2005).
20. Rice, M. H. & Walsh, J. M. Equation of state of water to 250 Kilobars. J. Chem. Phys. 26, 824–830 (1957).
21. Brygoo, S. et al. Analysis of laser shock experiments on precompressed samples using a quartzreference and application to warm
dense hydrogen and helium. J. Appl. Phys 118, 195901 (2015).
22. Knudson, M. D. & Desjarlais, M. P. Adiabatic release measurements in α-quartz between 300 and 1200 GPa: characterizationof
α-quartz as a shock standard in the multimegabar regime. Phys. Rev. B 88, 184107 (2013).
23. Zel’dovich,Y.B., Raizer, Y.P. Physics of shock waves and high-temperature hydrodynamic phenomena (Academic Press,1968).
24. Li, M. et al. Continuous sound velocity measurements along the shock hugoniot curve of quartz. Phys. Rev. Lett. 120, 215703
(2018).
25. Perdew, J. P. et al. Generalized gradient approximation made simple. Phys. Rev. Lett. 77, 3865–3868 (1996).
26. Kresse, G. & Hafner, J. Ab initio molecular dynamics for liquid metals. Phys. Rev. B. 47, 558 (1993).
27. Kresse, G. & Furthmuller, J. Efficient iterative schemes for ab initio total-energy calculations using a plane-wave basis set. Phys.
Rev. B. 54, 11169 (1996).
28. SESAME-7150, Los Alamos National Laboratory SESAME Library, 1994.
29. Ree, F.H. Molecular interaction of dense water at high temperature. 76, 6287–6302 (1982).
Acknowledgements
The authors gratefully acknowledge the valuable support for the experiments by the “SG-II” technical crews.
Helpful discussion with Prof. Toshimori Sekine is greatly appreciated. This research is supported by both the
Science Challenge Project (Grant No. TZ2016001) and the National Key R&D Program of China (Grant No.
2017YFA0403200).
Author contributions
H.S conceived the experiments, Y.H.T, J.J.Y, H.R.T, Z.Y.X and J.Y.W made the target, Q.L.Z performed the simu-
lations, J.T.L wrote the manuscript, G.J, Z.Y.H and F.Z prepared Figs. 1, 2, 3. X.H, W.B.P, S.Z.F prepared Figs. 4,
5. All authors discussed results and commented on the manuscript.
Competing interests
The authors declare no competing interests.
Additional information
Correspondence and requests for materials should be addressed to H.S.
Reprints and permissions information is available at www.nature.com/reprints.
Publisher’s note Springer Nature remains neutral with regard to jurisdictional claims in published maps and
institutional affiliations.
Open Access This article is licensed under a Creative Commons Attribution 4.0 International
License, which permits use, sharing, adaptation, distribution and reproduction in any medium or
format, as long as you give appropriate credit to the original author(s) and the source, provide a link to the
Creative Commons licence, and indicate if changes were made. The images or other third party material in this
article are included in the article’s Creative Commons licence, unless indicated otherwise in a credit line to the
material. If material is not included in the article’s Creative Commons licence and your intended use is not
permitted by statutory regulation or exceeds the permitted use, you will need to obtain permission directly from
the copyright holder. To view a copy of this licence, visit http://creativecommons.org/licenses/by/4.0/.
© The Author(s) 2021
Scientific Reports | (2021) 11:6116 | https://doi.org/10.1038/s41598-021-84978-0 5
Vol.:(0123456789)You can also read