Informal settlements' vulnerability mapping in Kenya - The Case of Kilifi Town Settlements - UN ...
←
→
Page content transcription
If your browser does not render page correctly, please read the page content below
Informal settlements’
 vulnerability mapping in Kenya
FA C I L I T I E S A N D PA RT N E R S ’ M A P P I N G F O R I N F O R M A L S E T T L E M E N T S I N K E N YA

The Case of Kilifi Town Settlements
                                               October, 2020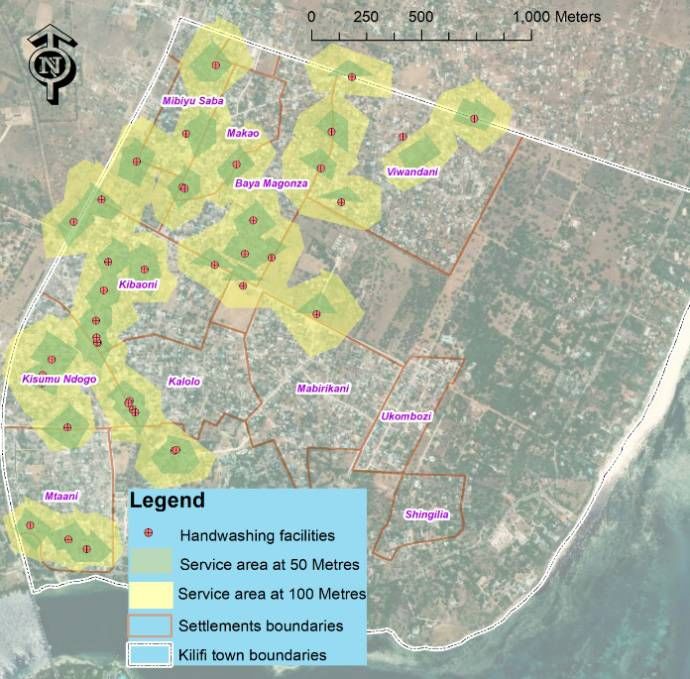
The Case of Kilifi Town Settlements

              Contents

              Overview............................................................................................ 3
              The mapping Approach ............................................................................................. 3

              Survey Limitations ..................................................................................................... 3

              The Informal Settlements of Kilifi.................................................... 4

              The survey and State of Settlements............................................... 5
              1. State of WASH........................................................................................................ 6

              2. Access to Health Facilities..................................................................................... 14

              3. State of Education ................................................................................................ 15

              4. State of Social Halls/ Meeting places ................................................................... 16

              5. Access to Public Transport .................................................................................... 17

              6. State of Public Spaces ........................................................................................... 18

              7. Organizations Supporting in Service Provision...................................................... 19

              Key observations........................................................................................................ 20

              Summarizing the Mapping .............................................................. 21

 2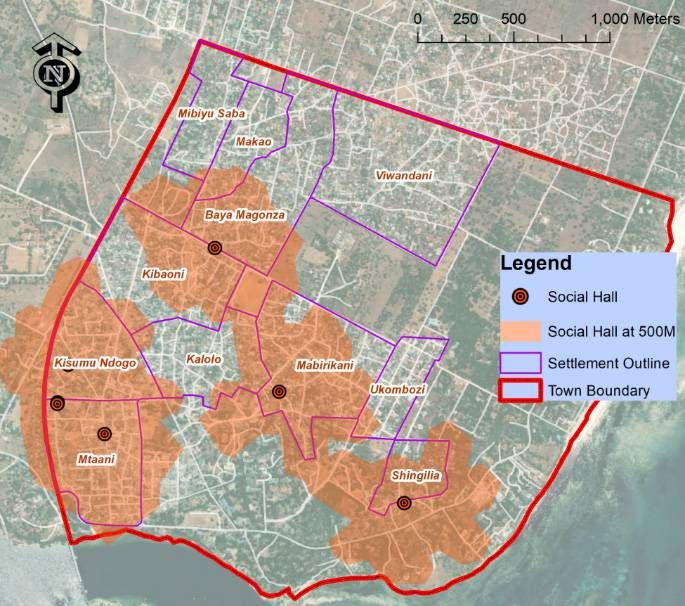
3

  OVERVIEW

Globally, cities are and have recorded         Kisumu, Nakuru and Kilifi town/cities          facilities (water points, handwashing
the highest number of covid-19 cases.          and comprehensively mapped all the             facilities, solid waste disposal sites,
In sub-Saharan Africa and many other           key facilities and development partners        communal toilets, and bathrooms),
developing regions with more presence          operating in those informal settlements.       health facilities, including chemists and
of slums in cities, covid-19 is likely to      This was done with a goal to identify          pharmacies, community spaces (halls and
spread faster and also take longer to          gaps and limitations in service provision,     public spaces) and institutional spaces
control once it crosses into the slum          access to services and support by              such as schools, local NGO offices,
and informal settlements’ populations.         development partners. The mapping              administrative offices and religious
With high tenure insecurity, low-quality       outputs identified critical gaps that can      institutions.
housing, limited access to basic services,     be helpful when planning for responses
and poor sanitation, informal settlements      to covid-19 or any other emergency             Data collection utilized a mobile phone
offer the perfect settings for risk            response in these slums. The newly             application hosted on an open source
factors to accelerate the spread of any        collected data on sample of informal           data collection toolbox (KoboToolbox).
infectious disease. Informal settlements       settlements advances the discourse             Field data collection was done by
are also classified as highly vulnerable       and policy dialogue on how to improve          community volunteers, who were trained
to numerous risks including climate            the lives of people who live in informal       by UN-Habitat experts over a period of
change impacts, disasters, and socio-          settlement, and ensure that no one is left     one day. Community volunteers were
economic shocks. This is because they          behind in COVID-19 response.                   drawn from the targeted slums which
are densely populated, and households                                                         allowed them to work for extended
have inadequate access to water and                                                           hours. In addition, UN-Habitat ensured
sanitation, little or no access to waste                                                      that there was gender-balance among
management, public transport and limited       The mapping Approach                           the volunteers who participated in this
access to formal employment and health                                                        exercise.
care facilities.                               This report focuses on the study findings
                                               for the informal settlements in Kilifi town.
In Kenya, informal settlements vary in         The mapping exercise was carried out           Survey Limitations
size, character and their levels of need       between 21st and 26th September, 2020
vary among and within settlements.             and involved field data collection on          Like most informal settlements in Kenya,
Governments and numerous agencies              two aspects: - households and facilities.      the informal settlement areas of Kilifi are
work in informal settlements, each             For the household survey, the mapping          well known by authorities but have not
addressing a specific felt need in line with   sampled households within the study            been spatially demarcated. Delimitation
its organizational goals, often with little    informal areas and sought to establish         of the boundaries for use in the study as
coordination. Consequently, access to          the levels of access to services and           units of analysis was therefore done using
services has not been evenly distributed       costs associated to service provision,         GIS technologies with the support of local
across settlements, resulting in pockets of    particularly on WASH aspects.                  experts. It has been noted that there are
spatially disadvantaged communities.                                                          formal areas within informal areas and
                                               For facilities mapping, the survey             vice versa which has limited generation
In this mapping exercise, the UN-              collected data on more than 18 facility        of spatial statistics exclusive to informal
Habitat sampled settlements in Nairobi,        types, including water and sanitation          settlements.

                                                                                                                                        3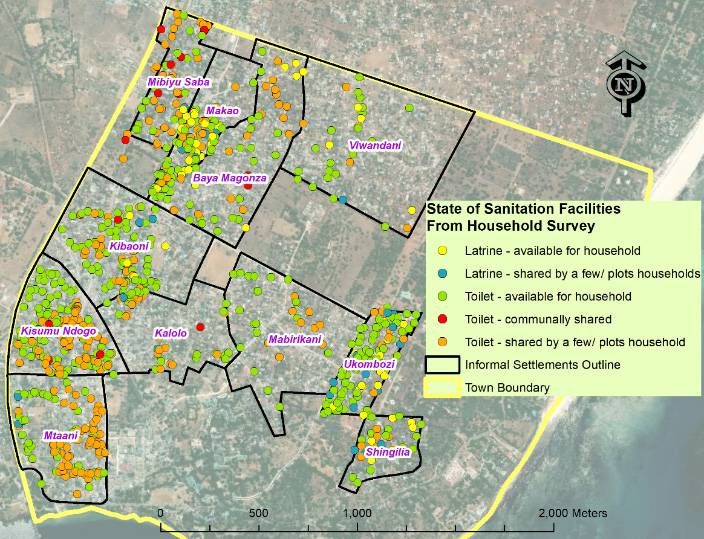
The Case of Kilifi Town Settlements
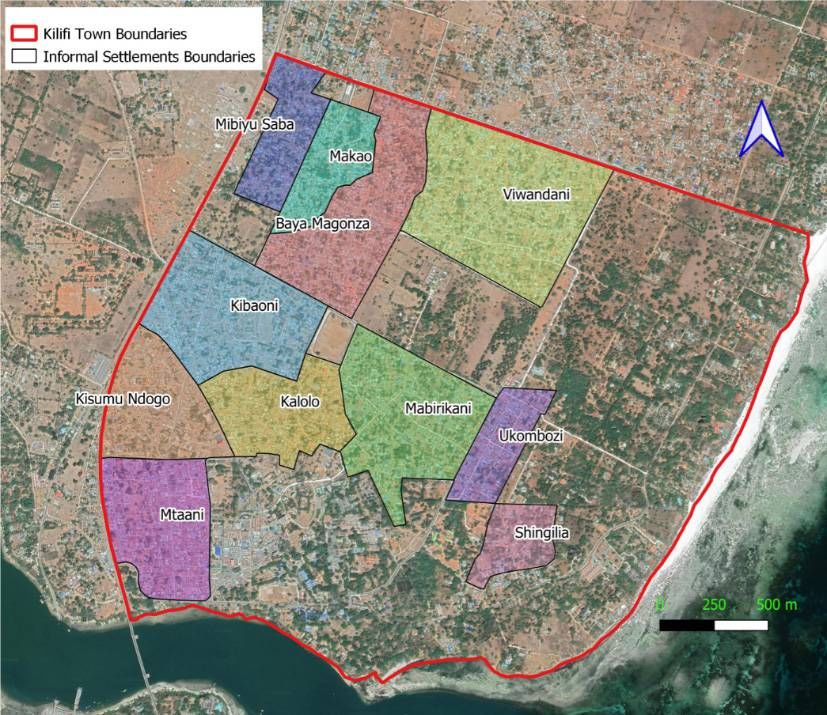
THE INFORMAL SETTLEMENTS OF KILIFI
Kilifi town, which is the county The town has a population of 122,899 With the help of key informants, this
headquarters of Kilifi County, is a Kenya (KNBS1, 2019) and while the proportion survey identified, 11 informal settlement
coastal town, 56 kilometres northeast by of its population in informal settlements areas within the town, namely:
road of Mombasa. The town lies on the is not officially documented, estimates
Kilifi Creek and sits on the estuary of the during the field survey shows that the Kisumu Ndogo, Mibiyu Saba, Makao,
Goshi River. number could be above 50%. Mabirikani, Baya Magonza, Kibaoni,
Viwandani, Ukombozi, Mtaani, Kalolo and
Shingilia (Figure 1).
Figure 1: Informal Settlement areas of Kilifi
1. Kenya Population and Housing Census, Vol II (2019).
4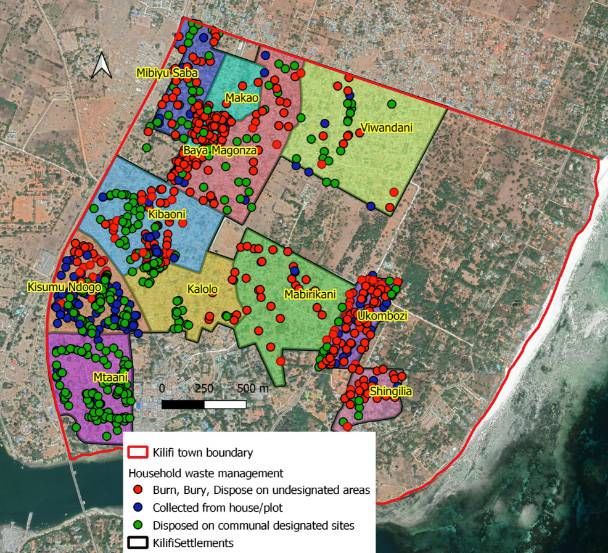
The Case of Kilifi Town Settlements

  THE SURVEY AND STATE OF SETTLEMENTS

The survey mapped 1,261 data points,                 Kisumu Ndogo and Kalolo (estimated at 13      average family sizes in Kenya. An
827 of which covered household data.                 persons per grid of 900m2) (Figure 3).        assessment of housing structures
The rest of the data points covered                                                                shows that there are huge variations in
shared community facilities (Figure 2).              From the sampled households, the              settlement typologies, with range from
Application of High Resolution Settlement            average household size is 7.5 persons,        thatched mud houses to row stone-walled
Population Layer, 20192, revealed that               which is significantly higher than the        housing (Figure 4).
population densities are higher in Kibaoni,

Figure 2 and 3: Data points and population distribution in settlements                  Figure 4, 5 and 6: Variations in Kilifi’s informal settlements’
                                                                                        housing typologies

2. Data.humdata.org

                                                                                                                                                          5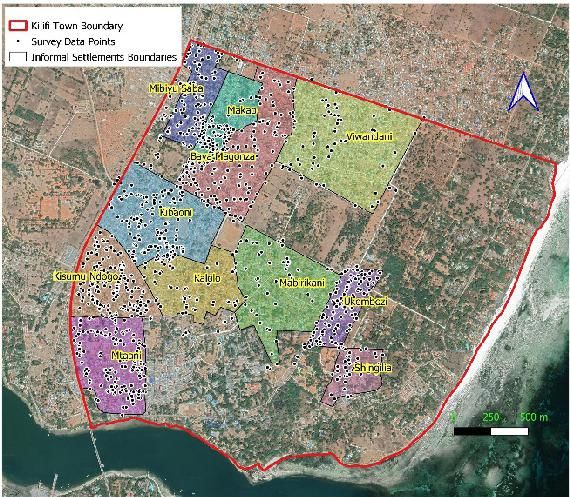
The Case of Kilifi Town Settlements

     1. State of WASH

     i) Access to Water

     The challenge of water supply in the                      to the main water supply managed by            have numerous boreholes which
     settlements was evident during the                        Kilifi-Mombasa Water and Sanitation            complements the county water supply
     survey. While the survey established that                 Company (KIMAWASCO), the settlements           (Figure 7 to 11).
     majority of the households are connected

                   Mtaani
                  Kibaoni                                                                                                             Piped to plot or
                                                                                                                                      sourced from a
               Mabirikani
                                                                                                                                      community borehole
               Ukombozi
                   Kalolo
                                                                                                                                      Piped to plot to a tap
                   Makao                                                                                                              shared by a few
            Mibuyu Saba                                                                                                               households
                 Shingila
           Baya Magonzi                                                                                                               Sourced from
               Kiwandani                                                                                                              neighbouring plot
     Kisumu Ndogo (GTZ)

                            0%       10%       20%        30%         40%       50%      60%      70%        80%    90%      100%
     Figure 7: Sources of water by settlements

     Majority of the water points are in poor conditions (Figure 8, 9 and 10), and majority of households rely on 20 litres’ plastic containers
     to transport and store water (Figure 11).

     Figure 8 – 11: State of water supply in the settlements

     Water points in the settlements are                       Ninety-one (91%) of household pay for          While access to water points is not a
     generally within convenient distances to                  water, with the average cost of water          major problem, water reliability is; on
     households; only 10.3% of the surveyed                    being Kes. 5 per 20 litres gallon, or about    average, water from different sources is
     households source water at more than                      Kes. 700 – 1000 per month. The main            accessed 4 days a week (Figure 14).
     100 metres from their homes (Figure 12).                  water supplier to settlement is County
                                                               Government through the KIMAWASCO
     These households are majorly in Kibaoni,                  (Figure 13).
     Mabirikani, Mtaani and Kalolo (Figure 12).

 6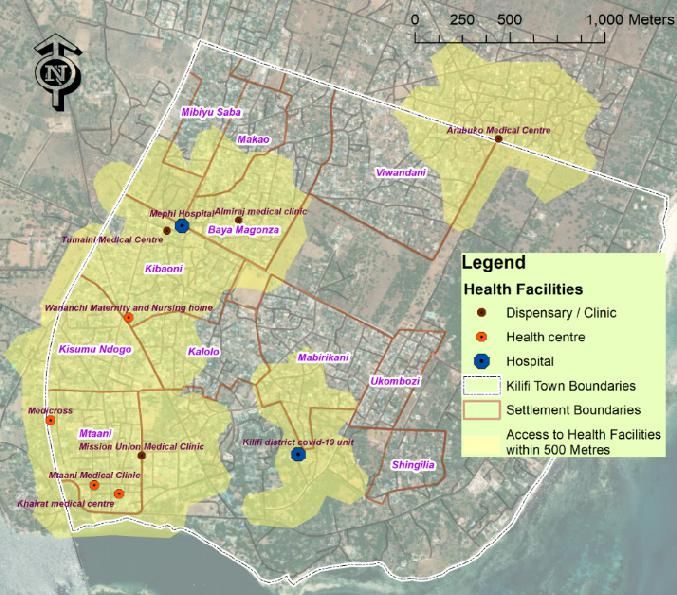
The Case of Kilifi Town Settlements

Figure 12: Access to water points for households within 100 metres

                                                             The County Government
                 129                                              Private companies

                                                       Individual (business owners)
           163
                               532                              Estate management

                                                                                      0%           20%          40%           60%          80%          100%
                                                                                           No - has not functioned the last month
                                                                                           Very rarely functions - very occasional, not predictable
                                                                                           Rarely functions (less than 2 days/week or 8 times/month)
              The County Government
                                                                                           Mostly available (more than 4 days/week or 16 times/month)
              Private companies
                                                                                           Yes - always available
              Individual (business owners)
Figure 13 and 14: Water suppliers and reliability of Water

There is need for the actors managing piped water supply to increase supply time. The desired levels of hygiene during the
COVID-19 period require regular access to water by households --- at least for a number of hours every day.

                                                                                                                                                               7
The Case of Kilifi Town Settlements

     ii) Access to Handwashing

     The survey mapped 41 handwashing                     their homes respectively (Figure 15 &            road) and therefore justified to have more
     facilities across the settlements. Only 20%          16). Despite the fact that the settlements       facilities, there were no facilities mapped
     and 50% of the settlements population                in the eastern part of town are closer to        at the settlements of Ukombozi and
     are able to access these handwashing                 market locations (along major tarmac             Singilia, which is a significant action gap.
     facilities within 50 and 100 metres from

      100

       80

       60

       40

       20

        0
               Mabirikani        Kalolo          Mtaani         Viwandani         Makao          Kibaoni   Baya Magonza    Mibiyu Saba   Kisumu Ndogo

                                                                  Access at 50m        Access at 100m
     Figure 15 and 16: Access to handwashing facilities within 50 and 100 metres respectively

 8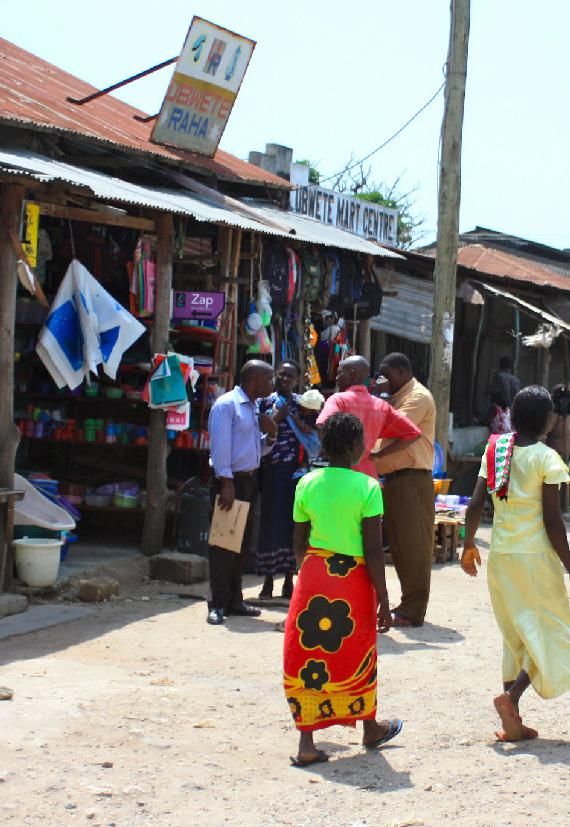
The Case of Kilifi Town Settlements

It was noted that the existing facilities          management, which could imply that                    most facilities installed, and the Month
are largely under the management                   they were left unmaintained after their               of September having the fewest facilities
of individuals/ private entities, which            installation by donors.                               (Figure 18). This is a pointer to the need
implies that their sustenance is                                                                         for renewed efforts at increasing the
dependent more on individuals and less             It is also notable that the number of new             facilities coverage, especially in the
on the government (Figure 17). A good              facilities has been reducing over time,               settlements without any facilities.
number of facilities are under ‘no ones’           with the month of March having the

160                                                                                                                                         153

140

120

100

 80                                                                                                                     71

 60

 40
                                                                                                 27
                                                         15                  16
 20                                 10
                7

  0
        Private company    National government Community group              NGO                 No one         County government       Individual (eg
                                                                                                                                      business owner)

Figure 17 and 18: Management of handwashing facilities and number of new facilities by months

It is concerning that 90% of the mapped            (about 20 litres containers), and keeping             water and soap at all facilities; currently,
handwashing facilities are manually                them usable require regular refilling. To             only 38% and 75% of facilities have soap
fed with water; this could impact of               ensure facilities’ sustainability, there is           and water respectively throughout the
their sustainability because most of the           need to ensure full time availability of              day.
facilities have small storage capacities

                                                                                                                                                        9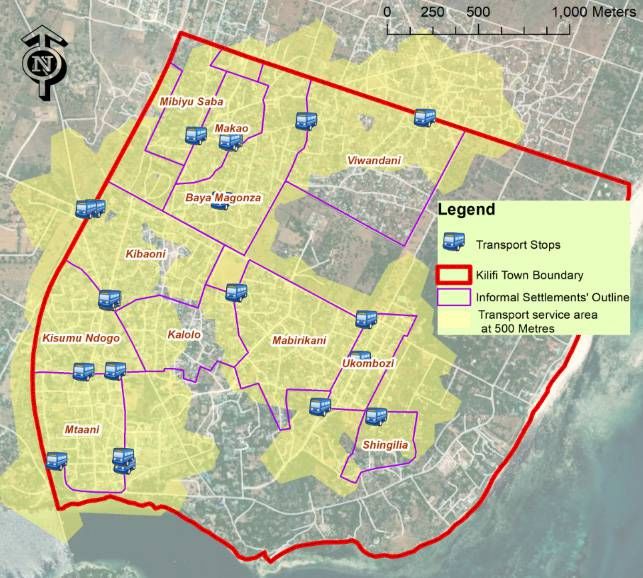
The Case of Kilifi Town Settlements

  iii) The State of Sanitation

  The settlements have mixed sanitation                    toilets or toilets shared by a few families.        Ndogo. Mibiyu Saba has the highest
  facilities, with a huge majority of                      Settlements where there are more shared             number of communally shared sanitation
  households using either household                        toilet facilities include Mtaani and Kisumu         facilities (Figure 19 and 20).

                 Kalolo
                Mtaani
           Mibuyu Saba
          Baya Magonzi
     Kisumu Ndogo (GTZ)
             Mabirikani
                Kibaoni
               Shingila
             Kiwandani
                Makao
              Ukombozi

                          0%          10%          20%          30%         40%          50%           60%         70%         80%           90%            100%

                           Toilet - shared by a few/ plots household      Latrine - shared by a few/ plots households    Toilet - available for household
                           Toilet - communally shared                     Latrine - available for household

  Figure 19 and 20: Sanitation facilities by settlements

10
The Case of Kilifi Town Settlements
A key challenge to hygiene identified by the survey is lack of water and soap at the sanitation facilities. This particularly affects toilets
and latrines shared by a group of households (Figure 21).
Toilet - shared by a few/ plots household
Toilet - communally shared
Toilet - available for household
Soap
Latrine - shared by a few/ plots households
Latrine - available for household
Toilet - shared by a few/ plots household
Toilet - communally shared
Water
Toilet - available for household
Latrine - shared by a few/ plots households
Latrine - available for household
0% 10% 20% 30% 40% 50% 60% 70% 80% 90% 100%
All the time 1 -2 days per week
At least 3 days per week At least 5 days per week
Rarely - can be without water for a week Very rarely - has not had water in the 2 weeks
Figure 21: Availability of Soap and Water at sanitation facilities
Communally shared sanitation facilities are in fair to dilapidated conditions, with most of them requiring renovation, equipping with
handwashing facilities and drainage work.
Figure 22 and 23: State of communal sanitation facilities
11The Case of Kilifi Town Settlements
iv) Solid Waste Management
A total of 77 solid waste collection points were mapped, out of which only 14 were bins, the rest being open dumping locations. A
huge majority of waste collection points are in poor conditions (Figure 24- 26).
Dilapidated
7%
Good
36%
Fair
57%
Figure 24-26: State and condition of solid waste collection sites
Households that reported to have their waste disposed on designated locations or collected from plots or households are at Mtaani
and the southern parts of Kisumu Ndogo. Majority of the other households burn, or dispose waste in undesignated locations (Figure
27 and 28).
Figure 27: Solid waste collection points and nature of solid waste management by households
12The Case of Kilifi Town Settlements
Mabirikani
Makao
Shingila
Ukombozi
Baya Magonzi
Kibaoni
Mibuyu Saba
Kiwandani
Kisumu Ndogo (GTZ)
Kalolo
Mtaani
0% 10% 20% 30% 40% 50% 60% 70% 80% 90% 100%
Burn, Bury, Dispose on undesignated sites Collected from house/plot Disposed on communal designated sites
Figure 28: Solid waste collection points and nature of solid waste management by households
The government is currently managing less half of the generared waste (Figure 29). Solid waste is a health hazard, especially during
the wet seasons (Figure 30).
1%
42%
54%
3%
Community Group Individuals
Private Companies The County Government
Figure 29 and 30: Organizations managing solid waste and solid waste blocking drainage channels
13The Case of Kilifi Town Settlements
2. Access to Health Facilities
The survey mapped 10 health facilities:
2 hospitals, 4 health centres, 4 clinics/
dispensaries. These facilities are largely
accessible to most homes within 500
metres (Figure 31). Settlements that have
at least 30% of their population unable to
access a health facility within 500 metres
are Viwandani, Mibiyu Saba, Ukombozi
and Shingilia. Except the COVID-19 Kilifi
Hospital, other health facilities within
the settlements are privately managed.
Incidentally, all the mapped health
facilities are equipped with essential
services (Water, Electricity, Sanitation,
Solid waste management, Sewer
Connection), except for 3 which lack
connection to sewer. Observations during
field survey showed that social distancing
measures are observed in major health
facilities, and access to handwashing
facilities has been ensured (Figure 32).
Figure 31 and 32: Location of health facilities and a health facility in the settlements respectively
14The Case of Kilifi Town Settlements
3. State of Education
Thirty-five (35) education facilities were
mapped, their levels being pre-primary,
primary and secondary schools. There
are no tertiary institutions located within
the informal settlements areas, but
the institutions are accessible at the
settlements vicinity.
Majority of the homes within the
settlements are located less than 500
metres from the nearest education
facility. An assessment of distances from
homes to pre-primary schools shows
that Ukombozi, Mariakani and Kalolo
have majority of pre-primary pupils
walking more than 500 metres to access
an education facility. There is need for
additional facility in these areas (Figure 33
and 34).
It is notable that at least 60% mapped
education facilities are privately owned
and run (Figure 35). The facilities are
however largely equipped with most key
Figure 33: Location of education facilities and access service areas within 500 metres services, with only a few requiring sewer
0.45 100 connections.
0.4 90
80
0.35 Religious Institution
70
0.3
60
0.25
NGO
50
0.2
40
0.15
30 National government
0.1
20
0.05 10
Private (Individual
business owners)
0 0
0 10 20
Secondary school
Primary School
Pre-primary
Area (SqKM) Percentage (%)
Figure 34: Location of education facilities and access service areas within 500 metres Figure 35: Management of education facilities
15The Case of Kilifi Town Settlements
4. State of Social Halls/ Meeting places
A total of 7 social halls were mapped. The
halls are open for all, and using spatial
analysis, the survey established that over
50% of the homes in the settlement can
access the halls within 500 metres. All
the halls are in usable conditions, and
settlements with poor access to halls
include Viwandani, Mibiyu Saba and
Ukombozi.
The study has further revealed that
social halls and religious facilities lack
solid waste management systems
and connections to the sewer system.
Religious facilities have better access to
water, electricity and sanitation services
than social halls – while only about 15%
of religious facilities lack the three, this
figure is at 30% for social halls (Figure 45
and 46).
Halls are generally in good conditions and
are accessible to the residents; 11 out of
the 14 mapped halls are accessed for free
Figure 36: Access to social halls at 500 metres while the rest charge between Kes. 500
to Kes. 3,000 to users per day.
The mapped halls are well equipped with
the necessary infrastructure, with only 2
lacking connection to the sewer, 1 lacking
0.45 100 connection to water and 1 lacking solid
90 waste management system.
0.4
0.35 80
8
70
0.3
60 7
0.25
50 6
0.2
40 5
0.15
30 4
0.1 20
3
0.05 10
2
0 0
1
0
Sewer Water Solid Waste Electricity Sanitation
connection Management facilities
Area (SqKM) Percentage (%)
Figure 37: Access to social halls at 500 metres Figure 38: Access to services from social/community halls
16The Case of Kilifi Town Settlements
5. Access to Public Transport
The settlements, being near the Kilifi urban core, have generally good access to public transport. Spatial analysis shows that over
90% of all residents in the settlements can access public transport within 500 metres from their homes (Figure 39 and 40). Figure 39
show the specific areas in Shingilia, Kalolo and Viwandani requiring improved connectivity to transport (Figure 39).
Kisumu Ndogo
Ukombozi
Mtaani
Makao
Baya Magonza
Mabirikani
Kibaoni
Mibiyu Saba
Shingilia
Kalolo
Viwandani
0% 10% 20% 30% 40% 50% 60% 70% 80% 90% 100%
With Access Without Acccess
Figure 39 and 40: Access to public transport within 500 metres form households
An area of further investigation identified by the survey in respect to public transport is on the convenience of public transport, traffic
congestion, road sizes, biking areas, drainage, and quality of intersections.
17The Case of Kilifi Town Settlements
6. State of Public Spaces
Public spaces are a key component of the urban fabric. In Kilifi, field data shows that, informal settlements have greener spaces than
most informal settlements in bigger towns (Figure 41 and 42).
Figure 41 and 42: Green areas fronting a settlement cluster and boda boda waiting area under a tree
Spatial analysis shows that all informal settlements homes’ can access open spaces within 400 metres. Public spaces which are
accessible for all are however small in sizes, accounts for less than 5% of the total settlements areas (Figure 43 and 44). Largest
settlements with less than 2% of their land areas under public open spaces include Viwandai, Baya Magonza and Kibaoni.
0.45 5.00%
0.4 4.50%
0.35 4.00%
3.50%
0.3
3.00%
0.25
2.50%
0.2
2.00%
0.15
1.50%
0.1 1.00%
0.05 0.50%
0 0.00%
Baya Magonza
Mibiyu Saba
Kibaoni
Mabirikani
Viwandani
Kalolo
Makao
Kisumu Ndogo
Ukombozi
Shingilia
Mtaani
Land Area Proportion of Land under POS
Figure 43 and 44: Access to public spaces within 400 metres from homes
18The Case of Kilifi Town Settlements
7. Organizations Supporting in Service Provision
The survey identified at least 25 include provision of basic food and non- sports, girls and women empowerment
organizations with programs in Kilifi food items, support to vulnerable families, HIV/AIDS awareness, peace building, and
informal settlements. The major ones youth and adolescent girls support, family planning.
are in Figure 45. The sectors they cover
Figure 45: Major organizations operating the settlement
It was noted that there is more support Cooperation, UAE Red Crescent and (especially those with storage capacities
provided by organizations in social Water for Life Program. Water point facility of beyond 20 litres) being managed
transformation compared to support in donors includes the County Government, by non-profit organization (e.g. Imarika
provision of infrastructural services and and about 10 private institutions and Foundation, Plan International and
utilities Under the WASH category, 5 individuals. For handwashing support, Shujaaz), in collaboration with the County
facility managers were mapped, including, majority of the facilities are managed Government.
the County Government, Ajay Industrial by private individuals, with major ones
19The Case of Kilifi Town Settlements
Key observations
The following are key observation from the mapping, and their associated action areas:
1. The informal settlements of Kilifi town have a mixed housing character, and includes traditional mud houses with
thatched roofs, modern stone walled houses laid out as row housing, and clusters of joined rooms occupied by
multiple families.
2. While about 90% of the residents are able to access a water point within 100 metres from their households, the
settlements experience water supply challenges, with the water supplied by the water company, MAWASCO, being
insufficient to meet the settlements demands. The residents use borehole water to meet water demand, but this water
has to be pumped from the boreholes and transported to the households.
3. For handwashing facilities, the settlements have numerous facilities, most of which are privately owned by individuals
and business owners. The number of new facilities has reduced over time since March, 2020, and most facilities (about
90%) are manually fed with water, which is not a sustainable model for handwashing facilities.
4. The survey established that shared sanitation facilities are generally in fair to poor conditions, and there is need
to equip them with handwashing facilities – there is also need to ensure that the facilities have water and soap
throughout the day.
5. The state of solid waste in the settlements is poor, with open dumping being evident across the settlements. A solid
waste management system, coupled with awareness on solid waste management, are desired. During the rainy
seasons, solid waste block drainage channels, and openly dumped waste become a health hazard.
6. Majority of residents are able to access a health facility within 500 metres. Investigation into the quality of service
provided by the facilities is required to map any gaps in service provision.
7. For education, the survey established that some settlements have a challenge accessing pre-primary education
facilities. There is need to ensure settlements such as Ukombozi, Mabirikani, Kalolo and Kisumu Ndogo have sufficient
access pre-primary education facilities.
8. The settlements in the northern part of the town have poor access to community halls; social halls at Viwandani,
Makao, Kalolo and Mibiyu Saba are required to improve access to community halls. Existing halls are in good
conditions and generally well equipped with essential services.
9. While the residents of the settlements in Kilifi have better access to open spaces than most informal settlements
in large towns and cities, public open spaces in the settlements are few, accounting for less than 5% of the total
settlements areas. There is need to raise this proportion to at least 15%.
10. The survey further notes that there are numerous organization working in the settlement, but the organizations have
not given attention to all sectors of development. As such, the survey recommends stakeholder coordination, and
spatially targeted intervention.
20The Case of Kilifi Town Settlements
SUMMARIZING THE MAPPING
This survey has established that while informal settlements in Kilifi are not characterized by acutely congested housing units,
they lack proper access to essential services such as water and sanitation. This report identifies different areas for stakeholder’s
intervention, and is recommended for use in guiding interventions, including spatially targeted interventions.
21You can also read