Muffler Optimization for Increased Fuel Efficiency Iterations Using Taguchi Orthogonal Array for Controlling CO2
←
→
Page content transcription
If your browser does not render page correctly, please read the page content below
IJISET - International Journal of Innovative Science, Engineering & Technology, Vol. 2 Issue 3, March 2015.
                                                                 www.ijiset.com
                                                                                                                                 ISSN 2348 – 7968

           Muffler Optimization for Increased Fuel Efficiency
       Iterations Using Taguchi Orthogonal Array for Controlling CO2
                                                  Mylaudy Dr. S. Rajadurai1, Naveen. S2
                                 1
                                     Head of Research and Development, Sharda Motor Industries Limited,
                                                    Chennai, Tamil Nadu-603002, India
                                         2
                                             Senior Engineer, Sharda Motor Industries Limited – R&D,
                                                      Chennai, Tamil Nadu-603002, India

                            Abstract                                        compared to CI engine and CO 2 reduction will have an
                                                                            exponential variation.
In a pursuit towards improving the fuel efficiency and carbon di-           In any engine the exhaust back pressure has a direct impact
oxide (CO 2 ) control, the paper shall be confined to optimize              on %fuel consumption. They have an exponential relation
exhaust systems to have a reduced back pressure (BP) output                 wherein any increase in BP will reduce fuel efficiency
which has a direct influence on fuel efficiency. This objective is          exponentially. The paper shall explain an experimental
achieved by an experimental study and to reduce the huge
number of iterations; Design of Experiments (DoE) technique is
                                                                            methodology to optimize the exhaust muffler to increase
used which shall pave way for reduced number of experimental                the fuel efficiency of the vehicle. The iterations assure 11-
analysis on different setups of exhaust systems. Results are                12% increase in fuel efficiency. From the data measured
achieved using Flow Analysis-Flow Lab and Engine Lab with                   and tabulated, CO 2 released from exhaust system based on
constant inlet mass flow rate and inlet temperature (engine                 fuel used can be calculated because fuel consumption has a
conditions). This methodology shall give a direct behavior of               direct correlation with CO 2 released. This leads the project
different exhaust setups for the same engine conditions and the             aiming at two important results of increasing the fuel
exhaust system setup that achieves the most reduced BP output               efficiency of a vehicle through exhaust optimization to
shall be chosen as the optimized assembly.
                                                                            reduce back pressure and also in hand control CO 2
                                                                            emission through exhaust. CO 2 emission control to an
Keywords: Fuel efficient vehicle, muffler optimization,                     extent of 63% is estimated to be possible.
back pressure reduction, design of experiments (DoE),
CO 2 control

1. Introduction
The objective of this project is to investigate the various
factors that have a direct relation with back pressure
created in the exhaust system. Experiments are carried out
using different exhaust setup and DOE methodology is
implemented to reduce the number of experimentations
carried out. The parameters considered for optimization
are percentage openness in baffle, number of baffles in
muffler, inlet profile of the muffler, outlet profile of the
muffler, tail pipe, diameter of the pipe and number of
bends in exhaust pipe [2]. Experiment has been done with
seven factors at two levels. An orthogonal array of L16 is
created for the statistical design of experiments based on
Taguchi method.

The testing was conducted on a SI engine but the science                                   Fig. 1 BSFC as a function of back pressure
holds good for both CI and SI engines. Only the fuel
efficiency target achieved shall have a different number

                                                                                                                                             289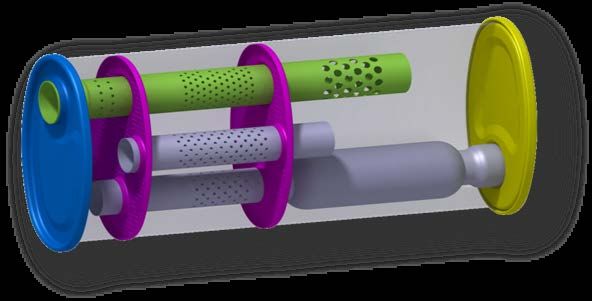
IJISET - International Journal of Innovative Science, Engineering & Technology, Vol. 2 Issue 3, March 2015.
www.ijiset.com
ISSN 2348 – 7968
To find the optimum solution to design an exhaust system
for increased fuel efficiency needs various experiments and
iterations. The time and resources for conducting
experiments incurs more cost. Design of analysis and
experiments is the tool to reduce the time and number of
experiments and to find the optimal solution.
2.2 Selection of Factors, Levels and Ranges
These factors include the design factory which can be
controlled during experimentation. Identification of these
factory leads to the selection of experimental design.
Often, the experience and the specialized knowledge of
engineers and scientists dominate the selection of factors.
The Various factors considered for the iterations are
chosen after close consideration and quantitative
comparison of its effect on the exhaust back pressure
value. To bring clarity, a comparison graph is plotted with
different diameter of pipes used inside the muffler and the
variations between mass flow rate and back pressure are
reflected as shown in the graph.
Fig. 2 Dependence criteria of exhaust system and fuel consumption
2. Steps in Experimentation
The experimenter must clearly define the purpose and
scope of the experiment.
The objective of the experiment may be, for example to
determine the optimum operating conditions for a process
to evaluate the relative effects on product performance of
different sources of variability or to determine whether a
new process is superior to the existing one. Fig. 3 Performance comparison between tubes with different
The experiment will be planned properly to collect data in perforations
order to apply the statistical methods to obtain valid and
objective conclusions. The following seven steps
procedure may be followed:
1) Problem statement
2) Selection of factors, levels and range
3) Selection of response variable
4) Choice of experimental design
5) Experiment Setup and Conditions
6) Analysis of data
7) Inference from analysis of variance
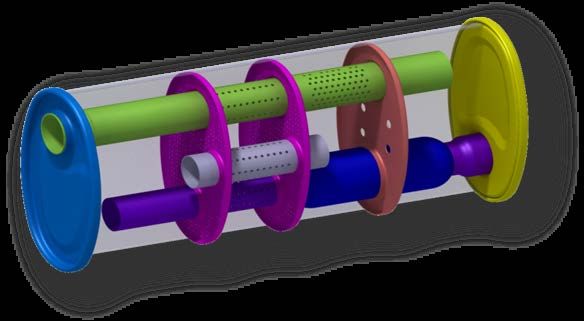
Fig. 4 Sample muffler assy-complex design with 3 baffle plates
2.1 Problem Statement
290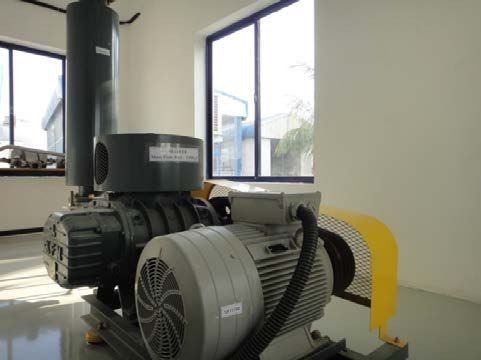
IJISET - International Journal of Innovative Science, Engineering & Technology, Vol. 2 Issue 3, March 2015.
www.ijiset.com
ISSN 2348 – 7968
for the exhaust system of a definite petrol engine and the
measured readings are correlated to find the optimum
result.
Fig. 5 Reduced number of baffle plated for Back Pressure reduction Fig. 6 Exhaust System Classification
2.3.1 Factors 2.5.1 Setting the Boundary Conditions
A total of seven factors were selected by taking opinion A blower is a machine for moving volumes of a gas
from several experts. with moderate increase of pressure.
Percentage of openness in baffle of muffler.
Number of baffles in muffler
Inlet profile of muffler
Outlet profile of muffler
Diameter of pipe
Number of restrictions
Tail pipe.
2.3.2 Response
Backpressure reading.
Corresponding CO 2 level in exhaust gas
2.4. Choice of Experimental Design
Fig. 7 Blower – Experimental apparatus for setting engine conditions
Experimentation design is a body of knowledge and
techniques that assist the experimenter, to conduct Hot end system of the exhaust is an assembly mounted
iterations economically, analyze data and make with converter, shell and mounting mat. Air from engine
connections between the conclusions from the analysis and out, passes through this assemble and this is where
the original objectives of the investigation. [4] chemical reactions occur for emission control and then the
exhaust gasses pass through to the muffler assembly for
The traditional approach in the industrial and the scientific noise control. During the pass through time, exhaust gases
investigation is to employ trial and error methods to verify attain a peak temperature at the mid bed of the hot end
and validate the theories that may be advanced to explain assembly through the initial part. After that the system acts
some observed phenomenon. This may lead to prolonged as a heat sink, gradually dissipates thermal energy. Care
experimentation and without good results. Some of the was taken to study the thermal behaviour of the real system
approaches also include one factor at time and the exhaust gas temperature and mass flow rate at the
experimentation, several factors one at a time and several cold end inlet was measured. Gasses with the equivalent
factors all at the same time. thermal condition and mass flow rate are generated by
using a blower. The generated air acts as an input mass for
the cold end system.
2.5 Experimentation Setup and Conditions
The exhaust system is divided in to two parts, hot end and
cold end. The region between Exhaust manifold and a
catalytic converter is hot end, catalytic converter to muffler
tail is cold end. Here the experiment has been carried out
291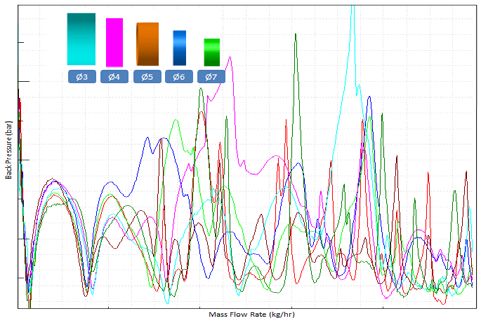
IJISET - International Journal of Innovative Science, Engineering & Technology, Vol. 2 Issue 3, March 2015.
www.ijiset.com
ISSN 2348 – 7968
Table 1: Factors under consideration for orthogonal array
Fig. 8 Blower Tank – Experimental apparatus for setting engine Table 2: Orthogonal Array
conditions
In the experimental setup, the pressure sensor measures the
backpressure at the exit of the exhaust system. From the
CO 2 emission report, the CO 2 emission level will be
extrapolated against the measured backpressure.
BSFC=r/p g/kWh
P can be obtained from engine specification
r =BSFC*p kg/h
We know,
1ltr petrol = 750 grams; this shall help to convert r from
kg/hr to l/h and for every 1l of petrol, CO 2 emission =
2392 grams (at fixed rpm and mass flow rate for 1 hour)
CO 2 output for the amount of fuel consumed =
2392*r kg/h
CO 2 emitted for consumed amt of petrol per
minute = 2392*r*60 kg/m
2.6 Analysis of Data
2.6.1 Choice of Orthogonal Array
Degrees of freedom required,
Main factors = 7(each factor has one degree of
freedom)
Total degrees of freedom = 7
To accommodate 7df, we will use L 8 (27) or L 12 (211)
or L 16 (215) OA. With the above mentioned array as reference,
Here L16(215) OA is chosen for better results. experimentation was started and all combinations were
tried and the corresponding BP readings were noted down.
For every BP value measures, the corresponding CO 2
emission level was calculated by the procedure explained
above. The CO 2 readings were tabulated. [3][4]
292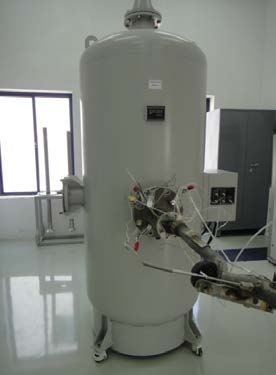
IJISET - International Journal of Innovative Science, Engineering & Technology, Vol. 2 Issue 3, March 2015.
                                                               www.ijiset.com
                                                                                                                                  ISSN 2348 – 7968
                     Table 3: Ranking of factors                                      Table 4: Quantitative analysis to find significant factors

Average response Ȳ= Grand total of all observations /
Total number of observations

Ȳ= 539.1875

                                                                          2.7 Inference from Analysis of Variance

                                                                                Table 5: Measured back pressure and calculated CO 2 readings

                  Fig. 9 Mititab interpolation

2.6.2 Predicting Optimum Conditions

Based on the objective of the experiment, in each level
minimum value is taken for optimum condition.

B 2 E2 G1 F2 A2 D1 C2
µ prediction= Ȳ+(B2-Ȳ)+(F2-Ȳ)+(G1-Y)+(E2-Ȳ)+(A2-
Ȳ)+(D1-Ȳ)+(C2-Ȳ)
                                                                          Number of baffles (factor B) is found to be significant
                                                                          after performing ANOVA. Therefore it can be reported
µ prediction                : 978.05                                      that, number of baffles included plays the most vital role
Correction Factor           : 4651570.653                                 in back pressure increase.

                                                                                                                                                   293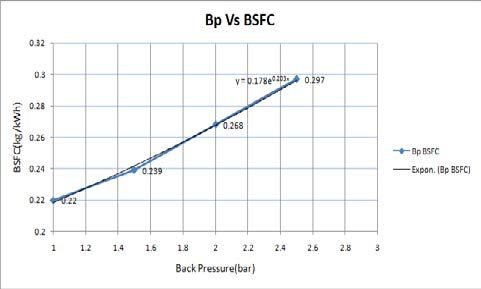
IJISET - International Journal of Innovative Science, Engineering & Technology, Vol. 2 Issue 3, March 2015.
www.ijiset.com
ISSN 2348 – 7968
Table 6: Back pressure and fuel consumption correlation considering real time situations like driving capability of
the driver, climate and road conditions, aerodynamics of
the vehicle they have an exponential relation that is, any
increase in back pressure has an exponential and adverse
effect on the operation and reliability of the engine. It
reduces the fuel economy of the vehicle in particular.
Figure 11: Back pressure Vs CO 2 emission
Figure 11 shows the correlation and is derived from the
direct relation between fuel consumption and the amount
of CO 2 released to the atmosphere. The estimation is for a
definite engine at a defined condition and hence will vary
between different driving conditions.
2.7.1 Correlation of results
3. Conclusion
This completes examining the effects of various mounting
design of exhaust system and the effects of various factors The iterations conclude that, number of baffles in the
of internals in the muffler. The experimental inlet exhaust muffler contributes more than 52% of back
conditions and boundary conditions were set appropriately pressure increase in the exhaust system. The increase in
that it represented the conditions encountered by a gasoline back pressure has an exponential relation with fuel
vehicle exhaust system. efficiency and directly reduces fuel efficiency of the
vehicle.
With optimized design CO 2 control to an extent of 63% is
estimated to be possible and also 11-12% increase in fuel
efficiency can also be achieved with exhaust system
optimization.
4. Future Works
The project shall be refined and a full exhaust system shall
be optimized to give more efficient exhaust system. For
this the factors under consideration for experimentation
shall include;
Figure 10: Back pressure Vs brake specific fuel consumption
4.1 Emission Control Components
From figure 10 it is evident that any increase in back
pressure has a significant impact on the fuel consumption. Substrate - Flow through Catalytic Converters
The measured readings in table 8, shows a clear Wall Flow Traps included in hot end (Particulate
comparison between Back pressure and BSFC. The large- Filters, HC traps, NO x traps etc.)
scale analysis predicts a linearity between the two but by Fine Particulate traps for gasoline lean burn will be
micro managing the relation between the two and required when particulate matter increases due to
294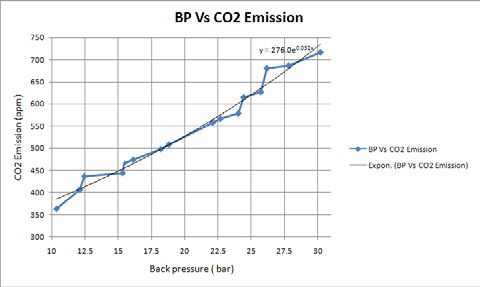
IJISET - International Journal of Innovative Science, Engineering & Technology, Vol. 2 Issue 3, March 2015.
www.ijiset.com
ISSN 2348 – 7968
recirculation of exhaust air. Direct Injection. Lean
burn trap.
Packaging or Routing
4.2 NVH Components 1
Mylaudy Dr.S. Rajadurai, born in Mylaudy, Kanyakumari
District, Tamil Nadu, India, received his Ph.D. in Chemistry
Shell routing and shape
from IIT Chennai in 1979. He has devoted nearly 36 years to
Internals of muffler (baffle plate, perforated pipes) scientific innovation, pioneering theory and application through
Integrated Muffler (in-built Converters) the 20th century, and expanding strides of advancement into the
21st century. By authoring hundreds of published papers and
5. References reports and creating several patents, his research on solid oxide
solutions, free radicals, catalyst structure sensitivity and catalytic
converter and exhaust system design has revolutionized the field
[1] MurariMohon Roy, Mohammad UzzalHossainJoardder and
of chemistry and automobile industry.
Md. ShazibUddin, (2010), “Effect of Engine Backpressure
As a corporate executive in the United States and India for
on the Performance and Emissions of a CI Engine” The 7th
over three decades, Dr. Rajadurai managed strategy on power
Jordanian International Mechanical Engineering Conference
train development and emission control for low, ultra low, super
(JIMEC’7) 27 - 29 September 2010, Amman – Jordan.
ultra low and partial zero-emission systems. From 1990-1996,
[2] HONG Han-chi, HUANG Hong-wu, BAI Yi-jie, (2012)
he was the Director of Research at Cummins Engine Company.
“Optimization of Intake and Exhaust System for FSAE Car
He was the Director of Advanced Development at Tenneco
Based on Orthogonal Array Testing”, International Journal
Automotive between 1996 and 2002 and subsequently Emission
of Engineering and Technology Volume 2 No. 3, March,
Strategist and Director of Emissions at ArvinMeritor until 2004.
2012.
From 2004-2009, he was Vice-President of ACS Industries and
[3] Rajadurai.S, Anulatha.R.K (2012) “Carbon Dioxide Fixation
since 2009 as Head of R&D Sharda Motor Industries Ltd.
- The Must and the Path”, International Journal of Science
Dr. Rajadurai has held leadership positions on the Board of
and Advanced Technology (ISSN 2221-8386) Volume 2 No
Directors for the U.S. Fuel Cell Council, Manufacturers of
5 May 2012.
Emission Control Association (MECA), Chairman of MECA
[4] K.Krishnaiah, P. Shahabudeen, (2012) “Applied Design of
Committee on Advanced Technologies and Alternate Fuels and
Experiments and Taguchi methods” published by PHI
Walker Exhaust India. He is an active participant in Clean and
Learning Pvt. Ltd, ISBN-978-81-203-4527-0.
Green Earth Day demonstrations since 1997 and US Clean
[5] Raghu. N. Kacker, eric. S. Lagergren, James. J. Filliben,
Diesel School Bus Summit (2003). He was a panelist of the
(1991) National Institue of Standards and Technology,
Scientists and Technologists of Indian Origin, New Delhi 2004.
Gaithersburg, MD 20899, “Taguchi’s Orthogonal Arrays are
He is a Fellow of the Society of Automotive Engineers. He was
Classical Design of Experiments”
the UNESCO representative of India on low-cost analytical
[6] G. Taguchi, Orthogonal Arrays and Linear Graphs, American
studies (1983-85). He is a Life Member of the North American
Supplier Institute, Inc, Dearborn, MI (1986)
Catalysis Society, North American Photo Chemical Society,
[7] Anderson, S. I. Parry, JM. Salle and C. Fischer (2010),
Catalysis Society of India, Instrumental Society of India,
Automobile Fuel Economy Standards; Impacts, Efficiency
Bangladesh Chemical Society and Indian Chemical Society.
and Alternatives, Resources for Future, Washington DC,
USA
[8] EPA (2010), “ Lighgt-Duty Automotive Technology, Carbon
Dioxide Emissions and Fuel Economy Trends: 1975 Through
2010”
[9] Peter Hield, Maritime Platforms Division-Defence Science
and Technology Organization-DSTO-TR-2531, “ The Effect
of Back Pressure on the Operation of a Diesel Engine” 2
Naveen.S, born in Coimbatore District, Tamil Nadu, India,
[10] Atul A. Patil, L.G Navale, V.S. Patil, Mechanical
completed his Mechanical Engineering in Amrita
Department-Nortg Maharashtra University, India-ISSN
(online): 2279-0039, ISSN (Print): 2279-0020, “ Design, University in 2010. He is working as a Senior Engineer in
Analysis of Flow Characteristics of Exhaust System and Sharda Motor Industries limited, R&D, Chennai. He is a research
Effect of Back Pressure on Engine Performance” and target oriented engineer with skill and global exposure to
[11] Sudharshanan Dilip Pangavhane, Amol Bhimarao Ubale, automobile exhaust product development. He has rich
Vikram A Tandon, Dilip R Pangavhane, Symbiosis Internal understanding and diversified exposure in the field of product
University, Pune, India, “Experimental and CFD Analysis of lifecycle management. Having completed his Masters in
a Perforated Inner Pipe Muffler for the Prediction of Automotive Engineering from Staffordshire University, UK
Backpressure” (2013), he has strong knowledge in DMAIC methodology to
handle projects from concept definition, to manufacturing. He has
an eye for intricate details to optimize vehicle emissions, CO 2
control and fuel efficient vehicle design.
295You can also read