Improved agreement and diagnostic accuracy of a cuffless 24 h blood pressure measurement device in clinical practice - Nature
←
→
Page content transcription
If your browser does not render page correctly, please read the page content below
www.nature.com/scientificreports
OPEN Improved agreement
and diagnostic accuracy
of a cuffless 24‑h blood pressure
measurement device in clinical
practice
Thenral Socrates1,4*, Philipp Krisai2,3,4, Annina S. Vischer1, Andrea Meienberg1,
Michael Mayr1 & Thilo Burkard1,2
A cuffless blood pressure (BP) device (TestBP) using pulse transit time is in clinical use, but leads
to higher BP values compared to a cuff-based 24 h-BP reference device (RefBP). We evaluated the
impact of a recent software update on BP results and TestBP’s ability to differentiate between
normo- and hypertension. 71 individuals had TestBP (Somnotouch-NIBP) and RefBP measurements
simultaneously performed on either arm. TestBP results with software version V1.5 were compared
to V1.4 and RefBP. Mean 24 h (± SD) BP for the RefBP, TestBP-V1.4 and TestBP-V1.5 were systolic
134.0 (± 17.3), 140.8 (± 20) and 139.1 (± 20) mmHg, and diastolic 79.3 (± 11.7), 85.8 (± 14.1) and 83.5
(± 13.0) mmHg, respectively (p-values < 0.001). TestBP-V1.5 area under the curve (95% confidence
interval) versus RefBP for hypertension detection was 0.92 (0.86; 0.99), 0.94 (0.88; 0.99) and 0.77
(0.66; 0.88) for systolic and 0.92 (0.86; 0.99), 0.92 (0.85; 0.99) and 0.84 (0.74; 0.94) for diastolic 24 h,
awake and asleep BP respectively. TestBP-V1.5 detected elevated systolic/diastolic mean 24 h-BP with
a 95%/90% sensitivity and 65%/70% specificity. Highest Youden’s Index was systolic 133 (sensitivity
95%/specificity 80%) and diastolic 87 mmHg (sensitivity 81%/specificity 98%). The update improved
the agreement to RefBP. TestBP was excellent for detecting 24 h and awake hypertensive BP values
but not for asleep BP values.
Hypertension is a global healthcare burden and the most important modifiable risk factor for cardiovascular
disease and stroke1. Detecting and managing arterial hypertension is a daily task in medicine. However, much
controversy exists on how blood pressure (BP) should be measured and how hypertension should be diagnosed
and monitored. Different guidelines recommend non-invasive oscillometric, cuff-based, 24 h ambulatory BP
pressure monitoring for the accurate diagnosis of arterial hypertension using validated d evices2,3. In general,
patients are not keen on this BP measurement (BPM) method, finding the repeated inflations of the cuff, espe-
cially at night, uncomfortable and disruptive. The stimulation caused by the inflations, during sleep, could also
cause the readings to be inaccurate due to sympathetic arousal, pressure on anatomical structures, and measure-
ment artefacts caused by m ovement4,5.
Since 2015, a novel cuffless BP device using pulse transit time (PTT) for the beat-to-beat calculation of BP
values has been in clinical use. The device was validated according to the ESH International Protocol Revision
2010 for the Validation of Blood Pressure Measuring Devices in Adults (ESH IP 2010)6. After initial calibration
with a standard cuff-based measurement, this standard validation technique is carried out over an approximate
25-min period in a non-stimulating environment. This setting does not represent the usual circumstances with
which the device is used, namely over a 24 h period with normal activities.
In our previous study, we compared the cuffless device (TestBP) to a standard cuff-based device (RefBP). The
novelty of this study was that the measurements took place over a 24 h period with both devices simultaneously
worn by the participant, capturing BPM during daily activities and sleep. A significant difference between the
1
Medical Outpatient and Hypertension Clinic, ESH Hypertension Centre of Excellence, University Hospital
Basel, Petersgraben 4, 4031 Basel, Switzerland. 2Department of Cardiology, University Hospital Basel, Basel,
Switzerland. 3Cardiovascular Research Institute Basel, University Hospital Basel, Basel, Switzerland. 4These
authors contributed equally: Thenral Socrates and Philipp Krisai. *email: thenral.socrates@usb.ch
Scientific Reports | (2021) 11:1143 | https://doi.org/10.1038/s41598-020-80905-x 1
Vol.:(0123456789)www.nature.com/scientificreports/
two devices was detected. In particular, the cuffless device revealed systematically higher systolic and diastolic
values, especially during the asleep phase. This precluded that the values of the devices were not directly inter-
changeable in a clinical context and needs to be taken into account when implementing the cuffless device in a
clinical setting7.
In 2018, the TestBP device manufacturer (Somnomedics GmbH, Randersacker Germany) updated the soft-
ware algorithm for better BP calculation. With the present analysis, we aimed to investigate the impact of this
software update on device accuracy compared to the RefBP. Furthermore, we evaluated diagnostic accuracy for
the detection of hypertensive BP values to give clinical guidance and possibly derive device specific cut-off values
against the gold standard (RefBP).
Experimental section
The study protocol complies with the Declaration of Helsinki, was approved by the local ethics committee,
Ethikkommission Nordwest- und Zentralschweiz (Ethics Commission Northwest and Central Switzerland),
(EKNZ 2017-00323), registered (NCT 03054688) and externally monitored. Informed consent was obtained
from all participants.
Device details. Somnotouch-NIBP (Somnomedics GmbH, Randersacker, Germany) is a cuffless, non-inva-
sive system which estimates BP based on the PTT technique (TestBP). Allowing for continuous beat-to-beat BP
monitoring. Finger photoplethysmography, three ECG leads and a watch-like-device with integrated actigraph
are the hardware of the device. Transit time of a pulse wave from the corresponding ECG R-wave to the finger
photoplethysmography signal is m easured6. Systolic and diastolic BP levels are calculated using non-linear mod-
elling incorporating changes of the PTT and its relation to BP. The measurements are derived after an initial
single-cuff based calibration measurement on the contralateral upper a rm8. Increasing pulse wave propagation
results in shorter PTT and is associated with higher BP values. Logically, decreasing pulse wave propagation and
longer PTT is linked to lower BP values. Arterial wall stiffness and tension influence pulse wave propagation
and PTT, both of which effect BP9,10. In this study the reference device (RefBP) was the cuff-based Spacelabs
90217A (Spacelabs Healthcare Inc., USA) 24 h BP m onitor11. In July 2018, Somnomedics completed an update
of the software. This update of the Domino light software version 1.4 led to the current version 1.5 (02/07/2018).
Study center. In April 2015, the cuffless device was introduced at the Medical Outpatient and Hypertension
Clinic at the University Hospital Basel. The study team was trained to use the TestBP correctly and at the initia-
tion of the study, the centre had two years of experience and had performed > 500 measurements. Experienced
cardiologists (TB, AV) read all TestBP and RefBP measurements.
Enrolment. Enrolment took place at the Medical Outpatient and Hypertension Clinic at the University Hos-
pital Basel between May and December 2017. The target sample consisted of consecutively recruited participants
with an indication for a 24 h BPM as well as healthy volunteers. Distribution over pre-defined BP ranges and
pre-specified recruitment numbers were defined prior to the initiation of the study as reported previously7.
This included at least 15 participants in low (< 135 mmHg), intermediate (≥ 135 and < 150 mmHg) and high
(≥ 150 mmHg) mean-awake systolic BP categories measured by the RefBP. BP categorisation for 24 h mean BP
currently does not exist therefore the definition of low, intermediate and high categories was espoused from the
National Institute of Health and Care Excellence clinical guidelines12,13. In addition to the BP category require-
ments, at least 15 male and 15 female subjects needed to be included. The ability to give informed consent and
age ≥ 25 years as proposed by the ESH-IP 2010 were main inclusion criteria12. Exclusion criteria consisted of
age < 25 years, a systolic BP difference > 10 mmHg between both upper extremities, atrial fibrillation at the time
of enrolment and other medical reasons prohibiting BPM on the upper extremities. For evaluation of inter-arm
differences, the following procedure took place: After 5 min of rest, the inter-arm BP difference was assessed
sequentially with a single measurement on the right and left upper arm, in a sitting, upright position with legs
uncrossed and back supported using the validated, cuff based, oscillometric Omron HBP-1300 d evice14,15.
Active recruitment took place until all recruitment categorizes were fulfilled.
Measurement procedure. Both devices were mounted on the participant in a sitting, upright position
with legs uncrossed and back supported. An appropriately sized cuff was placed on the right arm and connected
to the RefBP. The TestBP was placed on the left forearm and connected to the photoplethysmograph on the
left index finger and the ECG electrodes according to manufacturer’s instructions. The first manually triggered
RefBP measurement was taken after 5 min of rest. This measurement was used as a calibration measurement for
the TestBP. The RefBP was programmed for measurements every 20 min from 08:00 to 22:00 and every 30 min
during the remaining period. Simultaneously, the TestBP recorded beat-to-beat PTT according to the manufac-
turer’s instructions and standard programming. Participants were given questionnaires to individually record
their activities and sleep schedules.
After completion of the 24 h measurement period, the RefBP measurements were analysed using its own
standard software (Spacelabs Healthcare Inc, USA). A minimum of 27 BP values were required to deem the RefBP
measurement valid. Otherwise, the data set was excluded16. The information about time in bed that we obtained
from the patient protocol defined the asleep phase. Mean systolic and diastolic 24 h, awake and asleep values were
calculated. TestBP measurements were evaluated twice using the incorporated standard software (Domino Light;
Somnomedics GmbH). The first analysis (TestBP-V1.4) used the former software version (Domino Light Version
V1.4; Somnomedics GmbH) and the second analysis (TestBP-V1.5) used the updated software version (Domino
Light V1.5; Somnomedics GmbH). Automatic detection of artefacts during asleep time (feature included in the
Scientific Reports | (2021) 11:1143 | https://doi.org/10.1038/s41598-020-80905-x 2
Vol:.(1234567890)www.nature.com/scientificreports/
Characteristic Overall (n = 71)
Sex (male), n 36 (50.7)
Age, years 49.3 (15.1, (25–82))
BMI, kg/m2 26.7 (5.4)
Mean valid 24 h cuff-based BP readings, n 59.6 (5.2, (37–66))
Antihypertensive treatment, n 28 (39.4)
Table 1. Baseline characteristics. Data are mean (± standard deviation, (range)) or counts (percentage), as
appropriate. BP blood pressure, BMI Body Mass Index.
Somnotouch Domino light software package) were implemented. Only data sets, with < 50% artefact time, were
deemed as valid and included in the final analysis. TB and AV chose the ECG lead with the best signal quality.
Standardised questionnaires were used to evaluate personal and medical factors including intake of antihy-
pertensive medication and biometrics.
Statistical analysis. Distribution of continuous variables was determined using skewness, kurtosis and
visual inspection of the histogram. Continuous data were presented as means (± standard deviations) and com-
pared using paired t-tests. Categorical variables were described as counts (percentages) and compared using chi
square tests.
Mean absolute BP differences between the RefBP vs. TestBP-V1.4 and RefBP vs. TestBP-V1.5 were obtained
by reversing all negative values to positive values before calculation. Intraclass correlation coefficients between
RefBP and both software versions (TestBP-V1.4 and TestBP-V1.5) were calculated to evaluate the general reli-
ability index of a test–retest of the two devices. We followed the guidelines described by Koo and Li, with values
less than 0.5, between 0.5 and 0.75, between 0.75 and 0.9, and greater than 0.90 indicating poor, moderate, good,
and excellent reliability, r espectively17.
Accuracy tables and Bland–Altman plots were adapted based on the ESH-2010 p rotocol18.
Receiver operating characteristic (ROC) curves were constructed to assess the sensitivity and specificity of
TestBP-V1.5 and to detect hypertension in comparison to RefBP.
The diagnostic performance of the TestBP-V1.5 was further analysed by calculating Youden’s index and defin-
ing highest value as optimal systolic and diastolic cut-off value for mean 24 h, awake, asleep BP for the TestBP
compared to RefBP. Youden’s index (J) was calculated as (J) = sensitivity + specificity − 1.
Cut-off values for RefBP were based on the 2018 ESH/ESC Practice Guidelines for the Management of Arterial
Hypertension using definitions of hypertension by office and out-of-office BP l evels3.
Positive predictive value (PPV) and negative predictive value (NPV) of the TestBP measurements were cal-
culated with sensitivity, specificity and the corresponding prevalence of elevated BP according to the RefBP
measurements in our cohort of participants.
This study was designed and performed without patient involvement. Participants and or patients were not
invited to remark on the study design and were not consulted to change patient relevant outcomes or interpret
the results. Patients were not asked to contribute to the writing or editing of this manuscript for readability or
accuracy.
Statistical analyses were performed using SAS version 9.4 (SAS Institute Inc, Cary, NC) and SPSS Version 22
(IBM), a p-value of < 0.05 was pre-specified to indicate statistical significance.
Results
Baseline characteristics. Consecutive enrolment of 83 individuals took place from May to December
2017. Twelve participants were excluded due to insufficient recording times, poor recording quality, technical
problems, and atrial fibrillation7. Finally, a total of 71 participants’ data were analysed. Table 1 shows baseline
characteristics. Mean systolic and diastolic BP (SD) of the calibration measurements were 139.5 (21.9) and 85.8
(15.1) mmHg, respectively.
Comparison of the RefBP versus TestBP‑V1.4 and TestBP‑V1.5. Mean systolic and diastolic 24 h,
awake and asleep values of RefBP, TestBP-V1.4 and TestBP-V1.5 are presented in Table 2 showing statistically
significant differences in all comparisons—with TestBP-V1.5 being closer to RefBP than TestBP-V1.4 especially
in asleep BP values.
Bland–Altman plots for comparison of the RefBP, TestBP‑V1.4 and TestBP‑V1.5. Bland–Alt-
man plots comparing mean systolic, diastolic and asleep BP values of TestBP-V 1.4/V1.5 and RefBP are shown
(Fig. 1), illustrating that the best agreements of the TestBP-V1.4 and V1.5 to RefBP were seen during the awake
measurements. Of note, better agreements during asleep were measured with TestBP-V1.5. Overall BP values
were systematically higher with both Test BP versions.
Intraclass correlation coefficients of RefBP and TestBP‑V1.4 and TestBP‑V1.5. The intraclass
correlation coefficients (ICC) for mean systolic and diastolic 24 h, awake and asleep BP are shown in Table 3.
The ICC show a good to excellent range of conformity with the exception of systolic and diastolic asleep values
Scientific Reports | (2021) 11:1143 | https://doi.org/10.1038/s41598-020-80905-x 3
Vol.:(0123456789)www.nature.com/scientificreports/
p-values
RefBP TestBP-V1.4 TestBP-V1.5 RefBP vs. TestBP-V1.4 RefBP vs. TestB-V1.5 TestBP-V1.4 vs TestBP-V1.5
Systolic
24 h 134.0 (17.3) 140.8 (20.0) 139.1 (20.1) < 0.0001 0.0002 < 0.0001
Awake 138.1 (18.0) 142.0 (20.2) 142.3 (20.2) 0.002 0.001 0.02
Asleep 122.1 (18.4) 138.7 (20.1) 134.1 (20.5) < 0.0001 < 0.0001 < 0.0001
Diastolic
24 h 79.3 (11.7) 85.8 (14.1) 83.5 (13.0) < 0.0001 < 0.0001 < 0.0001
Awake 82.8 (12.4) 86.7 (13.9) 86.2 (14.2) < 0.0001 0.0002 0.003
Asleep 69.5 (11.2) 84.5 (14.6) 79.1 (14.6) < 0.0001 < 0.0001 < 0.0001
Table 2. Comparison of systolic and diastolic blood pressure measurements measured by RefBP, TestBP-V1.4
and TestBP-V1.5. Data are mean (± standard deviation), p-values are based on paired T-tests. BP blood
pressure. BP expressed as mmHg.
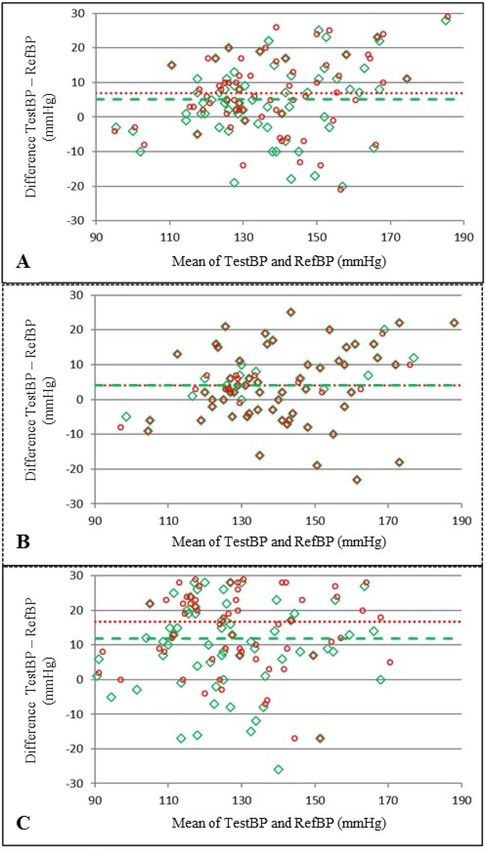
Figure 1. Bland Altman plots comparing systolic mean (A) 24 h, (B) awake and (C) asleep. BP values of
TestBP-V1.4 /V1.5 and Ref BP and RefBP. Horizontal lines indicate mean differences Legend: Version 1.4—open
red circle, Version 1.5—open green diamond, Version 1.4—red dotted line, and Version 1.5—green dashed line.
Scientific Reports | (2021) 11:1143 | https://doi.org/10.1038/s41598-020-80905-x 4
Vol:.(1234567890)www.nature.com/scientificreports/
n = 71 TestBP-V1.4 TestBP-V1.5
24 h systolic 0.88 0.89
Awake systolic 0.91 0.91
Asleep systolic 0.70 0.75
24 h diastolic 0.85 0.89
Awake diastolic 0.90 0.90
Asleep diastolic 0.63 0.72
Table 3. ICC between RefBP and TestBP-V1.4 and TestBP-V1.5. Data are Intraclass Correlation Coefficiants
(ICC). Values less than 0.5, between 0.5 and 0.75, between 0.75 and 0.9, and greater than 0.90 indicating poor,
moderate, good, and excellent reliability, respectively17.
n = 71 TestBP-V1.4 TestBP-V1.5
24 h systolic 6.5 [12.7] 6.2 [12.2]
Awake systolic 5.7 [11.2] 5.7 [11.2]
Asleep systolic 11.4 [22.3] 10.1 [19.8]
24 h diastolic 5.1 [10.0] 4.4 [8.6]
Awake diastolic 4.2 [8.2] 4.2 [8.2]
Asleep diastolic 9.1 [17.8] 7.3 [14.3]
Table 4. Standard error of the measurement between the TestBP-V1.4 and TestBP-V1.5 with the RefBP. Data
are standard error of the measurements [95% confidence interval].
(moderate reliability)17. With TestBP-V1.5, ICC were especially higher for systolic and diastolic asleep values but
did not improve after the update for systolic and diastolic awake values.
Standard errors of the measurements between RefBP and TestBP‑V1.4 and TestBP‑V1.5. The
greatest difference between RefBP and TestBP-V1.4 and TestBP-V1.5 was found in asleep systolic BP measure-
ments. Standard error of measurements for TestBP-V1.4 for mean systolic and diastolic 24 h, awake and asleep
BP values was 6.5, 5.7, and 11.4 mmHg and 5.1, 4.2 and 9.1 mmHg respectively. Standard error of measurements
for TestBP-V1.5 for systolic and diastolic 24 h mean, awake and asleep BP values was 6.2, 5.7, and 10.1 mmHg
and 4.4, 4.6 and 7.3 mmHg, respectively (Table 4).
Agreement of measurements between the RefBP vs. TestBP‑V1.5. Overall, when comparing
mean 24 h systolic BPM of RefBP and TestBP-V1.5 agreements ≤ 2, ≤ 5, ≤ 10, and ≤ 15 mmHg were 16.9%, 38%,
62%, 77.5% respectively. In the awake intermediate BP group (135–150 mmHg), the best agreements were seen.
The asleep BP groups had the poorest agreements (Table 5).
Overall, in the diastolic measurements, we saw the following agreements for ≤ 2, ≤ 5, ≤ 10, and ≤ 15 mmHg,
21.1%, 50.7%, 74.7% and 95.8% respectively. Best agreements were seen in the awake low and intermediate BP
groups and the poorest agreements in the asleep BP values (Table 5).
Diagnostic accuracy of TestBP‑V1.5 for the detection of hypertension compared to gold stand‑
ard diagnosis by RefBP. The area under the curve (AUC) (95% confidence interval) for the TestBP-V1.5
in detecting hypertension in comparison to the RefBP was 0.92 (0.86; 0.99), 0.94 (0.88; 0.99) and 0.77 (0.66;
0.88) for systolic 24 h, awake and asleep BP values and 0.92 (0.86; 0.99), 0.92 (0.85; 0.99) and 0.84 (0.74; 0.94) for
diastolic 24 h, awake and asleep BP values, respectively (Fig. 2).
Cut‑off values for the clinical interpretation of the TestBP‑V1.5. For the detection of hypertension,
TestBP-V1.5 characteristics for standard mean systolic and diastolic 24 h cut-off values and for highest Youden’s
indices are shown in Table 6. TestBP-V1.5 had 95% sensitivity, 65% specificity, a PPV of 74% and a NPV of 92%
when applying a standard systolic diagnostic cut-off value of 130 mmHg, and a 90% sensitivity, 70% specificity, a
70% PPV and a 90% NPV when applying standard diastolic cut-off values of 80 mmHg. Highest Youden’s Index
for mean systolic and diastolic 24 h BP was at systolic 133 mmHg (95% sensitivity, 80% specificity, 83% PPV, and
93% NPV) and diastolic 87 mmHg (70% sensitivity, 93% specificity, 87% PPV, and 81% NPV) respectively. Addi-
tional cut-off values (representing ≥ 95% sensitivity or ≥ 95% specifity) corresponding to TestBP-V1.5 awake and
asleep systolic and diastolic values are show in Supplementary Table S1.
Discussion
Over a century, non-invasive cuff-based BP measurement, using the initial approach of Scipione Riva Rocci and
Nicolai Sergeivich Korotkoff remained more or less unchanged until the advances through the development of
ecades19. Recently, devices using different techniques such as PTT or pulse wave
oscillometric devices in the last d
Scientific Reports | (2021) 11:1143 | https://doi.org/10.1038/s41598-020-80905-x 5
Vol.:(0123456789)www.nature.com/scientificreports/
A. systolic values ≥ 135; < 150 mmHg
n (%) < 135 mmHg low (n = 36) intermediate (n = 15) ≥ 150 mmHg high (n = 20) Overall (n = 71)
24 h
Mean difference, mmHg 6.0 (8.1) 2.3 (11.5) 5.7 (14.6) 5.1 (10.9)
Mean absolute difference, mmHg 9.6 (7.2)
≤2 8 (22.2%) 3 (20.0%) 1 (5.0%) 12 (16.9%)
≤5 19 (52.8%) 5 (33.3%) 3 (15.0%) 27 (38.0%)
≤ 10 26 (72.2%) 10 (66.7%) 8 (40.0%) 44 (62.0%)
≤ 15 31 (86.1%) 12 (80.0%) 12 (60.0%) 55 (77.5%)
Awake
Mean difference, mmHg 5.1 (8.4) 0.7 (8.7) 4.9 (13.9) 4.1 (10.3)
Mean absolute difference, mmHg 8.8 (6.9)
≤2 9 (25.0%) 2 (13.3%) 2 (10.0%) 13 (18.3%)
≤5 18 (50.0%) 6 (40.0%) 3 (15.0%) 27 (38.0%)
≤ 10 27 (75.0%) 13 (86.7%) 8 (40.0%) 48 (67.6%)
≤ 15 30 (83.3%) 13 (86.7%) 12 (60.0%) 55 (77.5%)
Asleep
Mean difference, mmHg 12.1 (10.7) 10.8 (18.0) 12.5 (19.1) 11.9 (14.9)
Mean absolute difference, mmHg 15.8 (10.6)
≤2 4 (11.1%) 1 (6.7%) 1 (5.0%) 6 (8.5%)
≤5 8 (22.2%) 1 (6.7%) 1 (5.0%) 10 (14.1%)
≤ 10 14 (38.9%) 5 (33.3%) 7 (35.0%) 26 (36.6%)
≤ 15 22 (61.1%) 7 (46.7%) 10 (50.0%) 39 (54.9%)
B. diastolic values ≥ 85; < 95 mmHg intermediate
n (%) < 85 mmHg low (n = 44) (n = 16) ≥ 95 mmHg high (n = 11) Overall (n = 71)
24 h
Mean difference, mmHg 4.2 (6.5) 3.1 (8.2) 5.6 (9.9) 4.2 (7.4)
Mean absolute difference, mmHg 6.8 (5.1)
≤2 9 (20.5%) 5 (31.3%) 1 (9.1%) 15 (21.1%)
≤5 25 (56.8%) 6 (37.5%) 5 (45.5%) 36 (50.7%)
≤ 10 35 (79.5%) 11 (68.8%) 7 (63.6%) 53 (74.7%)
≤ 15 43 (97.7%) 16 (100%) 9 (81.8%) 68 (95.8%)
Awake
Mean difference, mmHg 3.6 (6.2) 2.1 (7.7) 4.3 (11.0) 3.4 (7.4)
Mean absolute difference, mmHg 6.4 (5)
≤ 2 mmHg 13 (29.6%) 3 (18.8%) 2 (18.2%) 18 (25.4%)
≤ 5 mmHg 22 (50.0%) 9 (64.3%) 4 (36.4%) 35 (49.3%)
≤ 10 mmHg 39 (88.6%) 14 (87.5%) 7 (63.6%) 60 (84.5%)
≤ 15 mmHg 43 (97.7%) 15 (93.8%) 9 (81.8%) 67 (94.4%)
Asleep
Mean difference, mmHg 8.6 (9.2) 10.3 (10.5) 13.0 (10.8) 9.7 (9.8)
Mean absolute difference, mmHg 11.7 (7.1)
≤2 5 (11.4%) 1 (6.3%) 0 (0%) 6 (8.5%)
≤5 13 (29.5%) 4 (25.0%) 1 (9.1%) 18 (25.4%)
≤ 10 24 (54.5%) 8 (50.0%) 4 (36.4%) 36 (50.7%)
≤ 15 32 (72.7%) 8 (50.0%) 6 (54.5%) 46 (64.8%)
Table 5. Agreement between RefBP and TestBP-V1.5 for mean systolic (panel A) and diastolic (panel B) 24 h,
awake and asleep blood pressure values, stratified by mean systolic daytime blood pressure and mean diastolic
awake blood pressure respectively. Data are mean (± standard deviation) or counts (percent).
analysis have increased, challenging the clinician to understand these new measurements. Generally guidelines
suggest the use of validated devices in clinical practice however some newer techniques fail validation when
compared to standard measurements2. A caveat in the validation of BP devices may be that the ESH-IP 2010
protocol was developed to compare single device measurements to single gold standard measurements using
a mercury sphygmomanometer under laboratory conditions. This is useful and adequate to validate standard
cuff based BP devices, but may give a misleading security for 24 h BP measurement devices with alternative
techniques and beat-to-beat BP d etermination18,20. Therefore in 2017 our group evaluated the accuracy of a
ESH-IP 2010 validated cuffless PTT device (Test BP) against a cuff-based standard device (Ref BP) over 24 h
under usual clinical condition7.
Scientific Reports | (2021) 11:1143 | https://doi.org/10.1038/s41598-020-80905-x 6
Vol:.(1234567890)www.nature.com/scientificreports/
Figure 2. Receiver operating characteristic curve for systolic (A) 24 h, (B) awake, (C) asleep and diastolic, (D)
24 h, (E) awake and (F) asleep BP levels.
Test characteristics of TestBP-V1.5at different cut-offs Sensitivity (%) Specificity (%) PPV (%) NPV (%)
Standard cut-off for the detection of systolic mean 24 h hypertension
95 65 74 92
130 mmHg
Highest Youden’s Index for systolic mean 24 h hypertension at 133 mmHg 95 80 83 93
Standard cut-off for the detection of diastolic mean 24 h hypertension
90 70 70 90
80 mmHg
Highest Youden’s Index for diastolic mean 24 h hypertension at 87 mmHg 81 98 96 87
Standard cut-off for the detection of mean systolic awake hypertension
94 78 80 93
135 mmHg
Highest Youden’s Index for systolic mean awake hypertension at 135 mmHg 94 78 80 93
Standard cut-off for the detection of mean diastolic awake hypertension
89 75 68 92
85 mmHg
Highest Youden’s Index for diastolic mean awake hypertension at 91 mmHg 74 98 95 86
Standard cut-off for the detection of mean systolic asleep hypertension
91 33 57 80
120 mmHg
Highest Youden’s Index for systolic asleep hypertension at 136 mmHg 60 80 75 68
Standard cut-off for the detection of mean asleep diastolic hypertension
87 39 51 80
70 mmHg
Highest Youden’s Index for diastolic asleep hypertension at 83 mmHg 70 93 87 81
Table 6. Test characteristics for different TestBP-V1.5 values for systolic and diastolic mean 24 h, awake, and
asleep. Hypertension determined by RefBP with standard cut-offs (systolic/diastolic 24mean 130/80 mmHg,
awake 135/85 mmHg, asleep 120/70 mmHg)2.
We showed a significant difference in all measurements (mean 24 h, awake, and asleep), with the most diver-
gence seen during assessment of blood pressure during sleep. The TestBP revealed higher BP values than the
RefBP and overall, the study brought attention to the fact that, the two devices which measure BP differently
came out with significant differences in v alues7, Highlighting that results of cuff-less and cuff-based devices are
not directly interchangeable in clinical practice.
Scientific Reports | (2021) 11:1143 | https://doi.org/10.1038/s41598-020-80905-x 7
Vol.:(0123456789)www.nature.com/scientificreports/
In July 2018, the TestBP device’s manufacturers updated the software algorithm. This created the need to
reassess the data and evaluate the diagnostic accuracy of the TestBP device. Comparing the RefBP to the TestBP-
V1.4 and TestBP-V1.5, we see improvements in the accuracy of measurements in relation to the RefBP especially
for the asleep diastolic values with various modes of comparison. However, significantly higher measurements
are still seen with the TestBP device, as was apparent before the update. Improvement in data output in terms
of better agreement to RefBP was seen overall but especially with asleep values. Best agreement was in the high
normal to grade 1-hypertension categories.
Therefore, the issue remains that measurements of the RefBP and the TestBP are not interchangeable. The fact
that the device is on the market and already in clinical use, led to the further analysis of how the TestBP-V1.5
results could reliably discriminate between normotension and hypertension. In doing, a compass for clinical
interpretation could be created with the aim of device specific cut-off values. Therefore, we used an alternative
approach to analyze the data, implementing a technique used when determining the diagnostic accuracy of
biomarkers against a gold standard diagnosis. In our case, the TestBP device was the biomarker and the RefBP
was the gold standard to create the adjudicated diagnosis of hypertension according to standard cut-off values
given in the 2018 ESC/ESH g uidelines2. Our ROCs demonstrated that for systolic and diastolic mean 24 h and
awake measurements, the TestBP-V1.5 has a high diagnostic accuracy with an AUC of ≥ 0.92–0.94 while the
TestBP-V1.5 showed less ability to accurately detect systolic and diastolic hypertension during asleep measure-
ments with an AUC of 0.77 and 0.84, respectively when compared to the RefBP. Using Youden’s index as the
optimal device specific cut-off value to detect hypertension, we found cut-off values of 133/87 mmHg for 24 h
mean, 136/91 mmHg awake and 136/83 mmHg asleep best for the distinction of hypertension and normotension.
With the awareness that the TestBP derives higher BP values than the RefBP, the calculated PPV, NPV, and
Youden’s Index may help to guide clinicians on how to interpret the results of the TestBP. This is a vital step
when incorporating new devices into practice—especially when usual validation protocols were limited due to
the measurement technique.
Strengths and limitations. The strength of our study was that our data reflected a 24 h period, simulta-
neously created with two different devices. To date, this is the largest cohort comparing the TestBP device to a
RefBP device simultaneously over a 24 h period in a routine clinical setting. Since this was an investigator-initi-
ated trial with the aim of evaluating the accuracy of the PTT device in clinical practice, we had no insights into
the technical changes applied by the manufacturer to this latest algorithm update. This software update is now
available and in use by customers. Therefore our study adds very important information for these practitioners.
This study implemented the widely used Spacelabs 90217A 24 h BPM device as a clinically validated reference
device11. All cuff-based BPM devices show differences when compared to the gold standard for device validation,
which are comparisons to mercury sphygmomanometers, the reported mean differences and accuracy tables
may differ slightly in a comparison to another cuff-based 24 h measurement device. Nevertheless, the Spacelabs
device meets the Association for the Advancement of Medical Instrumentation’s standard for standing, sitting
and supine measurements and was graded “A” for systolic and diastolic BP in a modified British Hypertension
Society protocol.
As mentioned in the methods section of the paper we used 27 measurements as the minimum number for a
valid RefBP measurement set. This criteria is in line with current recommendations in clinical settings. Although
in some research settings stricter criteria are sometimes applied, we would like to emphasize that this study
focused on the comparability of two devices in a typical clinical setting and even then that we maintained a very
high quality control standard with an average of 60 measurements per participant (Table 1).
Another limitation is for the derivation of device specific cut-off values, more participants should be enrolled
from various demographics (age, race, comorbidities, BP ranges). Therefore, the current data should be inter-
preted in the framework of a pilot evaluation.
Conclusions
We showed that the software update significantly improved the agreement of the tested cuff-less device (TestBP)
in comparison to the cuff-based device (RefBP). This development emphasized that asleep values improved with
the software update. In summary, we showed that TestBP-V1.5 correlates better to the RefBP than TestBP-V1.4.
After the software update, the difference between the RefBP and the TestBP-V1.5 is less but remains statisti-
cally and clinically significant. When applying device specific cut-off points the TestBP device may be a reliable
tool for the detection of systolic and diastolic hypertension for 24 h and awake BP values, but less so for asleep
measurements.
Received: 17 March 2020; Accepted: 29 December 2020
References
1. Kearney, P. M. et al. Global burden of hypertension: Analysis of worldwide data. Lancet 365 (9455), 217–223 (2005).
2. Williams, B. et al. 2018) ESC/ESH Guidelines for the management of arterial hypertension. The Task Force for the management
of arterial hypertension of the European Society of Cardiology (ESC) and the European Society of Hypertension (ESH). G. Ital.
Cardiol. (Rome) 19 (11), 3–73 (2018).
3. Williams, B. et al. 2018 Practice guidelines for the management of arterial hypertension of the European Society of hypertension
(ESH) and the European Society of cardiology (ESC). Blood Press. 27 (6), 314–340 (2018).
4. Leary, A. C. & Murphy, M. B. Sleep disturbance during ambulatory blood pressure monitoring of hypertensive patients. Blood
Press. Monit. 3 (1), 11–15 (1998).
Scientific Reports | (2021) 11:1143 | https://doi.org/10.1038/s41598-020-80905-x 8
Vol:.(1234567890)www.nature.com/scientificreports/
5. Sheshadri, V., Tiwari, A. K., Nagappa, M. & Venkatraghavan, L. Accuracy in blood pressure monitoring: The effect of noninvasive
blood pressure cuff inflation on intra-arterial blood pressure values. Anesth. Essays Res. 11 (1), 169–173 (2017).
6. Bilo, G. et al. Validation of the Somnotouch-NIBP noninvasive continuous blood pressure monitor according to the European
Society of hypertension international protocol revision 2010. Blood Press. Monit. 20 (5), 291–294 (2015).
7. Krisai, P. et al. Accuracy of 24-hour ambulatory blood pressure monitoring by a novel cuffless device in clinical practice. Heart.
https://doi.org/10.1136/heartjnl-2018-313592 (2018).
8. Gesche, H., Grosskurth, D., Kuchler, G. & Patzak, A. Continuous blood pressure measurement by using the pulse transit time:
Comparison to a cuff-based method. Eur. J. Appl. Physiol. 112 (1), 309–315 (2012).
9. Schiffrin, E. L. Vascular stiffening and arterial compliance Implications for systolic blood pressure. Am. J. Hypertens. 17, 39–48
(2004).
10. Callaghan, F. J., Babbs, C. F., Bourland, J. D. & Geddes, L. A. The relationship between arterial pulse-wave velocity and pulse
frequency at different pressures. J. Med. Eng. Technol. 8 (1), 15–18 (1984).
11. Baumgart, P. & Kamp, J. Accuracy of the SpaceLabs Medical 90217 ambulatory blood pressure monitor. Blood Press. Monit. 3 (5),
303–307 (1998).
12. Mancia, G. et al. 2013 ESH/ESC practice guidelines for the management of arterial hypertension. Blood Press. 23 (1), 3–16 (2014).
13. McCormack, T., Krause, T. & O’Flynn, N. Management of hypertension in adults in primary care: NICE guideline. Br. J. Gen. Pract.
62 (596), 163–164 (2012).
14. Meng, L. et al. Validation of Omron HBP-1300 professional blood pressure monitor based on auscultation in children and adults.
BMC Cardiovasc. Disord. 16, 9 (2016).
15. Takahashi, H., Yokoi, T. & Yoshika, M. Validation of the OMRON HBP-1300 Upper Arm Blood Pressure Monitor, in Oscillometry
Mode, for Clinic Use in a General Population, According to the European Society of Hypertension International Protocol Revision
2010 (DablEducational Trust Dublin, Dublin, 2014).
16. Parati, G. et al. European Society of hypertension practice guidelines for ambulatory blood pressure monitoring. J. Hypertens. 32
(7), 1359–1366 (2014).
17. Koo, T. K. & Li, M. Y. A guideline of selecting and reporting intraclass correlation coefficients for reliability research. J. Chiropr.
Med. 15 (2), 155–163 (2016).
18. O’Brien, E. et al. European Society of hypertension international protocol revision 2010 for the validation of blood pressure
measuring devices in adults. Blood Press. Monit. 15, 23–38 (2010).
19. O’Brien, E. & Fitzgerald, D. The history of blood pressure measurement. J. Hum. Hypertens. 8, 73–84 (1994).
20. Padwal, R. Cuffless blood pressure measurement: How did accuracy become an afterthought? Am. J. Hypertens. 32, 807–809 (2019).
Author contributions
Conceptualization: T.S., P.K. and T.B.; Methodology: T.B., A.M. and A.V.; Validation: T.B. and A.V.; Formal
Analysis: T.S. and P.K. ; Resources: T.B. and M.M.; Data Curation: T.S., P.K., A.V., A.M. and T.B.; Writing: Original
Draft Preparation, T.S.; Writing—Review & Editing, P.K., A.V., A.M., T.B. and M.M.; Supervision T.B., A.V. and
M.M.; Project Administration, T.S., P.K. and T.B.; Funding Acquisition, T.B. and M.M.
Funding
The study was fully funded by the Medical Outpatient and Hypertension Clinic, ESH Hypertension Centre of
Excellence, University Hospital Basel, Basel, Switzerland. This research received no external funding.
Competing interests
The authors declare no competing interests.
Additional information
Supplementary Information The online version contains supplementary material available at https://doi.
org/10.1038/s41598-020-80905-x.
Correspondence and requests for materials should be addressed to T.S.
Reprints and permissions information is available at www.nature.com/reprints.
Publisher’s note Springer Nature remains neutral with regard to jurisdictional claims in published maps and
institutional affiliations.
Open Access This article is licensed under a Creative Commons Attribution 4.0 International
License, which permits use, sharing, adaptation, distribution and reproduction in any medium or
format, as long as you give appropriate credit to the original author (s) and the source, provide a link to the
Creative Commons licence, and indicate if changes were made. The images or other third party material in this
article are included in the article’s Creative Commons licence, unless indicated otherwise in a credit line to the
material. If material is not included in the article’s Creative Commons licence and your intended use is not
permitted by statutory regulation or exceeds the permitted use, you will need to obtain permission directly from
the copyright holder. To view a copy of this licence, visit http://creativecommons.org/licenses/by/4.0/.
© The Author(s) 2021
Scientific Reports | (2021) 11:1143 | https://doi.org/10.1038/s41598-020-80905-x 9
Vol.:(0123456789)You can also read