Forecast of COVID-19 related deaths in the USA - Research ...
←
→
Page content transcription
If your browser does not render page correctly, please read the page content below
Preprint: Please note that this article has not completed peer review.

Forecast of COVID-19 related deaths in the USA
CURRENT STATUS:                    POSTED

Rutger A Middelburg
LUMC

 r.a.middelburg@lumc.nlCorresponding Author
ORCiD: https://orcid.org/0000-0002-6545-7277

Frits R Rosendaal
LUMC

DOI:
  10.21203/rs.3.rs-25842/v1
SUBJECT AREAS
 Epidemiology       Infectious Diseases
KEYWORDS
 COVID-19, forecast, prevention, mortality

                                                   1
Abstract
Objective

Different governments have adopted different containment strategies for SARS-CoV-2. We compared

reports of COVID-19 related deaths between countries with different strategies.

Design

Publicly available data on numbers of reported COVID-19 related deaths between January 1st and

April 2nd 2020 were compared between countries.

Results

In countries that implemented strict containment strategies as soon as the virus was firmly

established (e.g., Italy and Spain) the epidemic developed similarly to the development in China.

Extrapolation suggests the cumulative number of deaths in Italy and Spain to rise to about 22,000

and 41,000, respectively. In South Korea where containment strategies were implemented before the

virus arrived, the epidemic developed much slower. In the United States, however, where measures

were taken later, the epidemic is developing explosively. Cumulative numbers of deaths in the New

York, New Jersey, and Michigan area are forecast to reach about 15,000. Of note, 85% of these deaths

are likely to occur within the first 50 days of the epidemic (i.e. before the end of April 2020).

Conclusions

Although the future development of the epidemic remains difficult to predict accurately, current data

suggest the United States will experience an explosive increase in deaths due to COVID-19 before the

end of April 2020. Drastic measures are needed immediately to prevent other parts of the country

from experiencing a development of this epidemic which is as dramatic as that seen in New York, New

Jersey and Michigan.

Article Summary
Strengths of this study

Easy, direct, graphic comparison of epidemic development between countries

Prediction of development of the epidemic in individual countries in the near future

Shape of the epidemic development corrected for testing and reporting bias

                                                     2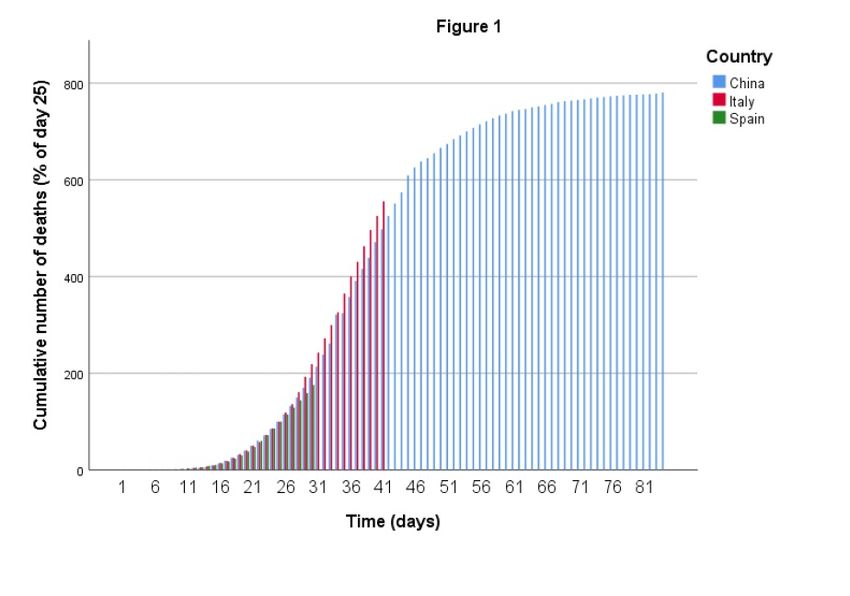
Limitations of this study

Absolute numbers subject to testing and reporting bias

All results subject to chance variation

Introduction
Since the start of the outbreak of SARS-CoV-2 in December 2019, in the Hubei province in China, the

virus has quickly spread worldwide.[1-3] As the virus spread, so did the COVID-19 disease that it

causes. To curb the surge in COVID-19 related mortality, different governments enforced different

measures for the containment of the epidemic.[4, 5] Comparing numbers of cases between countries

is difficult, due to vast differences in testing policies. Now, as the epidemic claims more lives

worldwide, the accumulation of mortality can be compared between countries,[6, 7] to obtain some

insight into the effectiveness of the different containment measures. Here, we present the results of

our comparison.

Methods
Data

Reported numbers of deaths per country were obtained from the European Union Open Data Portal,

where data on worldwide numbers of reported cases and numbers of reported deaths, for the COVID-

19 epidemic are updated daily.[6] Numbers of reported deaths between January 1st and April 2nd

2020 were compared between countries.

Comparability of data between countries

The comparability of data between countries was increased in two distinct ways. First, the start of the

epidemic was synchronized between countries, by using the date of the first reported COVID-19

related death as the index date. Second, the size and susceptibility of the population, and the

probability of a COVID-19 death being reported as such, were all corrected for in a single procedure.

All cumulative numbers of death were normalized to a reference number. As a reference we took the

cumulative number of deaths at day 25 of the synchronized epidemic (i.e. day 25 after the index date

for each country). By day 25 after the first death, the epidemic has stably established itself and the

number of deaths has increased to a level where random fluctuations are reduced to an acceptable

                                                    3
level. To assess the potential influence of choosing day 25 as a reference, sensitivity analyses were
performed taking days 20 and 30 as the references.
Visual representation and categorization of countries
After synchronizing countries by the date of the first death in each country, cumulative numbers of
deaths were expressed as percentages of the cumulative number of deaths on day 25, for each
country. Resulting percentages were expressed in graphs, plotted against synchronized time.
Temporal trends in cumulative numbers of deaths were compared to those for China, where the
epidemic started, and where the temporal trends have therefore developed the farthest. For
comparison to China, countries were divided into three categories. First, countries with a policy
similar to that of China. These are the European countries, where governments waited for the
epidemic to establish itself, but not for substantial numbers of COVID-19 related deaths to occur,
before taking preventive measures. Italy and Spain were used as examples, but graph shapes for
other European countries were rather similar. Second, in South Korea, strict preventive measures
were put into place even before the virus spread substantially in the population. Third, a comparison
was made with the United States, where preventive measures were not put into place until large
numbers of deaths had occurred.
Forecast
Based on the comparison with China, where the epidemic in Hubei province has been contained and
has ended virtually completely, results from other countries can be extrapolated beyond the current
point in time, to arrive at a forecast of COVID-19 deaths in the near future.
Patient and public involvement and ethics considerations
Since only publicly available data, aggregated at the level of countries was used, no individual patient
data was included. Therefore, patient involvement did not apply to this study.
Results
As shown in figure 1, the temporal development of the epidemic in Italy and Spain closely resembles
that of China. Figure 2 shows the temporal development of the epidemic in South Korea, which is
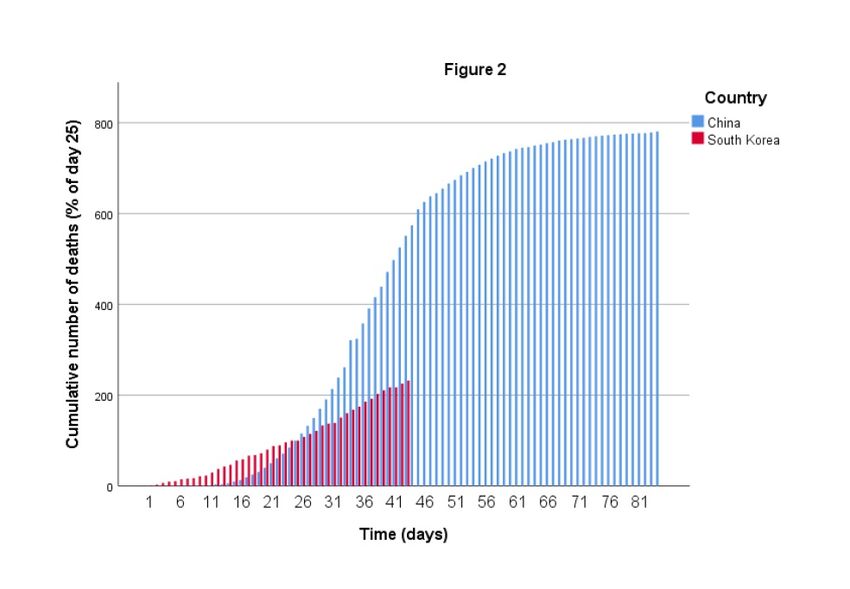
much more gradual. Finally, figure 3 shows the development in the United States, where the epidemic
4develops much more rapidly.
Sensitivity analyses, using different reference days, produced very similar results.
Forecast
By day 80, the accumulation of deaths in China had come to a virtual standstill at 3,306 deaths.
Extrapolating the epidemic in Italy and Spain results in a forecasted cumulative number of deaths by
day 80 of about 22,000 and 41,000, respectively. For South Korea this number would be 250 and for
the United States it would be about 15,000. Of note, 85% of these deaths are likely to occur within the
first 50 days of the epidemic (i.e., before the end of April 2020 in the US).
Discussion
We have shown a clear difference in development of the COVID-19 epidemic between countries with
different containment policies.
Most importantly, we note a dramatically accelerated accumulation of deaths in the United States. Of
note, the forecast for the United States is likely to apply to the cumulative number of deaths in the
states of New York, New Jersey, and Michigan. This is because the epidemic centered in this area also
largely drove the cumulative number of reported deaths so far. If during the coming weeks the entire
United States are affected similarly to this area, the total numbers are likely to be 15-fold higher (i.e.
over 200,000). Importantly, this number reflects only deaths reported as COVID-19 related, while the
true number of deaths to which COVID-19 contributed is likely to be much higher.[8] However, the
other parts of the United States might still be able to stay closer to the pattern of temporal
development observed in Europe, if strict containment measures are applied immediately. Failing
this, the only way in which a total number of deaths in excess of 200,000, by May 15th 2020, seems
avoidable would be through a depletion of susceptibles. In this case, the death rate would slow down
dramatically before day 50, not because containment measures stopped the spread of the virus, but
because everybody who was susceptible has already died. The total number of susceptibles is
currently almost impossible to estimate and hoping for a depletion of susceptibles, to end the rapid
accumulation of deaths, therefore doesn’t seem advisable.
Further, although the cumulative number of deaths estimated for day 80 in South Korea is low, the
5epidemic is likely to last much longer there, due to its slow development. Whether the final number of
deaths per inhabitant will also be lower therefore remains to be seen.
To appreciate our results, it is important to note that data from different countries are not directly
comparable, for at least five distinct reasons. First, the virus did not arrive in all countries
simultaneously, causing a desynchronized development of the epidemic in different countries.
Second, absolute numbers are incomparable due to different population sizes. Third, rates per
100,000 of the population are incomparable, because not all countries are affected homogeneously.
Especially in the larger countries, like China and the United States, epidemics can be (temporarily)
focused on a localized level. For example, in China, the province of Hubei was severely affected, while
the rest of the country was not. Therefore, correction for the total size of the Chinese population
would not provide a representative figure. Fourth, susceptibility to death by COVID-19 can differ
between populations, depending on the demographic composition of a country’s population. For
example, in Italy, older people are known to be relatively overrepresented in the population, and to
be more likely to be in a single household with relatives from a younger generation, causing increased
numbers of elderly to be infected and therefore relatively more COVID-19 mortality. Fifth, a death
during the COVID-19 epidemic will only be reported as a COVID-19 related death if the patient was
diagnosed with SARS-CoV-2 infection. Therefore, differences in testing policy and guidelines for
clinical diagnosis (i.e. in the absence of laboratory testing), will also cause differences in estimated
numbers of COVID-19 related deaths.
The first problem was addressed by choosing an appropriate index date for each country and setting
this date to day 1, for the start of the epidemic in that country. As an index date, we choose the date
of the first reported COVID-19 related death in each country. Admitted, chance processes play a role
here, causing some misclassification. The remaining four problems all pertain to the size and the
susceptibility of the population, or the probability of a COVID-19 related death being reported as such.
Adequately control for all factors influencing these problems is a practical impossibility.
Therefore, we choose to normalize the cumulative number of deaths, by a reference number of
deaths. The number of actually reported COVID-19 related deaths is clearly a direct function of the
6size and susceptibility of the population and the probability of a COVID-19 related death being
reported as such. Therefore, taking the reported number of COVID-19 related deaths on a
synchronized reference date as a standard will correct results for all these factors simultaneously. In
conclusion, although the future development of the epidemic remains difficult to predict accurately,
due to changing containment policies, changing seasonal influences,[9] and the possibility of a
depletion of susceptibles, or the development of herd immunity,[10, 11] current data suggest the
United States to expect an explosive increase in cumulative mortality due to COVID-19, with
containment policies still lagging behind. Drastic measures are needed immediately to curb the
unprecedented epidemic which is currently unfolding across this country.
Declarations
Acknowledgements
We wish to thank all clinicians worldwide, who in the difficult situation they find themselves in, trying
to save as many lives as possible during this dramatic epidemic, have taken the time to report COVID-
19 related deaths, to help science understand the epidemic better. Further, we thank Dr Ewout W.
Steyerberg, Professor of Clinical Biostatistics & Medical Decision Making, Chair of the Department of
Biomedical Data Sciences at the Leiden University Medical Center, Leiden, The Netherlands for critical
reading of our manuscript and valuable suggestions.
Author contributions and guarantor:
RAM conceptualised, designed, and executed the research, wrote the manuscript, and acts as the
guarantor. The guarantor affirms that the manuscript is an honest, accurate, and transparent account
of the study being reported; that no important aspects of the study have been omitted; and that any
discrepancies from the study as originally planned have been explained.
FRR conceptualised the research and revised the manuscript.
Competing interests:
None of the authors report any competing interest relevant to this paper.
Copyright statement:
The Corresponding Author has the right to grant on behalf of all authors and does grant on behalf of
7all authors, a worldwide licence to the Publishers and its licensees in perpetuity, in all forms, formats
and media (whether known now or created in the future), to i) publish, reproduce, distribute, display
and store the Contribution, ii) translate the Contribution into other languages, create adaptations,
reprints, include within collections and create summaries, extracts and/or, abstracts of the
Contribution, iii) create any other derivative work(s) based on the Contribution, iv) to exploit all
subsidiary rights in the Contribution, v) the inclusion of electronic links from the Contribution to third
party material where-ever it may be located; and, vi) licence any third party to do any or all of the
above."
Role of funding source:
There was no funding for this research.
Data sharing statement:
No additional data is available.
References
1. Ahn, D.G., et al., Current Status of Epidemiology, Diagnosis, Therapeutics, and
Vaccines for Novel Coronavirus Disease 2019 (COVID-19). J Microbiol Biotechnol,
2020. 30(3): p. 313-324.
2. Bar-On, Y.M., et al., SARS-CoV-2 (COVID-19) by the numbers. Elife, 2020. 9.
3. Dyer, O., Covid-19: hospitals brace for disaster as US surpasses China in number
of Bmj, 2020. 368: p. m1278.
4. Yan, Y., et al., The First 75 Days of Novel Coronavirus (SARS-CoV-2) Outbreak: Recent
Advances, Prevention, and Treatment. Int J Environ Res Public Health, 2020. 17(7).
5. Pike, T.W. and V. Saini. An international comparison of the second derivative of
COVID-19 deaths after implementation of social distancing measures. 2020 03-04-
2020]; Available from: https://doi.org/10.1101/2020.03.25.20041475.
6. EU, EU Open Data Portal: COVID-19 cases worldwide. 2020:
https://www.ecdc.europa.eu/sites/default/files/documents/COVID-19-geographic-
8disbtribution-worldwide.xlsx.
7. Petropoulos, F. and S. Makridakis, Forecasting the novel coronavirus COVID-19. PLoS
One, 2020. 15(3): p.
8. Brown, E., B. Reinhard, and A.C. Davis Coronavirus death toll: Americans are almost
certainly dying of covid-19 but being left out of the official count. The Washington
9. Neher, R.A., et al., Potential impact of seasonal forcing on a SARS-CoV-2 pandemic.
Swiss Med Wkly, 2020. 150: p.
10. Kwok, K.O., et al., Herd immunity - estimating the level required to halt the COVID-19
epidemics in affected countries. J Infect,
11. Tang, B., et al., An updated estimation of the risk of transmission of the novel
coronavirus (2019-nCov). Infect Dis Model, 2020. 5: p. 248-255.
Figures
9Figure 1
Development of epidemic in countries with early containment policies. Development of the
epidemic in Italy and Spain, compared to China. Each bar represents a calendar date. Dates
from different countries have been synchronized with the date of the first reported COVID-
19 related death as day 1. Height of the bars represents the cumulative number of reported
COVID-19 related deaths in that country, expressed as a percentage of the number of
deaths on day 25 in that country.
10Figure 2
Development of epidemic in a country with preemptive containment policies. Development
of the epidemic in South Korea, compared to China. Each bar represents a calendar date.
Dates from different countries have been synchronized with the date of the first reported
COVID-19 related death as day 1. Height of the bars represents the cumulative number of
reported COVID-19 related deaths in that country, expressed as a percentage of the number
of deaths on day 25 in that country.
11Figure 3
Development of the epidemic in a country with late containment policies. Development of
the epidemic in the United States of America, compared to China. Each bar represents a
calendar date. Dates from different countries have been synchronized with the date of the
first reported COVID-19 related death as day 1. Height of the bars represents the
cumulative number of reported COVID-19 related deaths in that country, expressed as a
percentage of the number of deaths on day 25 in that country.
12You can also read