Self Storage Group ASA - Second quarter and first half year2021 18 August 2021 - Cision
←
→
Page content transcription
If your browser does not render page correctly, please read the page content below
Self Storage Group ASA
Second quarter and first half year 2021
18 August 2021
                                          |1
FINANCIALS Q2 & 1H 2021

                          |2
SELF STORAGE GROUP AT A GLANCE

                        3                  124                 27 500
                     Countries             Facilities         Storage rooms

            163 300              m2   36 700 m2             200 000 m2
              Current lettable area   Lettable area under    Total lettable area
                                         development

As of 30 June 2021
                                                                                   |3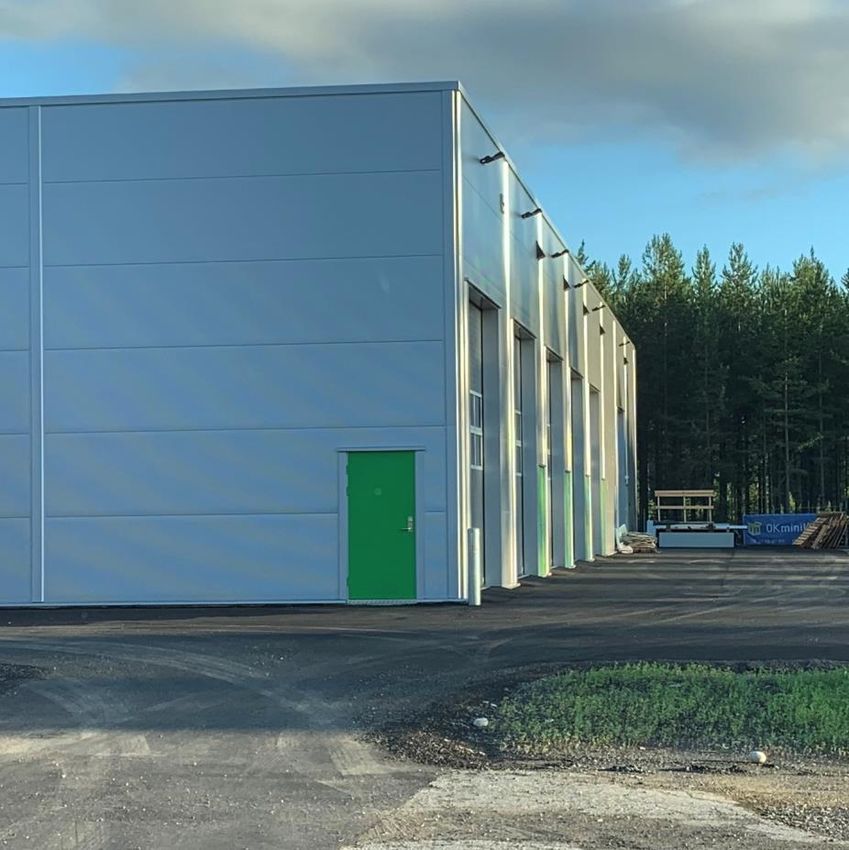
GROUP HIGHLIGHTS
The second quarter and first half year 2021 showed solid organic revenue- and EBITDA-growth, in addition to the
acquisition of Dit Pulterkammer, development of facilities and acquisition of new properties. There is a strong demand for
SSG’s services, and the Group has a solid platform for further profitable growth and expansion.
Q2 2021
• All time high revenues of NOK 85.9 million, up 20% from NOK 71.7 million in Q2 2020

• All time high adjusted EBITDA1 of NOK 54.5 million, up 27% from NOK 42.9 million in Q2 2020

• Adjusted profit before tax1 of NOK 21.0 million, up 119% from NOK 9.6 million in Q2 2020
▪ Average occupancy for sites open more than 12 months was 89.2% (82.3%) with an average rent per m 2 of NOK 2 264
  per year (NOK 2 349)

First half 2021
• All time high revenues of NOK 162.6 million, up 14% from NOK 142.5 million in the first half year 2020

• All time high adjusted EBITDA1 of NOK 99.6 million, up 18% from NOK 84.4 million in the first half year 2020

• Adjusted profit before tax1 of NOK 75.2 million, up 161% from NOK 28.8 million in the first half year 2020

• Acquisition of Dit Pulterkammer Holding A/S, a Danish regional self-storage operator with five facilities with a current
  lettable area of approximately 9 400 m2, and four properties in Norway

• Total value of freehold investment property of NOK 1 990 million as of June 2021, up from NOK 1 457 million end of
  December 2020

1) Adjusted for non-recurring items of NOK 2.3 million in Q2 2021, NOK 0.0 million in Q2 2020, NOK 3.4 million in first half 2021, NOK 1.5 million in first half 2020
                                                                                                                                                                        |4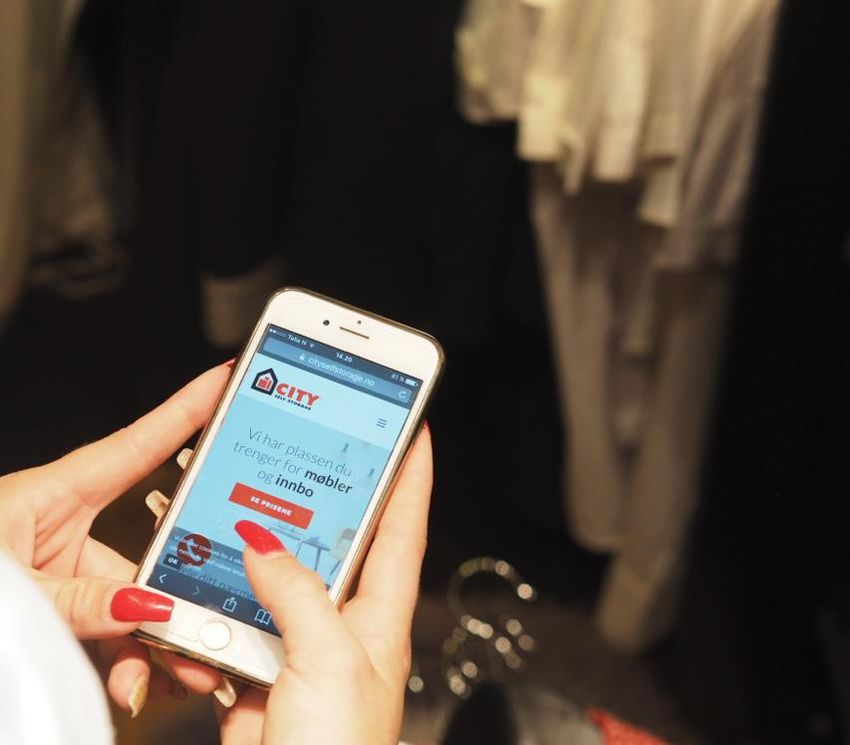
KEY PERFORMANCE INDICATORS – SECOND QUARTER 2021
                                                         CLA                      Facilities                 Occupancy                   Average rent

                            Q2 2021                163 300 m2                          124                       89.2%*                2 264 NOK pr m2 *

                             Q2 2020                142 100 m2                          113                      82.3%*                2 349 NOK pr m2 *

                                                    +21 200 m2                         +11                          +6.9*                -85 NOK pr m2*

                        Performance Like-for-Like (L-f-L) facilities with comparable m2 in Q2 21 and Q2 20**

                                                                                                                            +9.2                            -56
                           Like-for-like            113 400 m2                          94                          90.1%               2 358 NOK pr m2

                           CLA increased by 14.9% since June 2020                                                   Occupied area* increased by 22.7% since Q2 2020
                                                                                                                                                                            153 900
              170 000                                        7 600        4 200        163 300                      150 000                                       137 300
                                                                                                                                              136 000
              150 000                         9 400
                               142 100                                                                              130 000
                                                                                                              CLA                   111 900
              130 000                                                                                               110 000
              110 000                                 +14.9%                                                            90 000                   +22.7%
                90 000                                                                                                  70 000
                              CLA June     Acqusition        New CLA   Expansions      CLA June                                          Q2-20                        Q2-21
                                2020                                                     2021
                                                                                                                                   Occupied>12 Month    CLA> 12 Month

* Average occupancy and rent price pr m2 for all sites with more than 12 months of operation, expansions are included

** Facilities with same CLA in Q2 21 as in Q2 20 +/- 50 m2                                                                                                                            |5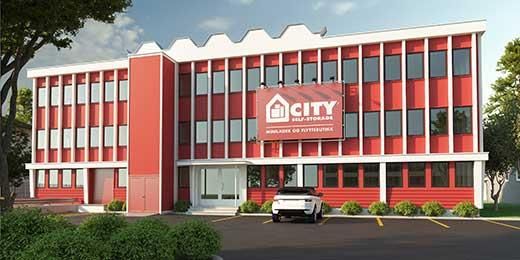
DEVELOPMENT IN CAPACITY, OCCUPANCY AND RENT
 Occupancy Like-for-Like2 ) was 90.1% in Q2-21 compared to 80.9% in Q2-20
 Average rent pr m2 per year Like-for-Like2) was NOK 2 358 in Q2-21 compared to NOK 2 414 in Q2-20

 AVERAGE OCCUPANCY1) AND RENT1)                                                                                    CURRENT LETTABLE AREA

      100%                                                                                     4 000             120 000
                                 92.3 %                                92.3 %                                                                                                         113 400
                                                89.5 %    89.80%                   90.1 %
        90%
                    83.9 % 85.1 %            83.2 %                84.5 %                      3 500
                                                                                80.9 %
                                                                                                                 100 000
        80%       78.2 %
                                                                                               3 000
        70%
                                                                                                                  80 000
                                                                                               2 500
        60%
                                                                                                                                                                             62 300
                                                                                                                  60 000     56 900                                      58 600
        50%                                                                                    2 000
                                                                                                                         49 900

        40%
                                                                                               1 500              40 000
        30%
                                                                                               1 000                                                   18 400
                                                                                                                  20 000                   16 300
        20%                                                                                                                           16 100      17 500         9 400
                                                                                               500
        10%
                                                                                                                          0
         0%                                                                                    0                              CSS N       CSS S     CSS D       DPK        OK M       L-f-L
      Occupancy    CSS N        CSS S         CSS D      DPK         OK M         L-f-L                                                     30.06.2020      30.06.2021
                                                                                                   Average rent
                   Average occupancy Q2-20                           Average occupancy Q2-21

                   Average rent Q2-20                                Average rent Q2-21

Expansions of lettable area during the year on facilities already opened, and longer filling-up phase than 12 months for some large facilities impact average occupancy
 1)   Average occupancy and rent per m2 for sites with more than 12 months of operation in NOK, expansions are included
 2)   Facilities with same CLA in Q2 21 as in Q2 20 +/- 50 m2                                                                                                                                   |6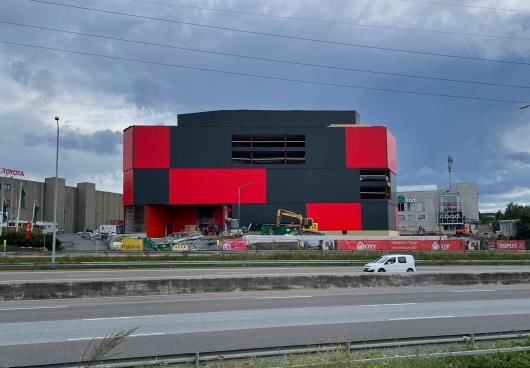
KEY FIGURES – SECOND QUARTER 2021
(NOK million)

                                                                                                                                     Adjusted EBITDA development
   KEY FIGURES                                                                                                                            Q2 2020 vs Q2 2021

                                                                                       Q2 21
                                                                                       change
                                                        Q2 21          Q2 20           Q2 20           FY 2020           60
                                                                                                                                            4.6   -3.0
Revenue                                                      85.9           71.7           +14.3         293.3           55                              -2.0   2.3   54.5
                                                                                                                                     9.7
Lease expenses                                                -2.9           -2.8             -0.1         -9.4
                                                                                                                         50
Property-related expenses                                     -8.5           -7.7             -0.8       -36.1
                                                                                                                         45   42.9

                                                                                                                  MNOK
Salary and other employee benefits                          -10.5            -9.9             -0.6       -40.2                                    27%

Other operating expenses                                    -11.8            -8.3             -3.5       -32.1           40

EBITDA                                                       52.2           42.9             +9.3        175.4           35

Adjustments1)                                                  2.3            0.0            +2.3          1.7           30
Adjusted EBITDA                                              54.5           42.9           +11.6         177.1
                                                                                                                         25
Adjusted EBITDA-margin                                     63.4%          59.8%            81.7%         60.4%

   1) Adjusted for non-recurring costs related to acquisitions, restructuring and severance packages
                                                                                                                                                                      |7
KEY FIGURES – FIRST HALF YEAR 2021
(NOK million)

                                                                                                                                      Adjusted EBITDA development
   KEY FIGURES                                                                                                                             1H 2020 vs 1H 2021

                                                                                       1H 21
                                                                                       change
                                                        1H 21          1H 20           1H 20           FY 2020           115
                                                                                                                                             4.6   -4.9
Revenue                                                    162.6          142.5            +20.1         293.3           105          15.5                -2.0         99.6
                                                                                                                                                                 1.9
Lease expenses                                                -5.2           -5.8            +0.6          -9.4          95
                                                                                                                               84.4
                                                                                                                         85
Property-related expenses                                   -19.6          -15.8              -3.8       -36.1
                                                                                                                         75

                                                                                                                  MNOK
Salary and other employee benefits                          -21.3          -20.9              -0.4       -40.2                                     18%
                                                                                                                         65
Other operating expenses                                    -20.3          -17.0              -3.3       -32.1
                                                                                                                         55
EBITDA                                                       96.2           82.9           +13.3         175.4
                                                                                                                         45
Adjustments1)                                                +3.4           +1.5             +1.9          1.7
                                                                                                                         35
Adjusted EBITDA                                              99.6           84.4           +15.2         177.1
                                                                                                                         25
Adjusted EBITDA-margin                                     61.3%          59.2%            75.6%         60.4%

   1) Adjusted for non-recurring costs related to acquisitions, restructuring and severance packages
                                                                                                                                                                       |8
Balance sheet                         30 June 21   31 Dec 20

 KEY FIGURES1) – Q2 2021                                                                                                    ASSETS
                                                                                                                            Freehold investment property             1 989.8     1 456.5
 (NOK million)
                                                                                                                            Leasehold investment property             455.7        515.2
                                                        Q2 21         Operational         Q2 20          FY 20
 P&L                                                                    change                                              Property, plant and equipment             146.3        122.5
 Revenue                                                    85.9              +14.3           71.7        293.3
                                                                                                                            Goodwill                                  187.3        184.6
 Total operating costs                                     -33.7                -5.0         -28.7       -117.9
                                                                                                                            Other non-current assets                     4.7         1.6
 Adjustments2)                                               2.2               +2.2            0.0           1.7
                                                                                                                            Total non-current assets                 2 783.8     2 280.5
 Adjusted EBITDA                                            54.5              +11.5           42.9        177.1
                                                                                                                            Financial instruments                       24.8        24.8
 Adjusted EBIT                                              50.0              +10.9           39.1        162.7
 Change in fair value of inv. property                       -0.4               -0.6           0.2          92.9            Other current assets                        39.0        30.4

 Change in fair value of lease property                    -12.5               +3.3          -15.8         -63.0            Cash and bank deposits                    143.2        246.8

 Net finance                                               -16.0                -2.1         -13.9         -45.1            Total current assets                      206.9        264.1

 Adjusted Pre-tax profit                                    21.0              +11.5            9.6        147.5             TOTAL ASSETS                             2 990.7     2 582.4
 Adjusted Net profit                                        15.5               +7.6            7.9        114.3
                                                                                                                            EQUITY AND LIABILITIES
 Current lettable area (thousands m2)                     163.3               +21.2         142.1         148.2
                                                                                                                            Total equity                             1 228.1     1 177.9
 Lettable area under development                            36.7               +7.0           29.7          30.4
 (thousands m2)                                                                                                             Long-term interest-bearing debt           930.9        519.4
 Cash flows                                                                                                                 Long-term obligations under finance       433.4        487.9
 Net cash flows from operating activities                   48.5               +8.9           39.6        176.6             leases

 Net cash flows from investing activities                -234.8              -210.9          -23.9       -263.8             Deferred tax liabilities                  129.7        114.6

 Net cash flows from financing activities                   67.4                -1.1          68.6        244.5             Other non-current liabilities                0.2         2.0

 Cash and cash equivalents at beginning                   261.7             +140.7          121.0           88.1            Total current liabilities                 268.3        280.6
 of the period
                                                                                                                            Total liabilities                        1 762.5     1 404.6
 Cash and cash equivalents at end of the                  143.2               -61.7         204.9         246.8
 period                                                                                                                     TOTAL EQUITY AND LIABILITIES             2 990.1     2 582.4

1)   Unaudited figures for 2021
                                                                                                                                                                                    |9
2)   Adjusted for non-recurring items of NOK 2.2 million in Q2 2021, NOK 0 million in Q2 2020 and NOK 1.7 million FY 2020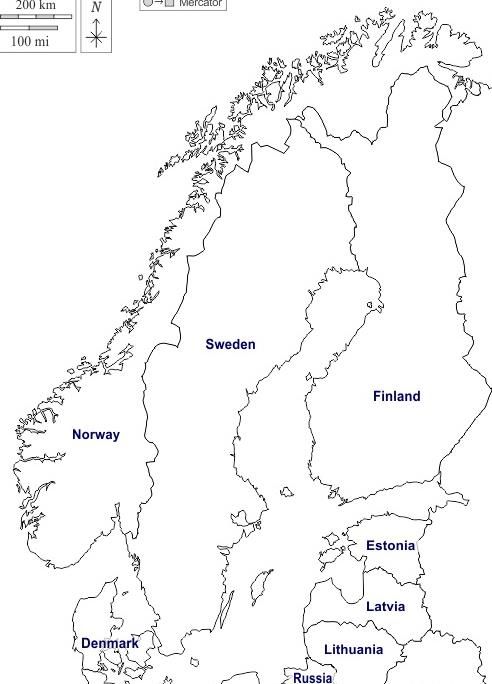
STEADY GROWTH IN SHARE OF FREEHOLD PORTFOLIO

DEVELOPMENT IN SHARE OF FREEHOLD FACILITIES                                              SHARE OF FREEHOLD FACILITIES PER CONCEPT

         200 000                                                                                 140 000
                                                                                                 120 000           29 200
         150 000                                                         30%                     100 000

                                                                                        CLA m2
CLA m2

                                                       49 000     63 200       82 300             80 000           41 800
         100 000                 21 700     35 100                                                                                                7 500
                      10 300                                                                      60 000
                                                                                                  40 000                                          40 500
             50 000   83 500     82 000     81 900     88 500     85 000       81 000                              59 200
                                                                                                  20 000
                                                                                                                                                  21 800
                 0                                                                                     0
                      31.12.16   31.12.17   31.12.18   31.12.19   30.12.20   30.06.21                                CSS                           OKM

                                 Leasehold       Freehold                                              Leasehold      Freehold      Under development

         •     SSG’s strategy is to expand its freehold facility base                      30.06.2021                 Current          Under         Total lettable
         •     50% of current lettable area in operation at the end of                     m2                      lettable area    development          area
               June 2021 was freehold
         •     Freehold m2 has increased with 30% since December 2020                      Freehold facilities             82 300         36 400           118 700
         •     69 of a total of 124 facilities in operation (56%) were
                                                                                           Leased facilities               81 000            300             81 300
               freehold as of June 2021
         •     SSG plans to accelerate growth and open 12 000-14 000                       SUM                           163 300          36 700           200 000
               m2 during 2021, mainly freehold

                                                                                                                                                                | 10
FREEHOLD INVESTMENT PROPERTY AS OF 30 JUNE 2021
-PROPERTY VALUE INCREASED BY 37% FROM DECEMBER 2020
Freehold portfolio Total freehold property of 1 990 MNOK
• 151 400 m2 gross area freehold property 2 500
1 990
• 16 000 m2 gross area greenfield development properties 2 000
1 457 +37%
• 19 500 m2 gross area land for containers
MNOK
1 500
1 075
• Approximately 65-70% of gross area is utilized as lettable area 1 000
525
• Intra group lease agreements at commercial terms 500 339
• External valuations conducted upon acquisition of new property, and -
once a year with quarterly assessment of indications of change 31.12.2017 31.12.2018 31.12.2019 31.12.2020 30.06.2021
Gross area pr region and yield1) as of 31.12.20 Development change in fair value over P&L
80 000 8% 110
Gross area m2
60 000 7% Yield 83.4
6%
40 000
5%
20 000 60
4%
MNOK
0 3%
Oslo and Eastern Southern Western Trøndelag Denmark 16.3
earlier Norway ex Norway Norway and 5.7 0.2 3.6 - 0.4
Akershus Oslo and Northern
10
earlier Norway
Akershus
Q1 20 Q2 20 Q3 20 Q4 20 Q1 21 Q2 21
Total gross area (m2) 2019 Total gross area (m2) 2020 Yield 2019 Yield 2020 -40
1) Net market rent divided on property value in full operation
| 11CURRENT LETTABLE AREA OF 163 300 M2 AS OF 30 JUNE 2021
– 36 700 M2 IN PIPELINE1)
1)
11 000 200 000 3 150 203 150
10 400
15 300
9 400 163 300
5 700
148 200
137 500
117 000
103 700
93 800
1) Potential lettable area of the option to acquire a neighbouring building at Billingstad is not included in the KPIs of Q2 2021. The option was
executed subsequent to Q2 2021 | 1236 700 M2 IN POTENTIAL LETTABLE AREA
CSS OKM Total SSG
▪ The potential m2 is mainly in freehold facilities in Norway
New facilities 11 200 6 300 17 600
▪ Rent income from expiring lease contracts from 10 400 m2 of the 36 700 m2 not yet
built into self-storage units
Expansions 18 000 1 200 19 200
▪ Plan to open 12 000-14 000 m2 during 2021 (organic) Sum 29 200 7 500 36 700
Area with other rentals 10 300 100 10 400
Current lettable area pr region2) Lettable area under development1)
North Norway
300 m2
Denmark;
27 900 m2
Sweden; East Norway/Greater Mid Norway
16 300 m2 Oslo; 90 500 m2
North Norway; 3 600 m2
2 400 m2
East Norway/ Greater Oslo
Mid Norway;
26 100 m2
4 800 m2 West Norway; West Norway
15 000 m2 Sweden
2 100 m2
100 m2
South Norway; Denmark
6 400 m2 4 500 m2
1) As of 30 June 2021
| 13REVENUE DYNAMICS Q2 2021
Lettable area (m2) Occupancy (%)1) Rent pr m2 (NOK) 1) Revenue2)
90% Target Potential Significant
occupancy upside to upside
10 400 Office-rental current rent potential
levels in existing
assets
Lettable not
26 300 yet opened Other
7.0
income
CLA for facilities
open more than
12 months: Current
163 300
154 500 m2
x 89.2 % occupancy
for facilities
open for
x 2 264
Current avg.
=
CLA in operation more than 78.9 NOK 85.9
rent level for
less than 12 12 months mature facilities million
months: 8 800 m2 reported
in Q2
2021
Potential due to increased
share of CSS-facilities and Strong revenue
Plan to increase with Occupancy at target
annual KPI-adjustment, but growth expected
12 000-14 000 m2 level
focus is on occupancy-growth going forward
CLA during 2021
and to fill up capacity
1) Average occupancy and rent pr m2 for sites with more than 12 months of operation in NOK
| 14
2) Numbers in NOK millionSTRONG LINK BETWEEN REVENUE GROWTH AND
ABSOLUTE GROWTH IN PRE TAX FREE CASH FLOW
High cash conversion business
Relatively stable but will increase with maintenance and
350 Property cost operation of new facilities
Will change if long-term contracts expire and are renegotiated
300
Lease cost to short-term contracts, new short-time contracts are signed,
293.3 (Short-term lease) or if short-term contracts are renegotiated to long-term
10%
contracts. New facilities are mainly freehold
250 266.5
Relatively stable. Some new central positions, but scalable
Wages & salary business model. New facilities are planned to be
200 unmanned
MNOK
Other costs Have proven very stable over last couple of years but is
150 (Other operating expenses and expected to increase some due to growth in revenue and
COGS) complexity of the company
5%
100
110.5 116.2
50
0
ZERO POSITIVE NORMAL
Maintenance CAPEX is Negative working capital Normal tax profile
FY 2019 FY 2020 basically zero leading to positive CF effect
from revenue growth
CAPEX WC Tax
| 15BUSINESS DEVELOPMENT Q2 2021
| 16SELF STORAGE GROUP AT A GLANCE
3 124 27 500
Countries Facilities Storage rooms
163 300 m2 36 700 m2 200 000 m2
Current lettable area Lettable area under Total lettable area
development
As of 30 June 2021
| 17UNTAPPED POTENTIAL FOR SELF STORAGE IN SCANDINAVIA
Scandinavia lagging in terms of self storage space per capita (sq.m.)
"Mature markets"
• Significant untapped potential in the
Scandinavian countries
0.872
• Awareness of self storage is still low
in Scandinavia
• The self storage market is growing across all
"European leaders" of Europe
“Immature markets”
• Urbanization is driving growth
0.163
0.068 • New building standards in Norway
0.052 0.048 0.047 0.028 require less storage space
Source: FEDESSA European Self Storage Survey 2020 and 2018, The SpareFoot Storage Beat, IBISWorld
| 18THE SCANDINAVIAN SELF STORAGE MARKET AT A GLANCE
Operators by number of facilities
Country (FEDESSA 2020) Comments
▪ SSG is the leading self-storage
103 provider in Norway with 107
71 facilities as of June 2021
38 ▪ Fragmented with a number of small
15 local operators
11 7
▪ Most immature market in
Other Scandinavia
brands
114 ▪ More competitive, presence of large
multinational operators
▪ A large number of small and “locally
36
23 15 focused” companies
12 6
▪ SSG is a regional operator with 6
Other facilities in Stockholm
brands
▪ One large operator with nationwide
66 presence
58
▪ SSG has the 2nd largest geographic
footprint with 11 facilities as of June
2021 following the acquisition of Dit
11 11 10 6 Pulterkammer
Other ▪ Presence of large multinational
brands operators in Copenhagen
Source: Company information, FEDESSA European Self Storage Survey 2020
| 19SUCCESS FACTORS IN SELF STORAGE
Scale Brand Awareness
Customer Service Location
Share of
IT / Automation
Freehold Facilities
| 20SSG CONSISTS OF TWO DISTINCT BUSINESS CONCEPTS
City Self-Storage OK Minilager
High-end brand providing self-storage rental and ancillary Countrywide, discount-priced offering of self-serviced
products and services in Scandinavia’s larger cities storage facilities in Norway
▪ 471) temperate storage facilities across ▪ 771) facilities located across Norway
Scandinavia ▪ 48 temperate storage facilities and 29
▪ One of the leading self-storage drive-in storage facilities
providers in the Scandinavian market ▪ 2nd largest player in Norway, behind
▪ Located in Greater-Oslo, Stavanger, CSS2
Trondheim, Stockholm, Copenhagen ▪ Self service, open 24 hr/day and 7 days
56 800 16 300
and the Jutland area in Denmark a week
▪ 101 000 m2 CLA (41 800 m2 is ▪ 62 300m2 CLA (40 500 m2 is freehold)
freehold) 27 900
1) As of 30 June 2021
2) According to revenue | 21A LARGE, DIVERSIFIED AND INCREASINGLY LOYAL
CUSTOMER BASE SECURING STABLE INCOME STREAMS
Customer split 1) Average rental time per customer 1) 2) Age of our customers 1) 3)
%
20 80
12
30
The customers % 20
% 10
Private customers months 0
Business customers
Households Businesses
Reasons for ▪ Moving ▪ Inventories
▪ Refurbishment ▪ Relocation
demand ▪ Downsizing ▪ Refurbishment
▪ Need for additional storage ▪ Archived records
▪ Student storage ▪ Last mile storage
▪ Other ▪ Other
1) The numbers are approximate
2) Average rental time is longer than 12 months as customers who have not yet terminated the lease is not included in the average | 22
3) The data is based on customer surveys on selected facilitiesA DIGITAL CUSTOMER JOURNEY
▪ SSG´s digital business model is highly scalable
▪ A new and fully automated online booking
plattform with e-signing (BankID) and integrated
credit check is implemented for OK Minilager. The
plattform will be rolled-out for City Self Storage
during 2021 and 2022
▪ App-based access system
▪ Self-Service portal
▪ Omni-channel service
▪ Webshop for moving- and storage products
▪ SSG will continue to innovate on the World´s #1
CRM platform
Some of the digital solutions are currenly only available in segments of the Group
| 23DEVELOPMENT PIPELINE
Greenfield development projects
Facility Location Status Potential total Expected1 Concept
CLA (approx.) opening
Oslo Landmark location with Construction in progress. Fit-out installations
Breivollveien 25 unique visibility will start in Q3 2021 5 000 m2 Q4 2021
Oslo Property south of Construction of the building is complete. Fit-
Bjørnerudveien 10 Oslo with significant out is currently being installed 2 400 m2 Q3 2021
catchment area
Trondheim Highly visible property Construction in progress. Fit-
John Aaes vei 40 with easy access from out installations will start in Q3 2021 3 500 m2 Q4 2021
main roads
Breivollveien - illustration Breivollveien - construction in progress John Aaes vei - illustration John Aaes vei - construction in progress
1The potential lettable area will be opened in phases
| 24DEVELOPMENT PIPELINE
Selected conversion/expansion projects
Facility Location Status Total CLA CLA in Remaining Concept
Potential operation CLA
potential1
Oslo Located at Skøyen, an Self storage fit-out is constructed on
Hovfaret 11 attractive commercial hub three floors of this 6-floor building. 3 300 m2 1 300 m2 2 000 m2
with a significant Next phase is planned to open during
catchment area Q3 2021
Oslo Highly-visible property in Planning under progress. Estimated to
Ulvenveien 28 a larger development area open first phase during 2022 2 500 m2 N/A 2 500 m2
Oslo Close to the city centre of Planning to convert parking space into
General Birchs Oslo with a significant self storage will start in 2021. 8 100 m2 4 300 m2 3 800 m2
gate 16 catchment area Conversion will be done in phases.
1The potential lettable area will be opened in phases | 25ACQUISITION OF DIT PULTERKAMMER CLOSED 14 APRIL 2021
Dit Pulterkammer acquisition
▪ Acquisition of regional player Dit Pulterkammer (“DPK”) at DKK 102m (approx. NOK 139m[1]) and financed with SSG’s
existing bank facilities
▪ The acquisition of DPK represents a significant step to expand SSG’s operations in Denmark
▪ The combined Danish operations of SSG and DPK will create a national player with presence in Copenhagen, Aarhus and
Odense and the number two player in terms of number of facilities in Denmark.
Growing SSG into one of only two
Dit Pulterkammer in numbers nationwide players in Denmark[3]
# of facilities in Denmark
5 DKK 14.0m DKK 6.7m
(NOK 19.1m) (NOK 9.2m)
Existing facilities 66
Revenue 2020[1][2] EBITDA 2020[1] 53
11 11 11 10
9 400 m2 2 050 m2 6.6%
Current self storage Identified expansion
Current EBITDA yield Other
lettable area potential area
+ brands
[1] DKK : NOK of 1.3658
[2] Self storage rental revenue contributed approx. DKK 12.3m in 2020. | 26
[3] Currently only Nettolager has a nationwide presence in Denmark.ACQUISITION OF PROPERTY IN NORDRE FOLLO
▪ Property with a potential lettable area of 1 500 m2,
located at Langhus in Nordre Follo.
▪ Langhus is approx. 15 minutes south of Oslo with
easy access from E6
▪ A growing region with limited supply of self storage
▪ The facility will open during the summer of 2021
▪ The transaction has a property value of NOK 25
million, and was closed on 16 April 2021
▪ The facility will be operated under the City Self-
Storage brand
| 27ACQUISITION OF PROPERTY IN HØNEFOSS
▪ Property with a potential lettable area of 600 m2,
located in Hensmoen, just outside of Hønefoss
▪ Hønefoss is approx. 1 hour north/west of Oslo with
Easy access from E16
▪ The location is highly compatible with our existing
facility in the region
▪ The facility opened in July 2021
▪ The transaction has a property value of NOK 5.3
million, and was closed on 18 May 2021
▪ The facility will be operated under the OK
Minilager brand
| 28SSG HAS A STRONG PLATFORM FOR FUTURE GROWTH
Focus on organic growth in Greater Oslo.
Strengthening the position of both the
CSS and OK Minilager brands in the
region
Prime locations in all
Scandinavian capital cities
Focus on larger urban areas in Norway
Strategy to expand into
new urban areas in
Norway
Potential to enter 30+ smaller markets
with population of 10 000<
Country-wide offering
with presence in Oslo,
Growth potential within existing smaller
Bergen, Trondheim, markets
Stavanger and 36
other cities and towns
across Norway
Opportunity for M&A in selected
markets
| 29STRATEGIC SUMMARY
• Grow our freehold portfolio in selected urban markets
• Focus on the larger urban areas in Norway
• Occupancy target of 90%
• Investments in CRM, automation and digital platforms
• Continue to include sustainability as an integrated part of
the business
• Creating great customer experience
• Lean operation and self-service
• Opportunistic approach to expansion in Sweden and
Denmark
• Looking to selectively acquire existing self storage
providers in the Nordics
Illustration of a greenfield project developed under the CSS brand
| 30Disclaimer
The information included in this Presentation contains certain forward-looking statements that address activities, events or
developments that Self Storage Group ASA (“the company”) expects, projects, believes or anticipates will or may occur in the
future. These statements are based on various assumptions made by the Company, which are beyond its control and are subject to
certain additional risks and uncertainties. The Company is subject to a large number of risk factors including but not limited to
economic and market conditions in the geographic areas and markets in which Self Storage Group is or will be operating,
counterpart risk, interest rates, access to financing, fluctuations in currency exchange rates, and changes in governmental
regulations. For a further description of other relevant risk factors, we refer to the Annual Report for 2020 for Self Storage Group
and updated risk evaluation in the interim report for Q2 2021. As a result of these and other risk factors, actual events and our
actual results may differ materially from those indicated in or implied by such forward-looking statements. The reservation is also
made that inaccuracies or mistakes may occur in the information given above about current status of the Company or its business.
Any reliance on the information above is at the risk of the reader, and Self Storage Group disclaims any and all liability in this
respect.
Self Storage Group ASA Contact info:
Karenslyst Allé 2 Cecilie Brænd Hekneby (CFO)
0278 Oslo +47 992 93 826
Norway cehe@selfstoragegroup.no
| 31Appendix
| 32SSG LISTED ON OSLO STOCK EXCHANGE SINCE 27.10.2017
Largest shareholders Share development last 12 months
Holding % Name Country
1 20 937 078 24,8 % UBS Switzerland AG 1) Switzerland 32.00
2 9 565 000 11,3 % FABIAN HOLDING AS Norway 30.00
3 6 565 000 7,8 % CENTRUM SKILT AS Norway
28.00
4 4 881 537 5,8 % VERDIPAPIRFONDET ODIN EIENDOM Norway
5 3 737 072 4,4 % J.P. Morgan Bank Luxembourg S.A. Sweden 26.00
6 3 623 214 4,3 % J.P. Morgan Securities LLC United States 24.00
7 3 279 790 3,9 % SKAGEN M2 VERDIPAPIRFOND Norway
8 2 600 000 3,1 % FIRST RISK CAPITAL AS Norway
22.00
9 2 251 276 2,7 % Citibank, N.A. Ireland 20.00
10 2 038 255 2,4 % HSBC Bank Plc United Kingdom
11 1 652 048 2,0 % SOLE ACTIVE AS Norway
12 1 641 428 1,9 % Danske Invest Norge Vekst Norway
13 1 600 000 1,9 % VERDIPAPIRFONDET HOLBERG NORGE Norway
14 1 298 602 1,5 % MUSTAD INDUSTRIER AS Norway Shareholder structure
15 1 216 455 1,4 % BNP Paribas Securities Services France
16 1 159 486 1,4 % BNP Paribas Securities Services Luxembourg
17 1 016 072 1,2 % Brown Brothers Harriman & Co. United States
18 975 000 1,2 % Citibank, N.A. Ireland
19 870 295 1,0 % Société Générale France
Founders
20 810 000 1,0 % ODIN Small Cap Sweden 19.1 %
71 717 608 85,0 %
International Norwegian
shareholders shareholders
52.9 % 28.0 %
Total number of shares: 84 328 584
As of 17 August 2021
1) Alta Lux Holdco S.a.r.l/Centerbridge Partners
| 33DEVELOPMENT OCCUPANCY & AVERAGE RENT PER MONTH
Development in occupancy*
100%
95% 91.0 %
89.3 %
90% 85.3 % 86.6 % 87.4 % 85.3 % 85.9 % 86.5 % 85.7 %
84.8 % 83.4 % 84.5 % 84.6 %
85% 81.9 % 81.5 % 81.4 % 81.4 % 81.9 %
2020
80%
75% 2021
Development in average rent per year*
2 500
2 400 2 399 2 373 2 356 2 333
2 300 2 266 2 303 2 321 2 315 2 312 2 311 2 320 2 325
2 257 2 291 2 267 2 273
2 281 2 253
2 200
2020
2 100
2 000 2021
1) Average occupancy and rent pr m2 for sites with more than 12 months of operation in NOK
| 34EBITDA-DEVELOPMENT
(NOK million)
BRIDGE Q2 2020-Q2 2021
70
60 4.6 1.4 - 0.5 - 0.1 0.2 - 0.1 - 2.0
8.3 - 2.9 2.8 54.5
50 42.9 -
40
MNOK
30
20
10
0
| 35PROFIT BEFORE TAX DEVELOPMENT
(NOK million)
BRIDGE Q2 2020-Q2 2021
30
25 14.3 -5.0
1.1
3.3 -3.2
20 -0.6 18.8
-0.6
MNOK
15
9.6
10
5
0
| 36SECOND QUARTER 2021
COMPREHENSIVE INCOME
Profit and loss statement Comments
▪ Revenue for Q2 2021 was NOK 85.9
million, up from NOK 71.7 million in
Q2 2020. The increase is related to the
growth in lettable area and rentals and
new revenue from Dit Pulterkammer
▪ Operating profit before fair value
adjustments in Q2 2021 of NOK 47.7
million, an increase of NOK 8.7 million
compared to Q2 2020. The growth in
lettable area and rentals simultaneous
with stable costs impact the figures. In
addition, operating profit from Dit
Pulterkammer impact the figures
▪ In total non-recurring items amounted
to NOK 2.3 million in Q2 2021 and
NOK 1.5 million in Q2 2020
▪ The fair value of investment property is
based on external valuations for
freehold investment property and value
adjustment due to passage of time for
leasehold investment property
| 3730 JUNE 2021 – FINANCIAL POSITION
Financial position Comments
▪ Total assets of NOK 2 991million
▪ Freehold investment property increased
with NOK 533.3 million and leasehold
investment property decreased with NOK
59.5 million since 31 December 2020
▪ Cash and bank deposits decreased with
NOK 103.6 million since 31 December
2020, mainly due to on acquisition of
subsidiaries and investment property
exceeding net borrowings drawn up in Q1
2021
▪ Increased equity through result for the
period
▪ Negative net interest-bearing debt was
NOK 925.3 million in the balance as of
30 June 2021. Decreased obligations
under financial lease with NOK 59.2
million due to acquisition of an existing
leasehold agreement on the premises,
lease payments in the first half year 2021,
and translation differences. The decrease
is partly offset by two options assessed
reasonably certain to exercise
▪ Equity ratio was 41% 30 June 2021
| 38SECOND QUARTER 2021 – CASH FLOW
Condensed consolidated statement of cash flows
Comments
Operating activities
▪ Strong cash flow
▪ Invoicing of customers in advance – predictable and stable
costs
Investing activities
▪ Acquisition of Dit Pulterkammer and two other properties
with cash in Q2 2021
▪ Development of properties, additions to existing properties
and fit out new facilities and expansions
▪ Maintenance is posted as property cost
Financing activities
▪ Drew up NOK 100 million on a revolving credit facility in
Q2 21
▪ Net of proceeds and repayments of borrowings amounting
to NOK 37.7 million
▪ Payment of lease liabilities and payments of lease classified as
interests amounting to NOK -15.3 million
SSG’s cash position at the end of June 2021 was
NOK 143.2 million
| 39OUR HISTORY
1993 1998 2009 2016 2017
•First CSS site established in •Selvaag Group entered into •OK Minilager was established •External investors invested in •SSG established
Norway, investment in “Safe the business and CSS by Gustav and Fabian Søbak OK Minilager •Listed on OSE
Mini Lager” in Sweden expanded to Denmark •OK Minilager acquired CSS
2017 2018 2019 2020 20212)
Private 100 MNOK 250 MNOK
placements1) 200 MNOK
Acqusition of
companies (9 facilities)
(4 facilities) (5 facilities)
(4 facilities)
Acqusition of
properties
10 11 8 9 4
1) Gross proceeds
2) As of June 2021 | 40You can also read