Australian National University, Feb 24 2016 Presentation by Dr Michael Smith (ANU) - An A2SE Industry collaboration with research partners
←
→
Page content transcription
If your browser does not render page correctly, please read the page content below
An A2SE Industry collaboration with research partners:

Australian National University, Feb 24 2016 Presentation by
                  Dr Michael Smith (ANU)
COAG National Energy Productivity
Roadmap

http://www.2xep.org.au/
1. A new productivity & innovation reform agenda
2. Quantifying how innovations in energy productivity
unlock labour, capital productivity gains by sector.
3. Innovation/Tech - Mapping + Better Knowledge Sharing
of new EP innovations available internationally and locally
4. Review of EP potential through transforming
production-consumption systems (supply chain industrial
ecology)
5. What is Technically Possible? Is Tripling EP by 2030
Possible & Needed to Stay Under 1.5/2 Degrees?
6. Post Paris COP - Energy efficiency is critical to achieving
1.5 degree target – ie Importance of energy efficiency
targets.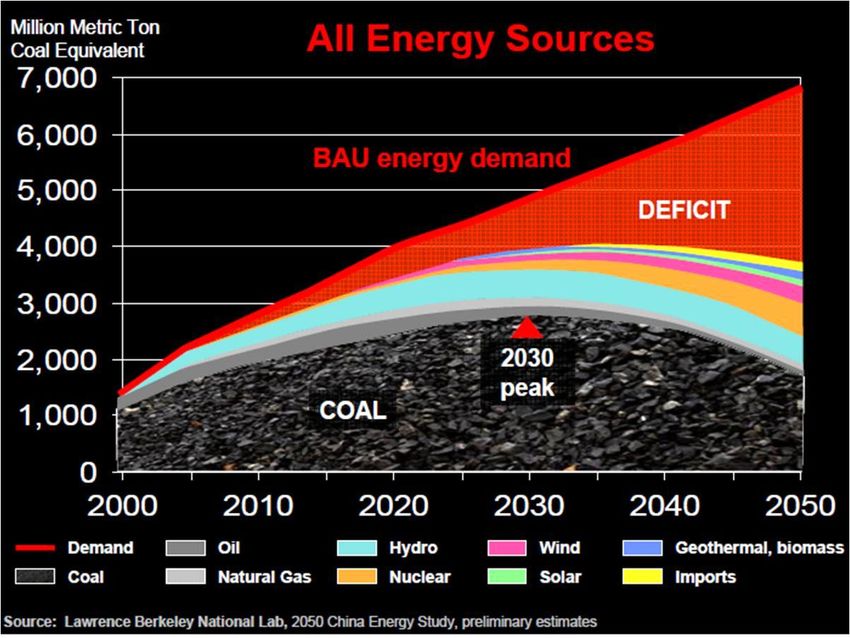
- How government can build partnerships with the private sector and civil society to
  work together to lead a new wave of innovation to achieve low carbon
   efficient sustainable cities.
http://www.naturaledgeproject.net/NAON_ch17.aspx#one
First Industrial Revolution – 10+ X Increase in EP
Virtuous cycle driving and underpinning
Efficiency of energy technologies,
economic growth. (Ayres et al, 2006)
1500-2000 (Source: Fouquet (2008),
cited in Smith (2014,2015)
Heat, Power and Light, E. Elgar Publishing, UK)
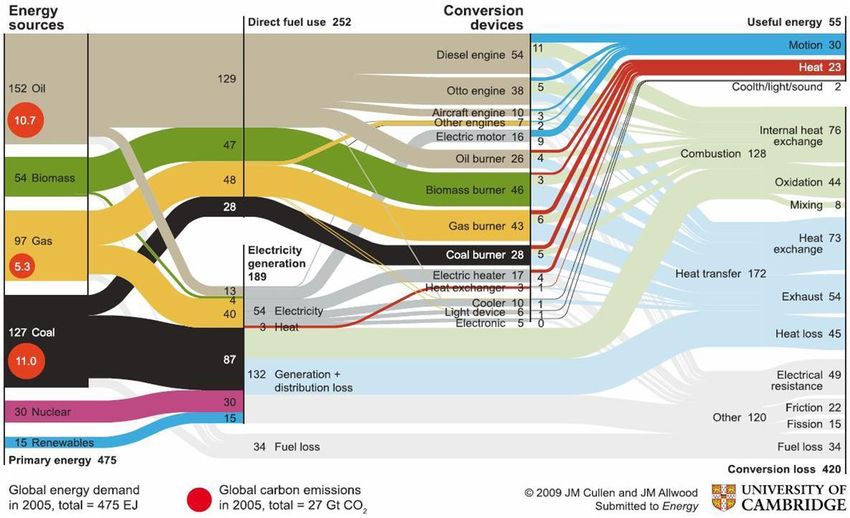
1. Large scope for EP: 88% waste!

                               Useful
Mine/Harvest (EE)
  Fuel price
                      Transport (EE)              G
                                                  E
  Wholesale       Conversion (eg refine,      S   N
 energy price    generate electricity) (EE)   T   E
                                              O   R
                   Deliver to consumer        R   A
                  (pipeline, ship, truck,     A   T
Retail energy                                 G   I
                   power line etc) (EE)
    price                                     E   O
                 On-site distribution (eg
                                                  N
                  meter, wires, pipes,
                      storage) (EE)
                On-site energy consuming
                     equipment (EE)
Consumer cost
  of service        Service delivered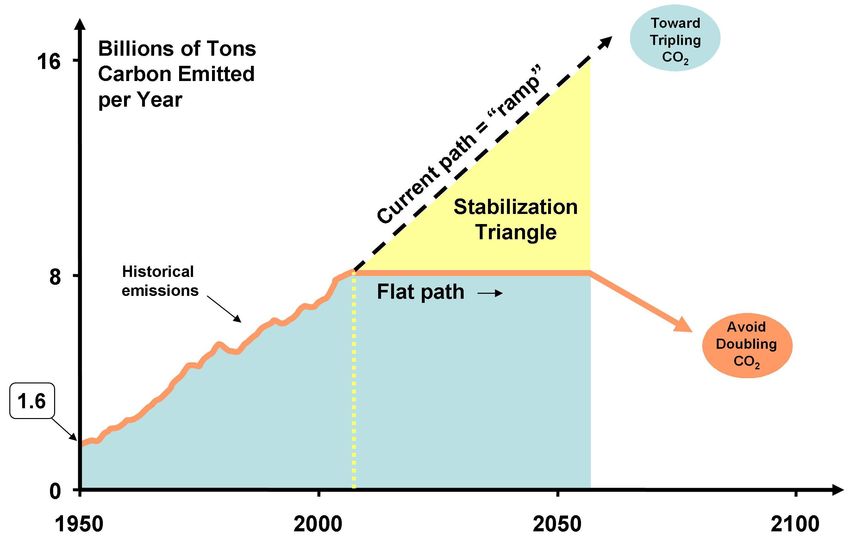
Can Australia Triple Energy Productivity
By 2030? Our Competitors are….

      California’s Energy Productivity 1.7 times Australia’s.
      •California’s electricity grid services twice Australia's
       population & an economy 50% larger, but only
       generates slightly more daily electricity than Australia.

      •The per capita carbon footprint of California's
        electricity sector is also ½ that of Australia's.
From IEA Energy and Climate Change presentation, London June 15
Years   USA GDP     Chinese     Japanese    German      Australia
        (US$        GDP (US$    GDP (US$    GDP (US$    GDP (US$
        Billions)   Billions)   Billions)   Billions)   Billions)

                                                        41 (18,
1970    1075.9      89.6        209.1       215
                                                        1960)

1980    2862.5      302.9       1087        946.7       140

1990    5979.6      396.6       3103.7      1764.9      407

2000    10284.8     1208.9      4731.2      1950        669

2010    14964.4     6005.4      5498.7      3417.1      1,141 billion

                                                        1554.68
                                                        billion
2015    17348.1     10430.6     4602.4      3868.3
                                                        (1700-1800
by 2020) Energy efficiency could cumulatively add ~US$18 Trillion to GDP by 2035
above BAU & cut energy supply capital investment requirements & fuel
costs by US$7 Trillion each + congestion +air-pollution. (IEA World Energy
Outlook+ 6 other studies)
Water productivity measures, that also save energy and cut emissions, to
add $2-4 Trillion cumulatively to GDP Growth by 2030: Reducing urban
water leakage globally could add US$165 Billion to GDP per annum by 2030
whilst water efficiency globally adds ~ US$120 Billion per annum to global
GDP by 2030. (New Climate Economy, 2014 + McKinsey + other studies)
Circular Economy – Improving Resource Productivity in ways that improve
energy efficiency and cut emissions - to add $5-7 Trillion cumulatively to
GDP Growth by 2030.
Doubling Rate of Renewable Energy Investment to Double Renewable
Energy Capacity by 2030 - $1.2 Trillion per annum by 2030 (IRENA, 2016)
Smith, M (2015) Doubling Energy and Resource Productivity by 2030 @ http://www.2xep.org.au/doubling-
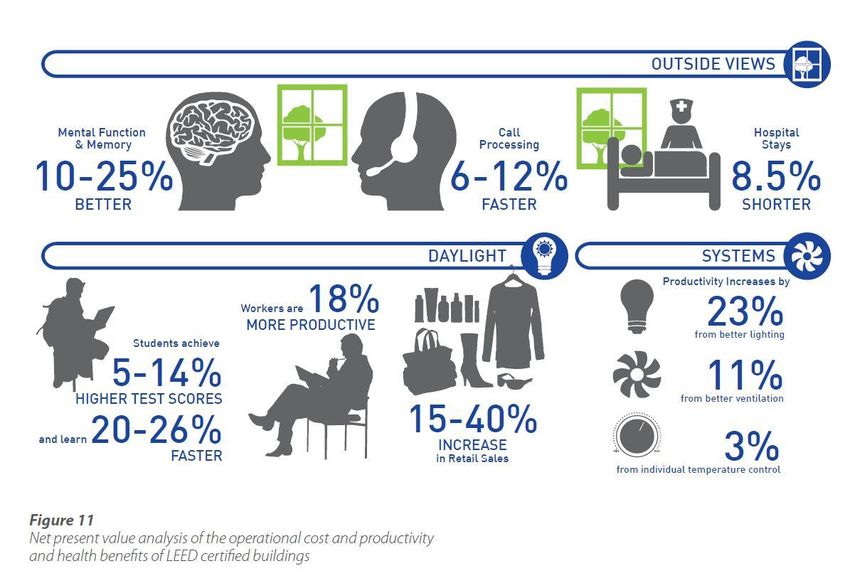
energy-and-resource-productivity-by-2030.html 2. Energy Productivity investments also enhance traditional
measures of productivity in a myriad of ways. For instance,
Labour Productivity (LP) – Newer, more energy and resource efficient
equipment often provides labour productivity co-benefits. Also
energy efficient “green buildings”, which have better quality
lighting, air and reduced indoor air pollution increases LP.
Improving energy productivity can also lead to jobs growth and
greater labour participation which also boost LP.
Capital Productivity (CP) - Investment in energy productivity can
improve capital productivity by providing a quicker return on
investment (through the operational energy cost savings), improving
capital asset values and thus the contribution of capital assets to
the value of the business.
Multi-Factor Productivity (MFP) - Improving energy productivity
directly correlates closely with improving MFP.
Smith, M (2015) Doubling Energy and Resource Productivity by 2030 @
http://www.2xep.org.au/doubling-energy-and-resource-productivity-by-2030.htmlhttp://www.2xep.org.au/
Productivity Co-benefits of Energy Efficiency/Energy Productivity.
Production Efficiency to     Working Environment       Other Productivity Benefits
Improve Labour Productivity Improvements to Improve
                             Labour productivity
Increased product            Reduced heat stress       A more innovative workplace
output/yields
Faster rates of production / Reduced need for personal Improved energy/water efficiency
product output               protective gear           of products to build market share
Improved equipment                Improved lighting              Delaying or reducing capital
performance                                                      expenditures
Shorter process cycle times       Reduced noise levels           Improved public image
Improved product quality/purity   Improved temperature control   Decreased liability and insurance
Reduced Inputs and Waste          Reduced Emissions and          Improved Rates of Operation
Costs                             Related Costs
Use of waste fuels, heat, gas     Reduced dust emissions    Reduced need for engineering
                                                            controls
Reduced product waste             Reduced CO, CO2, NOx, Sox Lowered cooling requirements
                                  emissions
Reduced water use                 Reduced Maintenance Costs Increased facility reliability
Materials Reduction               Equipment upgrades reduce Reductions in labour
Resources Sector - Energy Productivity – Labour
Productivity Co-benefits
BHPBilliton announced in 2012 that it would move to truckless
mines by investing in “in-pit crushers and conveyors”(IPCC) to
address rising operational costs from labour /diesel/carbon. IPCCs
are much more energy efficient than haul trucks. “'When you run a
truck, it takes 10 to 11 employees for every truck. ...If you go
autonomous you get rid of half of those. If you go truckless, (and
invest in IPCCs), you get rid of all of them. You do this at a time
when you see increasing diesel prices, carbon taxes, a number of
reasons why getting rid of trucks or using fewer trucks is
desirable.'‘...From IEA Energy and Climate Change presentation, London June 15
From IEA Energy and Climate Change presentation, London June 15 2015
Pacala and Socolow (2004) Stabilisation Wedges. Science at
http://www.princeton.edu/mae/people/faculty/socolow/Science-2004-SW-1100103-PAPER-AND-SOM.pdf
Socolow and Pacala’s Stabilisation           Underestimated the potential
              Wedges                       of energy efficiency to contribute to
                                                   cutting emissions.

(1) Efficient Vehicles – Double Fuel        (10) Wind – 2 million MW (50 times
Efficiency                                current)
(2) Reduced Use of Vehicles – By Half (11) PV – 2000 GW (700 times current)
(3) Efficient Buildings and Appliances – (12) Wind generated hydrogen – to
Cut GHGs by ¼                           power hydrogen fuel cell cars.
(4) Efficient Base-load Coal Plants –      (13) Biomass for fuel – 100 times
Double Conversion Efficiency to 60%       current Brazil and US cropland
(5) Replace inefficient coal plants with   (14) Reduced deforestation, plus
gas plants (four X the current            reforestation, afforestation, and
production of gas-based power)            new plantations
(6-8) Carbon Capture and Storage (3       (15) Conservation Tillage
wedges)
(9) Nuclear Power – Double Current
Global Output
Additional Stabilisation Wedges – End Areas of Large Potential for Rapid
Use Energy Efficiency by 2030 Greenhouse Gas Reductions
#1 – Residential and Commercial Buildings. #8 Reducing Urban Sprawl - Whilst using
Retrofit lighting, appliances, office equipment. low embodied energy building materials
#2 – Industry - Upgrade Motor Driven #9 Energy/Water Efficiency Opportunities
Technologies to cut global electricity use by – Reduce urban water leakage, improve
10%. urban water efficiency
#3 - Investment In Co-generation - avoids the #10 Circular Economy - Product
need for 10% of new generation by 2030 saving Stewardship, Materials Efficiency and
$950 billion per annum by 2030. (IEA,2011) Recycling.
#4 – Energy Efficient Street Lighting – Shift to #11 Product Design Standards - to be
efficient lighting could save up to $650 Billion more energy/water efficient
#5 – Transition to More Efficient Transport #12 Reduce Global Food Waste in half.
Options: ~40% trips in OECD cities areValues, social and
technological context
Anthropogenic
Useful
Choice of Systems
service/
Technologies Design
need.
Biomimetic
MATERIALS ENERGYMine/Harvest (EE)
Fuel price
Transport (EE) G
E
Wholesale Conversion (eg refine, S N
energy price generate electricity) (EE) T E
O R
Deliver to consumer R A
(pipeline, ship, truck, A T
Retail energy G I
power line etc) (EE)
price E O
On-site distribution (eg
N
meter, wires, pipes,
storage) (EE)
On-site energy consuming Other inputs, eg
equipment (EE) chemicals, water
Consumer cost
of service Service deliveredStep 1: minimise energy input per unit of useful work output generated Zeobond cement 30 Source: The Zeobond Group (n.d.)
Chemicals Industry – Redesigning Reactions along Green
Chemistry Principles.
Argonne National Labs has developed new non-toxic,
environmentally friendly ‘green solvents’ to replace the millions
of toxic solvents currently used in industry. The new process
makes low-cost, high-purity ester-based solvents, such as ethyl
lactate, using advanced fermentation, membrane separation,
and chemical conversion technologies. Overall, the new process
uses 90 % less energy and produces ester lactates at about 50
% of the cost of conventional methods.
NTEC Versol Inc - selling these in the US under trademarks
Versol and Versol Gold.
Argonne National Lab (1998) ‘Green Solvent Process Gets Presidential Honor’, Argonne News.
Available at www.anl.gov/Media_Center/Argonne_News/news98/an980629.html.Embodied energy in new build could use up 30-60% of the remaining global carbon budget by 2050 – if new buildings are built with traditional high embodied energy cement, steel and aluminium 32 RMIT
http://www.laros.com.au/our-projects/
Australian Buildings Can be 50-80% more energy efficient
for heating and cooling

           Legal minimum in
           many countries

                2011 building
                code
                  2005 building
                  code

                              Typical
                              1990s home
           Many pre-
           1990s
           homes
Annual electricity use for some activities in an Australian home:
existing stock; best available now; and possible future
4000 STOCK BEST NOW POSSIBLE
3500
Kilowatt-hours per year
3000 Many households are also installing
2500 on-site and local renewable energy
Building generation and smart management
2000 + equipment systems – and next, storage
1500
1000
500
0EP Potential in Transport
IEA/OECD – has found that demand for transport fuels
could be halved by 2030.
http://www.euractiv.com/energy-efficiency/iea-transport-fuel-use-halve-203-news-514919
Source – Peter Newman – TED Talk – SustainabilityInnovations Enable A Step Change in EP:
Energy/Transport/Building Sectors
• Buildings - 50-80% more efficient
• Innovations in High Density Living and
Compact Transport Options
(https://www.ted.com/talks/kent_larson_brilliant_designs_to_fit_more_people_in_every_ci
ty?language=en )
• Smart control innovations for LED
lighting cut energy by a further 50%
• Solartube lighting - http://solatube.com.au/
• Solar PV panel, wind & energy storage
innovations to help Australia replace
existing energy supply infrastructure by
2050 (http://www.teslamotors.com/powerwall)
(http://reneweconomy.com.au/2014/pumped-hydro-the-
forgotten-storage-solution-47248)
• Transport demand management
innovation
• Electric vehicle (2,3,4 wheeler)
innovations
• Electric scooters on track to reach100
million by 2018 in Asia
http://www.navigantresearch.com/newsroom/electric-scooters-in-asia-pacific-will-
increase-nearly-tenfold-from-2012-to-2018EP Potential in Transport
IEA/OECD – has found that demand for transport fuels
could be halved by 2030.
http://www.euractiv.com/energy-efficiency/iea-transport-fuel-use-halve-203-news-514919
Source – Peter Newman – TED Talk – SustainabilityInnovations can enable a Step Change
in EP in the Mining Sector.
• Technologies to improve ore characterisation (UQ,
CRC Ore)
• Smart blasting - ultra-high intensity blasting (up to
40% improvement) (Orica – CEEC Medal, 2014)
• Energy efficient materials movement (eg IPCC)
• Energy efficient comminution tech innovations
• Flexible mill circuit design
• Onsite renewable energy and co-generation (>20
R&D renewable projects re mining with ARENA)
• Long term – Prof Jamieson (University of
Newcastle) – innovations in froth floatationWhat’s Next
Our ‘need’ for energy is derived from ‘needs’ for services like nutrition, shelter,
entertainment, economic output etc
Recent innovation has dramatically increased the range of options to satisfy
‘needs’ instead of traditional energy systems
These involve integrated use of combinations of:
◦ More efficient energy and resource use
◦ Smart management of demand
◦ Storage of energy in many forms (heat, coolth, electricity, chemical, gravitational
potential, movement)
◦ Distributed energy production or conversion
◦ Innovative reframing of what our needs are (eg virtual solutions)
Costs of many emerging energy options are falling due to:
◦ Rapid innovation from many directions and ‘learning by doing’
◦ Capture of economies of scale from flexible mass production
Distributed solutions that seem to have higher costs can be cheaper overall
because they avoid/reduce losses and costs in the supply chain and offer non-
energy benefitsWhat is the energy and resource efficiency technical potential of systems? Is it possible to deliver the same or better services whilst using 70-80% less energy? If so, How? What policy measures are needed?
Stadler, A., Jutsen, J., Pears, A., & Smith, M. (2014). 2xEP: Australia's energy productivity opportunity.
Australian Alliance to Save Energy http://a2se.org.au/files/2XEP_Foundation.pdf
IEA (2012) World Energy Outlook. IEA
International Energy Agency. (2014). Capturing the multiple benefits of energy efficiency: Roundtable
on industrial productivity and competitiveness (Discussion Paper). Paris: Author.
http://www.iea.org/media/workshops/2014/eeu/industry/IEA_Industrialnonenergybenefitsbackgrou
ndpaper_FINAL.pdf
ClimateWorks Australia (2015) Australia’s Energy Productivity Potential. CWA. Monash University.
Smith, M. (2014, 2015 updated). Green growth: Unlocking new sources of productivity, profits and
growth in the 21st century. Sydney: United States Studies Centre, University of Sydney Email -
michaelh.smith@anu.edu.au
Smith, M. (2014, 2015 updated). Green growth: Doubling Energy and Resource Productivity by 2030 –
A How to Guide for Policy Makers . Sydney: United States Studies Centre, University of Sydney Email -
michaelh.smith@anu.edu.au
Smith, M. (2014, 2015 updated). Green growth: Improving Business Productivity and Competitiveness.
Sydney: United States Studies Centre, University of Sydney Email - michaelh.smith@anu.edu.au
Smith, M (2014) Energy and Resource Productivity - Direct Action that Could Save the Global
Economy. Sydney Morning Herald. http://www.canberratimes.com.au/national/public-
service/energy-and-resource-productivity-direct-action-that-could-save-the-global-economy-
20140901-3en76.html
Smith, M. Hargroves. K. Desha, C (2010) Cents and Sustainability - Securing Our Common Future by
Decoupling Economic Growth from Environmental Pressures. Routledge. London
Stasinopoulos, P. Smith, M et al (2010) Whole of System Design. UNESCO, WFEO, TNEP at
http://www.naturaledgeproject.net/whole_system_design.aspxYou can also read