Greening the U.S. House of Representatives
←
→
Page content transcription
If your browser does not render page correctly, please read the page content below
Greening the U.S. House of Representatives
Rick Diamond and Christopher Payne, Lawrence Berkeley National Laboratory
Grant Scherling, Office of the Chief Administrative Officer,
U.S. House of Representatives
ABSTRACT
The Greening the Capitol initiative was launched in March, 2007 with the threefold goals
of making the U.S. House of Representatives: 1) carbon neutral within 18 months, 2) reducing
energy use by 50% in ten years, and 3) becoming a model of sustainable operations. We report
on the recommendations to meet these goals, looking at the targets of opportunity at the Capitol
Power Plant, the existing buildings, and the overall operations of the complex. Our findings have
shown that these goals are achievable, and that through an integrated approach the savings in
carbon and energy can be met. Specific examples include the lighting retrofits in the House
offices, parking areas, and the Capitol dome, the retrofits to the HVAC systems and controls,
including duct sealing, improving the efficiency of the energy and water use in the food service
areas, and improved operations of the steam and chilled water distribution system. A key aspect
has been better tracking and feedback to the building operators of the actual energy consumption.
We report on the technical opportunities presented by these historic and symbolic buildings in
becoming models of sustainability.
Introduction
On March 1, 2007, Speaker Nancy Pelosi and Majority Leader Steny Hoyer, of the U.S.
House of Representatives, directed the Chief Administrative Officer of the House to develop
recommendations “to provide an environmentally responsible and healthy working environment
for the U.S. House of Representatives.” The result was the report “Green the Capitol Initiative,”
(CAO 2007) which recommended that the House adopt three goals for future operations:
1. Operate the House in a carbon-neutral manner by the end of the 110th Congress, i.e., by
January 2009.
2. Reduce the carbon footprint of the House by cutting energy consumption by 50% in 10
years
3. Make the House operations a model of sustainability.
To achieve these goals the report provided a summary of implementing strategies. These
strategies provide the roadmap to reducing the carbon footprint of the House, while operating the
complex in an environmentally sustainable manner.
The House Buildings
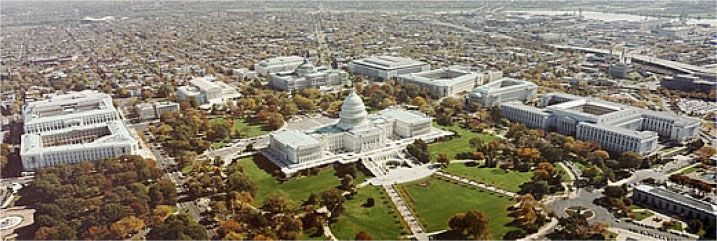
Figure 1 shows an aerial view of the U.S. Capitol and the associated buildings. The three
House office buildings (Cannon, Longworth, Rayburn) are to the right of the Capitol, and the
Capitol Power Plant (CPP) is just visible to the upper right.
2008 ACEEE Summer Study on Energy Efficiency in Buildings 3-76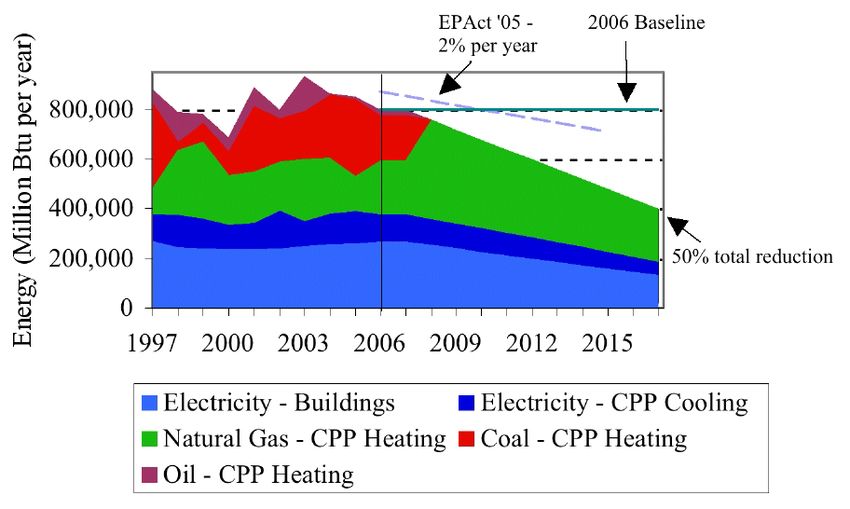
Figure 1. Aerial View of the U.S. Capitol buildings.

               The House buildings represent a diverse mix of office and support spaces, and include
       historical buildings as well as the new Capitol Visitor Center, currently under construction. The
       House building complex consists of seven buildings in the Capitol complex, accounting for 6.1
       million square feet, roughly 40% of the 15.4 million square feet of the total Capitol complex area
       (Table 1).

                                Table 1. Characteristics of the House Buildings
                                                                                                2006 Floor Area
                          Building Name                                  Year Built
                                                                                                    [square feet]
         Cannon House Office Building                                         1908                  888,536
         Longworth House Office Building                                      1933                   682,791
         Rayburn House Office Building
         (inc. E & W Underground Garages)                                     1965                  2,971,469
         Ford House Office Building                                           1939                   594,730
         House Page Dorm                                                      1940                   44,986
         U.S. Capitol*                                                        1793                   421,800
         Capitol Visitors Center                                    (under construction)             580,000
         TOTAL                                                                                      6,122,312
                             *Only one-half of the Capitol floor area is under House jurisdiction

       Energy Consumption for the House Buildings

               Energy is supplied to the House buildings from several sources. Electricity is purchased
       from the local utility and provided directly to the buildings. The buildings are on a district steam
       and chilled water loop supplied by the CPP located on site. The CPP does not produce electricity,
       but purchases electricity to operate the chillers. The boilers of the plant primarily use coal or
       natural gas to produce steam that is distributed to many of the buildings. Some of the buildings,
       for example, the Ford House Office Building, have other suppliers of heating and cooling
       energy.

2008 ACEEE Summer Study on Energy Efficiency in Buildings                                                           3-77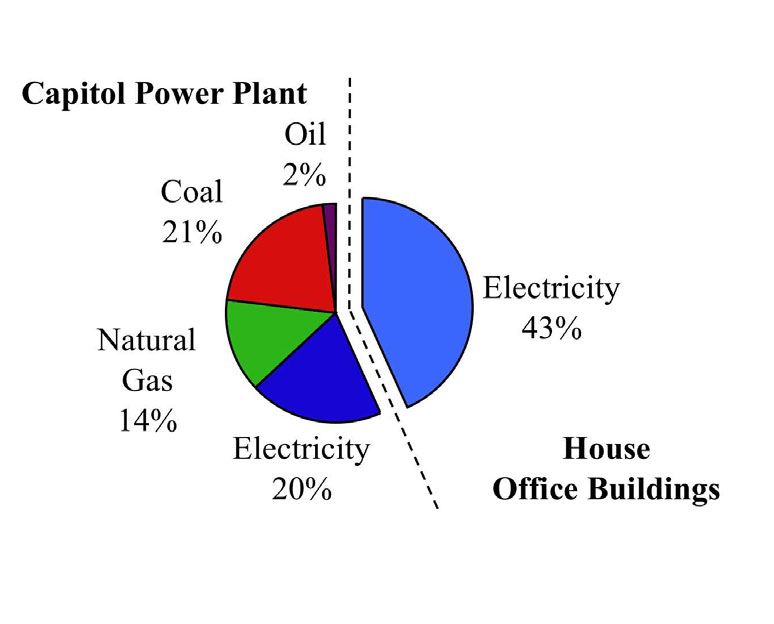
Table 2 shows total energy consumption in House buildings. The table includes energy
       consumption, primarily electricity, metered at each House building, electricity used by the CPP
       to provide chilled water to House buildings, and fuel used by the CPP boilers to provide steam
       heat to House buildings.

                             Table 2. 2006 House Buildings Energy Consumption
                                                                                  Total       Total
                                                      Metered         Electricity Fuel       Energy
                                                     Electricity       (Million (Million    (Million
                     Building Name                    (MWh)              Btu)     Btu)        Btu)
                      Cannon HOB                        9,126            31,138             31,138
                     Longworth HOB                      8,761            29,893             29,893
                  Rayburn HOB plus
           East & West Underground Garages             28,046            95,694             95,694
                        Ford HOB                       11,745            40,074   22,992    63,066
                    House Page Dorm                      393              1,342              1,342
                       U.S. Capitol                    12,709            43,363             43,363
                  Capitol Visitors Center                431              1,472              1,472
               Capitol Power Plant @ 31%               32,199           109,862   433,259   543,121
                         TOTAL                         103,411          352,838   456,251   809,089
                                         Source: Architect of the Capitol 2007
                                            HOB = House Office Building

               The CPP provides chilled water and steam throughout the Capitol complex, not just to
       House buildings. Because metered consumption of chilled water and steam is not available for
       each House building, we had to estimate of the percentage of total CPP output that was
       attributable to the House buildings. Based on floor area data for the buildings served by the CPP,
       we estimated that 31% of the CPP output is attributable to House buildings. We then applied the
       31% factor to total CPP electricity and fuel consumption to calculate the chilled water and steam
       energy consumption to the House buildings. In 2006, the total annual energy use for the House
       buildings was an estimated 809,100 million Btu (MBtu) expressed as site energy (not source
       energy).
               Table 3 shows trends in electricity consumption fore the House buildings between 2003
       and 2006. There has been a 2% increase in electricity consumption by 2006 from the FY03
       baseline established by the Energy Policy Act of 2005, with an even greater increase in
       electricity use in the House buildings. The power consumption at the CPP has been decreasing
       over the same period, due to the replacement of the chillers with more efficient equipment.

2008 ACEEE Summer Study on Energy Efficiency in Buildings                                                   3-78
Table 3. Trend in Electricity Consumption for House Buildings and CPP, 2003-2006
2006 Change from
House Buildings Electricity (MWh)
2003 Baseline
FY 03 FY 04 FY 05 FY 06 MWh %
Cannon HOB 9,057 9,205 8,890 9,126 69 1%
Longworth HOB 9,173 9,867 9,560 8,761 -412 -4%
Rayburn HOB 27,485 27,399 27,774 28,046 561 2%
Ford HOB 11,836 12,749 12,748 11,745 -91 -1%
House Page Dorm 410 439 409 393 -16, -4%
U.S. Capitol
(House only) 9,403 9,663 9,682 12,709 3,306 35%
House Total
(kWh) 67,471 70,894 71,665 71,212 3,741 6%
Capitol Power
Plant @ 31% 34,214 32,199 2,015 -6%
TOTAL HOUSE
& CAPITOL
POWER PLANT 101,685 103,411 1,726 2%
Source: Architect of the Capitol 2007
Figure 2 shows the trends in electricity intensity (total electricity per floor area) for the
House office buildings, and the wide variation between them.
Figure 2. Electricity Intensity Trends for Capitol and House Buildings (kWh/ft2-yr).
CAPITOL & HOUSE BUILDINGS
Electricity Intensity Trends
30
25
CANNON
20 FORD
HOUSE PAGE DORM
LONGWORTH
15
RAYBURN
CAPITOL VISITOR CENTER
10 US CAPITOL
5
0
1997 1998 1999 2000 2001 2002 2003 2004 2005 2006
Year
2008 ACEEE Summer Study on Energy Efficiency in Buildings 3-79Goal #1: Operate the House in a Carbon-Neutral Manner by the End of the 110th Congress
The report identified immediate steps that the House could take to provide leadership to
address global warming. The House can make the operations of the House carbon-neutral, so that
its net carbon dioxide equivalent (CO2-e) emissions become zero.
Using data developed by the Government Accountability Office, and reviewed by
Lawrence Berkeley National Laboratory, the operation of the House complex was responsible
for approximately 91,000 tons1 of CO2-e emissions in fiscal year 2006. This value is equivalent
to the annual CO2-e emissions of 17,200 cars.2 Figure 3 shows the sources for the CO2-e
emissions for the House buildings by fuel type. Electricity is purchased from the local utility and
provided directly to the buildings. Heating and cooling for the buildings is provided by the
Capitol Power Plant (CPP), located on site.
Figure 3. Total 2006 Carbon Dioxide-Equivalent Emissions for House Buildings
Three strategies were recommended to achieve carbon neutrality for the House buildings:
1. Purchase electricity generated from renewable sources
2. Switch from using coal, oil, and natural gas at the CPP to natural gas only
3. Purchase offsets for the remaining carbon emissions
1
Tons = English short tons (1 ton = 2000 pounds).
2
Estimates were derived using coefficients for CO2-e emissions from the GAO April 2007 report and conversion
factors for equivalent number of cars from the US EPA (www.fueleconomy.gov).
2008 ACEEE Summer Study on Energy Efficiency in Buildings 3-80Strategy #1: Purchase Renewable Power for Electricity Use
Electricity use is the largest source of CO2-e emissions from House operations. To
achieve the goal of making operations carbon-neutral, the Chief Administrative Officer (CAO)
and the Architect of the Capitol (AOC) have negotiated with their energy service provider to
purchase 100% of the electricity needs, approximately 103,000 megawatt-hours per year, from
renewable sources beginning October 1, 2007. By implementing this recommendation the House
will eliminate 57,000 tons of the total CO2-e emissions annually or the equivalent of removing
11,000 cars from the roads.
Strategy #2: Operate the CPP with Natural Gas
The second strategy is to reduce the CO2-e emissions from the coal burned at the Capitol
Power Plant (CPP) to meet the needs of the House of Representatives. The report recommended
that the CPP use natural gas instead of coal and oil to meet the needs of the House. By taking this
action, CO2-e emissions from the CPP will be lowered by 30% from the 2006 level, which is the
equivalent of taking 1,900 cars off the road each year. Because the boilers already have dual-fuel
capabilities, they can be switched to natural gas and can use alternate fuel, either coal or oil, as
emergency back-up.
Strategy #3: Purchase Carbon Offsets on the Chicago Climate Exchange
Even by using electricity from renewable sources and switching the generation of steam
to natural gas, the House will still need to offset 24,000 tons of carbon emissions to achieve the
goal of carbon-neutral operations. The House has offset the remaining carbon emissions by
purchasing from the Chicago Climate Exchange, with carbon credits specifically for projects in
the United States. These offsets will be permanently retired so that the carbon credits cannot be
used again. The CAO plans to purchase CO2-e offsets equal to House-attributable emissions on
an annual basis.
Goal #2: Reduce the carbon footprint of the House by cutting energy consumption by 50%
in 10 years
While the House will achieve carbon neutrality by the end of the 110th Congress, the long
term goal is to lower the carbon emissions, or the “carbon footprint,” by reducing energy
consumption. Cost-effective investments in energy efficiency will pay for themselves and reduce
the House’s annual operating costs. The report recommends a goal of reducing the House’s
energy use by 50% over the next 10 years.
Energy management has been on the Capitol’s agenda for some years. While the potential
for further gains is substantial, notable precedents exist in the House’s use of energy efficient
technologies, and operational practices that enhance energy efficiency.
Several studies have recently been completed, or are currently under way, that
characterize the energy use and carbon dioxide equivalent emissions (CO2-e) of the Capitol area
complex. The Architect of the Capitol (AOC) is completing an assessment of the energy retrofits
that can be undertaken as part of its overall facilities planning process. The Government
Accountability Office (GAO) has issued a report documenting detailed analysis of the energy use
2008 ACEEE Summer Study on Energy Efficiency in Buildings 3-81and CO2-e emissions for the Capitol complex and outlined its “carbon footprint.” The House
Science Committee is proposing demonstration offices to showcase energy-efficient and
sustainable practices. Recommendations have been made by Carnegie Mellon University and
others on specific measures that can be taken, both as short-term actions and through improved
specifications for future retrofits. Various other energy audits and surveys have been conducted
in the past, including energy efficiency and solar studies conducted by NREL in 2002.
Figure 4 estimates where energy was used during 2006 in the House office buildings,
based on data from AOC and additional analyses. The largest use of energy in the House
buildings is for cooling (38%) followed by heating (28%), lighting (17%), office equipment
(7%), and miscellaneous other uses (10%), such as ventilation fans, elevators, and other
equipment and appliances.
Figure 4. Estimated Total Energy Use for Three House Buildings by End Use
Figure 5 shows the proposed goal for cutting energy use by 50% by 2017. The reductions
mandated under the 2005 Energy Policy Act are indicated by the blue dotted line. The proposed
strategy more than doubles those savings.
2008 ACEEE Summer Study on Energy Efficiency in Buildings 3-82Figure 5. Energy Reduction Scenario for the House Attributable Consumption
Due to Improved Efficiency Measures
To achieve the 50% goal, the House will have to employ an optimal mix of life-cycle
cost-effective investments in energy efficiency.
Recommendations for Reducing Energy Use in the House Office Buildings
The report made several recommendations for reducing energy use in the House office
buildings, including:
• Use metering, commissioning, and tracking to improve operating efficiency and
management
• Install/upgrade steam meters for all House buildings
o Install/upgrade chilled water meters for all House buildings
o Optimize major steam and chilled water systems for energy efficiency during
different seasons
o Use utility tracking to monitor energy use during various times of day to identify
energy savings opportunities
2008 ACEEE Summer Study on Energy Efficiency in Buildings 3-83• Install energy efficient lighting
o Retrofit ceiling lamps, fixtures, and controls to increase energy efficiency
o Evaluate motion-activated lighting in offices, service corridors, tunnels, and
parking areas to reduce energy use
o Replace desk lamps (task lighting) with energy-efficient lamps
o Conduct high-efficiency ceiling lighting pilot program
o Evaluate exterior building lighting to reduce energy use
• Adopt new technologies and optimal operating practices for electronics and office
equipment
o Change computer operations to allow staff to centrally power-down equipment
when unused for significant periods such as nights and weekends
o Maximize power management efforts present in existing electronic equipment
through periodic audits and employee education
o Develop a preferred list of Energy Star-qualified and FEMP-designated office
electronics
o Devise strategies to consolidate equipment
• Update heating, ventilation, and air conditioning equipment and practices
o Retrofit motors, fan drives, pumps, and valves with energy-efficient models.
o Modify constant-air-volume equipment and controls so that air-handling systems
operate as variable-air-volume systems
o Seal air distribution ducts to minimize air leakage
o Optimize fan schedules to avoid unnecessary equipment operation
• Make computer rooms and servers more energy efficient
o Improve operational control of data center auxiliary cooling and power systems
o Consolidate servers distributed throughout House buildings into dedicated server
rooms
o Consolidate many lightly-used servers into fully-utilized server systems
o Adjust air distribution in computer rooms for thermal optimization
• Evaluate food service practices, elevator and vending machine energy efficiency, hot
water use, laundry and dry cleaning services, fitness center operations, and other House
services for energy savings opportunities
o Inventory current equipment and schedules to identify energy savings
opportunities
o Install new energy-efficient equipment and operating strategies.
The Capitol Power Plant is the largest single source of carbon emissions on the Capitol
Hill. As noted earlier, switching to natural gas will reduce the CO2-e emissions of the CPP by
30%. The plant’s operation has also been controversial because of visual and health concerns
among Capitol Hill residents. The report recommended that the following actions should be
taken to optimize operations of the CPP to maximize energy efficiency and to reduce energy
consumption:
2008 ACEEE Summer Study on Energy Efficiency in Buildings 3-84• Improve steam production efficiency
o Evaluate reducing boiler steam pressure output from 200 PSI to 150 PSI
o Implement best practices for operations and maintenance
o Monitor energy efficiency performance
• Improve chilled water production efficiency
o Implement best practices for operations and maintenance
o Retrofit motors with premium efficient motors
o Evaluate retrofit potential of variable-speed drives on pump motors
o Monitor energy efficiency performance
o Evaluate new efficient chillers for West Refrigeration Plant
• Improve steam and chilled water distribution systems
o Improve maintenance of steam traps, increasing steam system distribution
efficiency
o Determine need for new insulation of all distribution lines to reduce heating and
cooling losses
o Adjust steam delivery pressures where practicable to follow heat load
requirements in Capitol buildings
Goal #3: Make House Operations a Model of Sustainability
In addition to improving the way the House consumes energy, the report recommended
that the House should provide an environmentally sustainable and healthy working environment
for employees. The House has the opportunity to lead by example by making its business
operations a model of sustainability. In order to achieve this goal, every attempt will be made to
purchase locally made, environmentally sustainable products.
Strategy #1: Direct the CAO to Oversee Implementation of “Green the Capitol Initiative”
The Office of the CAO was charged with the responsibility to oversee implementation of
the “Green the Capitol Initiative” for the House of Representatives. This includes working with
the AOC and other offices to improve the sustainability of the day-to-day operations of the
House office buildings including maintenance, finance, transportation, childcare, and food
service.
Strategy #2: Develop a House Sustainability Plan
In June 2007, the CAO convened a meeting with three sustainability leaders from major
universities that are championing sustainability. Representatives from Harvard, Yale, and the
University of California provided briefings on their goals, operations, and successes. A key
component of their success has been a sustainability plan that provides focus and direction to
reform efforts. The report recommended that the CAO develop and implement a House
Sustainability Plan as a dynamic document intended to provide a roadmap for major steps toward
sustainability over the next 20 years and to identify timetables for specific actions.
2008 ACEEE Summer Study on Energy Efficiency in Buildings 3-85Strategy #3: Leadership, Education, and Outreach
The report recommended that the CAO should pursue networking and outreach with the
Senate, other federal, state, and local governments, universities, businesses, and others to remain
current on sustainability practices and CO2-e emission reduction opportunities. The networking
would showcase the House’s leadership role and facilitate the exchange of ideas and information
on environmentally sustainable issues. This activity would include hosting green summits on
sustainability.
Recommendations for specific actions include:
• Prepare a checklist for sustainable office operations for use by Members of Congress and
other Capitol Hill offices
• The House would take a leadership role in networking with the Senate, universities,
businesses, and local and state governments including hosting green summits
• Hold a green expo for House offices to demonstrate the latest in green products or
services available from commercial vendors
• Work with the AOC to make sustainability a mission-critical element
• Provide energy efficiency and sustainability materials for Capitol Hill visitors
Strategy #4: Develop Mechanisms for Evaluating Success and Reporting Progress
The report recommended that the CAO should track benchmarks for energy consumption
and CO2-e emissions monthly and prepare annual reports documenting progress on the
complementary goals of carbon neutrality and sustainable operations. Energy and CO2-e
emissions data will be made available on a website, both as an educational tool and to provide
feedback to House staff.
Conclusion and Future Work
The Greening the Capitol Initiative provides a roadmap for carbon neutrality, energy
efficiency, and operation of the House office buildings in an environmentally sustainable
fashion. Based on these recommendations, the House has initiated a series of steps to operate in a
carbon neutral manner, and is on track to be carbon neutral by January 2009. The House has
begun to implement the energy efficiency measures to reach the goals for cutting the House’s
energy use by 50% in 10 years. Progress is being made on lighting efficiency, monitoring and
metering, fuel conversion, duct sealing, variable speed drives, dome lighting, and several other
areas. The House is also committed to doing business in an environmentally sustainable manner,
and has undertaken a complete overhaul of its food, recycling, composting and waste
management. A key requirement of this initiative is the reporting on progress towards these
goals, and the House is implementing steps to have reports of its progress available to the public.
2008 ACEEE Summer Study on Energy Efficiency in Buildings 3-86References
Architect of the Capitol, July 2000. Comprehensive Energy Conservation and Management Plan.
Washington DC.
Architect of the Capitol, March 2007. “2006 Annual Report, Energy and Water Management and
Conservation.” Washington DC.
Chief Administrative Officer, U.S. House of Representatives, June 21, 2007. Final Report:
Green the Capitol Initiative
http://cao.house.gov/greencapitol/green-the-capitol-final-report.pdf
Government Accountability Office, April 2007. “Energy audits are key to strategy for
greenhouse gas emissions. GAO Report GAO-07-516. Washington DC.
Acknowledgments
The authors would like to thank and acknowledge the contributions from the staff at
Lawrence Berkeley National Laboratory, including Barbara Atkinson, Peter Biermayer, Steve
Greenberg, Alan Meier, Evan Mills, Bruce Nordman, Francis Rubinstein, Steve Selkowitz, Tom
Wenzel, Craig Wray, and Peng Xu. This work was funded by the Chief Administrative Officer of
the U.S. House of Representatives, and the Federal Energy Management Program of the U.S.
Department of Energy under Contract No. DE-AC02-05CH11231.
2008 ACEEE Summer Study on Energy Efficiency in Buildings 3-87You can also read