Verpackung - Wahrnehmung und Wirklichkeit Packaging - Perception and Reality - Stefan Glimm - Senior Executive Advisor - Flexible Packaging Europe
←
→
Page content transcription
If your browser does not render page correctly, please read the page content below
Verpackung –
Wahrnehmung und Wirklichkeit
Packaging – Perception and Reality

Stefan Glimm – Senior Executive Advisor – Flexible Packaging Europe

Forum Produktion & IT 2019, Nordhorn – 8 Mai 2019
Who is talking to you

◼   Economist with 30+ years experience                                         Stefan Glimm

    (24 years on Executive level)
◼ At organisations on national, European,
  global level (UNEP)
◼ In market analysis, communication,
  sustainability (LCA, recycling, legislation,…)
◼ Today:

                                                                           Global Emergency Dispensary
Senior Executive Advisor   Senior Executive Advisor      Advisory Board     Chairman Advisory Board

    Director General           Co-Initiator           Board & Co-Founder       VP Board of trustees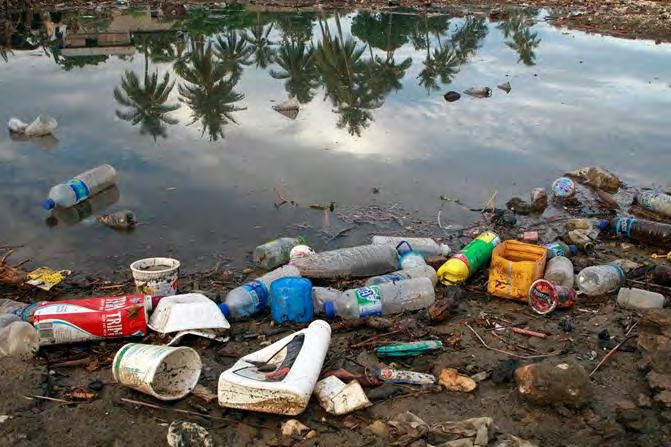
Who is Flexible Packaging Europe

◼   80+ member companies
◼   6 national associations also FPE members
◼   9 FPE members listed in Europe’s Top 10
◼   5 FPE members in World’s top 10
◼   About 80% of European flexible packaging turnover           Executive Director
    − Extract of FPE membership                                 Guido Aufdemkamp

                  … and many more in Western, Central and Eastern Europe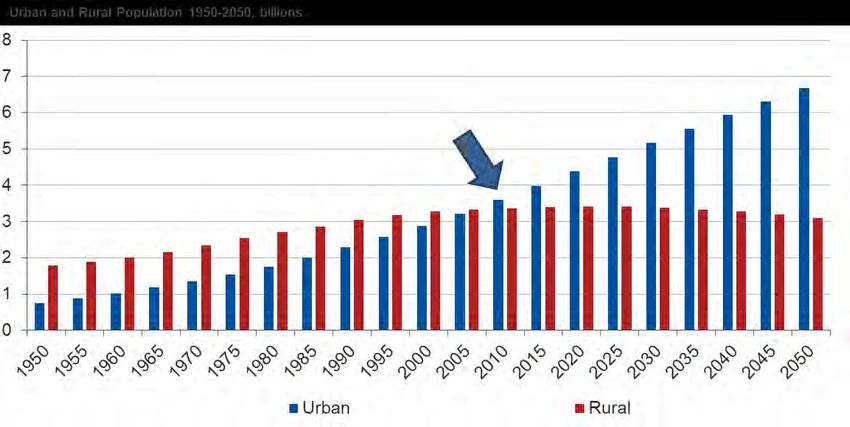
FPE Membership

◼   AL INVEST Bridlicna    ◼   Etimark                    ◼   PAWAG Verpackungen     Associated Members:
◼   Al Pack                ◼   Eurofoil                   ◼   Perlen Converting
                                                              Pilen Pak              Companies:
◼   Aluberg                ◼   Fislage                    ◼
                                                              Polipaks               ◼  Elopak
◼   Aluflexpack            ◼   Formika                    ◼
                                                              pre pac group          ◼  Greatview
◼   Aluminium Féron        ◼   FMS Foils Group            ◼
                                                              Print and Packaging    ◼  SIG Combibloc
◼   Alu-Vertriebsstelle    ◼   Gascogne Flexible          ◼
                                                              RKW                    ◼  Sonoco
◼   Amcor Flexibles        ◼   Goglio                     ◼
                                                              Sacchital              ◼  Tetra Pak
◼   Ampac Flexibles        ◼   Hatzopoulos                ◼
◼   BAK Ambalaj            ◼   Heyne & Penke              ◼   Saica
                                                              SAFTA                  National Flexible Packaging
◼   Ballerstaedt           ◼   Huhtamaki                  ◼
                                                              Schmid Folien          Associations:
◼   Bemis                  ◼   Hydro Aluminium            ◼
                                                              Schur Flexibles        ◼    BPF (United Kingdom)
◼   Beucke & Söhne         ◼   Immer Group (Ukrplastic)   ◼
                                                              SEDA                   ◼    EFE (Spain)
◼   Bilcare                ◼   ips ariflex                ◼
                                                              Selig Sealing          ◼    ELIPSO (France)
◼   Bischof + Klein        ◼   ISPAK                      ◼
                                                              SIT                    ◼    FASD Turkish Flexible
◼   Carcano                ◼   Italcoat                   ◼
                                                              Südpack Verpackungen        Packaging
◼   Cellografica Gerosa    ◼   itp                        ◼
                                                              Symetal                ◼    FPE German Group
◼   Cellpack Packaging     ◼   Krajczár                   ◼
                                                              Tsimis                 ◼    GIFLEX (Italy)
◼   Clondalkin             ◼   Lecta (Torrespapel)        ◼
                                                              UC Rusal               ◼    UAPE (Ukraine)
◼   Constantia Flexibles   ◼   Leeb Flexibles             ◼
◼   Coveris                ◼   Leipa                      ◼   Vedreine
◼   Danaflex               ◼   Maria Soell                ◼   Walki
◼   Dettmer Verpackungen   ◼   Mondi                      ◼   Wipak
◼   Di Mauro               ◼   Multifoil                  ◼   Wipf
◼   Emsur                  ◼   Novelis                    ◼   WZ Packaging
◼   Enteco Pharma          ◼   O Kleiner
◼   Etapak                 ◼   online laminating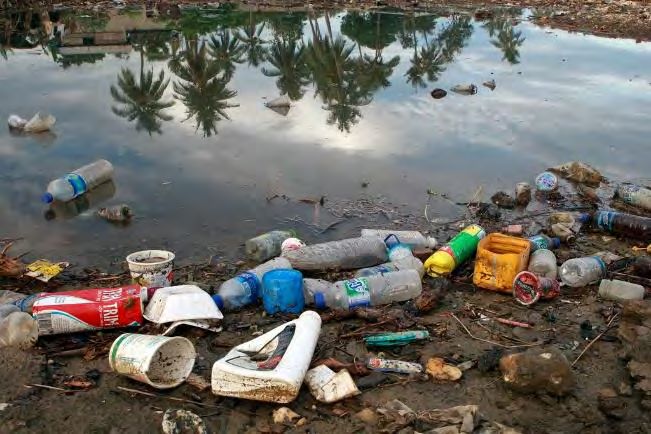
Objectives and Key Activities

                  Market Analysis

                  Communication
 Compliance

                   Sustainability

                    Public Affairs

                    Food Contact

              Networking & Conferences

                   Global Issues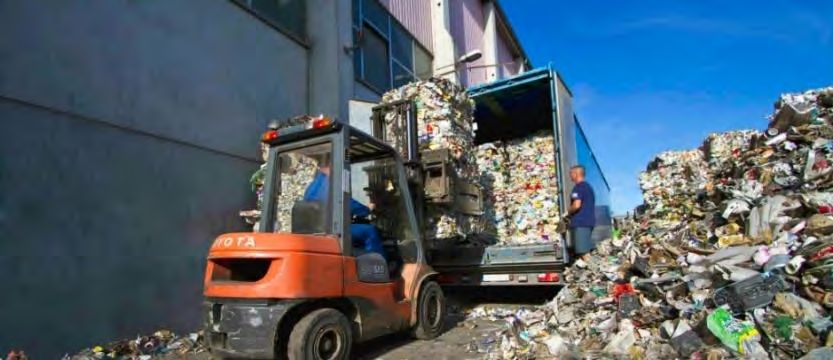
Packaging‘s Future on Stake?

◼   Packaging Markets in Europe and
    worldwide continuously growing
◼   Licence to operate at stake

    Need to solve littering issue worldwide to save flex pack
    resource efficiency and light-weighting benefits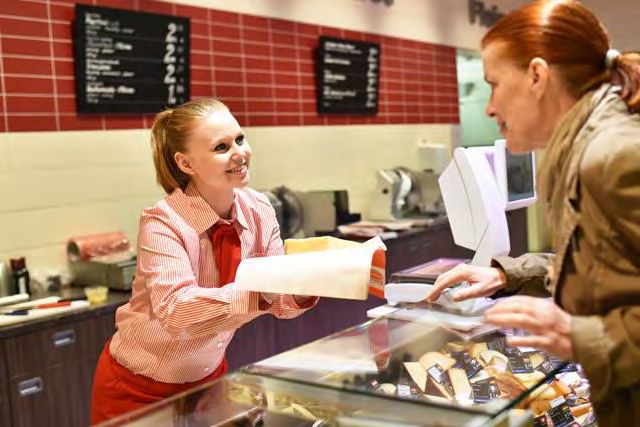
Perception of packaging

◼   Superfluously

◼   Waste

◼   Recycling
    − Design for recycling
    − Mono material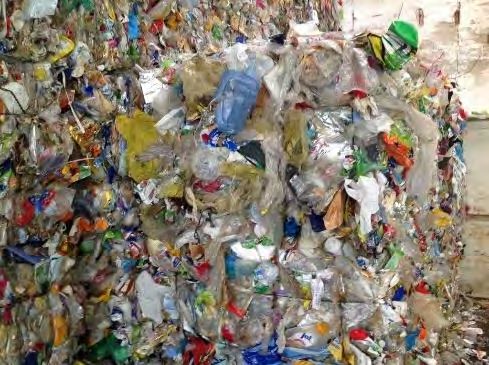
Reality

◼   Feeding world population 2050+
◼   Reducing food losses
◼   Growing life expectancy: hygiene

◼   Resource
    − Chemical, energetic, material

◼   Collection
    − Prevention + light-weighting
    − Functionality
    − Design for resource efficiency (holistic approach)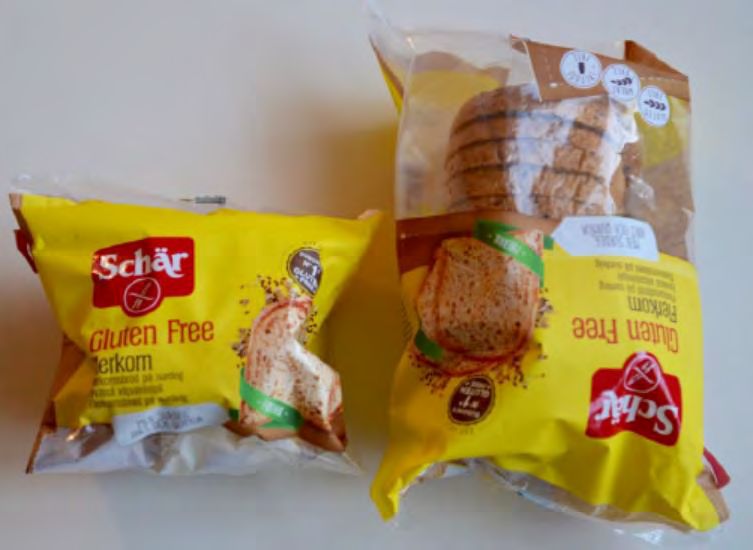
Perception:
Population and urbanization

        People living in an urban area:

  1900

  1990

  2010

  2030

  2050

      Reality:           they all want food, medicals,… and their supply
                         without packaging would be impossible
Sources: UN , WHO, CRU
World population and life expectancy

               World population                         Life expectancy
  billion
   9,00                                            80
                    Forecast 2020: 7,758 billion
   8,00
   7,00
                                                   60
   6,00
   5,00
   4,00
                                                   40
   3,00
   2,00                                            20
   1,00
   0,00 1800: 0,9 billion                           0
                                                        1820
                                                        1830
                                                        1840
                                                        1850
                                                        1860
                                                        1870
                                                        1880
                                                        1890
                                                        1900
                                                        1910
                                                        1920
                                                        1930
                                                        1940
                                                        1950
                                                        1960
                                                        1970
                                                        1980
                                                        1990
                                                        2000
                                                        2010
            1800
            1820
            1840
            1860
            1880
            1900
            1920
            1940
            1960
            1980
            2000
            2015

Perception: population growth ‘forever’?
 Possibility:                 forecast 2100+ ‘peak’ at 11-12 bln people?

Sources: UN and WHO; www.gapminder.org
Perception:
World population 2050+ cannot be fed
Dr Ren Wang,
FAO (2014)
“Just imagine that global food
loss and waste were a country.
It would have a surface area
larger than my own homeland,
China. Its fields and meadows
would be producing food that
nobody would eat. It would be the
largest user of water for irrigation
and the third largest generator of
greenhouse gases.”
Source: FAO “Food wastage footprint. Impacts on natural resources” (2013)Possibility: Reducing food losses to Zero
should allow to feed 11 bln people
The Coffee CaseWhich cup of coffee has the higher carbon
footprint?
+ =
Coffee in meetings can easily result in 30% waste
Multi-portion
Multi-portion Single-portion
Food production
Retail packaging
Distribution
Transport to household
Storage/Use at home
Ground coffee Ground coffee (food waste) Instant coffee
(single portion = no food waste)
Measured in g CO2-eq
Source: ESU ServicesInvestment in Appropriate Packaging saves
more Resources than it needs
2 -10 % Resources required 90 -98 %
Packaging Coffee production,
transport and distribution,
boiling waterPackaging and Packed Product Lifecycle
(Flexible) packaging represents a relatively small part of the overall
environmental product impact – usually below 10%
Carbon Footprint (GWP) of Food Products – Breakdown by life cycle stage
100%
90%
80% food
production
70%
retail
60% packaging
50% distribution
and selling
40%
transport to
30%
household
20%
storage/use at
10% home
0%
Butter (250g) Milk Chocolate Frozen Spinach Ground coffee Instant coffee Goulash soup
Source: EAFA/FPE LCA’s qualified as best practice by UNEP/SETAC (Nov. 2013)How to find a trade-off between packaging and food waste Carbon Footprint of Food Waste mostly of much greater magnitude than the one of packaging Source: Denkstatt/ARA 2014 Study: “How Packaging Contributes to Food Waste Prevention”
Packed or Not? – Impact on Food Waste

Cucumber example: PE film vs no consumer packaging
◼   shelf life extended from 3 to 14 days , less moisture loss
◼   food waste reduced by half at retailer (4.6% instead of 9.4%) …

                                                         … and most likely also
                                                                  at consumer
                                                                      (not yet measured)

                                        Optimization of packaging: + 4.5 g CO2e
                                        Reduced food waste retail – 13.5 g CO2e
                                        (functional unit: 480g cucumber)

                Data source: Denkstatt 2017 Austrian Retailer Study
Effective/Appropriate Protection
Sirloin steak example: advanced skin packaging instead of
sealed tray with modified atmosphere
◼ 19g packaging material instead of 31g
◼ Shelf life extended from 6 to 16 days
◼ food waste reduced by 75% at retailer (3% instead 12%)...
… and most likely also
at consumer
(not yet measured)
Optimization of packaging: + 5 g CO2e
Reduced food waste retail: - 730 g CO2e
(functional unit: 330g sirloin steak)
Data source: Denkstatt 2017 Austrian Retailer StudyTrade-off additional packaging/smaller
format vs impact of packaging
◼ How much food waste reduction is required to balance the increased
climate impact from using more packaging material for a smaller pack?
350g bread
5g plastic
A reduction of 3.5 g bread waste (for 1kg bread consumed)
700g bread
is sufficient to offset the additional climate impact linked to
8g plastic
increased packaging used with small portion solution
Source: Helen Williams 2017; based on the study: Williams Helén, Wikström Fredrik. Environmental Impact of Packaging and Food
Losses in a Life Cycle Perspective: A Comparative Analysis of Five Food Items. Journal of Cleaner production 2011, 19(1): 43-48What generates less food losses in
canteens: packed or sliced cheese?
Measured cheese waste in French canteen:
◼ 6% for individually ◼ 15% for cheese cut on-site
packed cheese − 3% left-over during preparation
− leftovers on the meal tray − 9% leftovers on the meal tray
− 3% surplus thrown away at the end of service
Source: IFOP study for Bel 2015; totalling nearly 60000 studied meals in 33 French schoolsConclusion:
Packaging Can Prevent Food Waste
◼ By providing effective/appropriate protection
− Throughout the supply chain until the ultimate moment
of consumption
◼ By providing appropriate format and serving
◼ By providing appropriate convenience
− Easy to handle, open, reclose…Perception: restrict portion packaging ◼ Chewing gum ◼ Pharmaceuticals Reality: Packaging improves hygiene – supporting to extend life expectancy
Perception: unpacked - a solution?

       Water           Food and Nutrition         Medicine

Reality: Packaging improves hygiene – supporting to extend life
expectancy
Is unpacked THE solution?
Elipso’s demonstration of a
supermarket without packaging:
http://youtu.be/cDtl8v5f77kPerception: waste
Reality: resource
◼ Ownership of product/material
− EPR
− Value driven
− ‚Material Matters‘
Thomas Straub
Sabine Oberhuber
◼ Infrastructure (no collection – no recycling)Closing the Circle – Reducing the Losses
◼ No collection – no recycling:
Collect All Packaging initiative EU
◼ Design for recycling only will
not stop (marine) litter
◼ No “incentives” – no collection
− Europe: sophisticated EPR systems
− Africa/Asia: “value” driven initiatives
◼ If collected – critical mass for investments in sorting +
recycling/recovery
CEFLEX – initiated by FPEPlastic recycling initiatives Europe
(initiatied by FPE)CEFLEX: European consortium of companies and associations
representing the entire value chain of flexible packaging to enhance the
performance of flexible packaging in the circular economy.
BRAND OWNERS AND RETAILERS COLLECTORS, SORTERS AND RECYCLERS SUPPLIERS, END USERS AND OTHERS
PLUS: MATERIAL PRODUCERS and FLEXIBLE PACKAGING CONVERTERS
>100 companies and associations from the full FP Value Chain
collaborating to find sustainable solutions to make FP circular
28 www.CEFLEX.euWhat does the European Packaging market look
like?
• Total EU packaging market: c.a. 84 M T*
• Total EU plastics packaging: c.a. 20 M T**
• Total EU consumer flexible packaging: 4 M T*** 84 20 4
• Not yet collected everywhere in Europe and majority is sent
for energy recovery (or landfilled)
• Sorting and recycling solutions developed in EU can be
relevant globally Million Tons per Year
Eurostat 2015 data, ** 19.55 Mtpa. Plastics – The facts 2016 -2015 data, *** 2016 data. 3.987 Mtpa (incl. exports).
Calculated by CEFLEX, based on Plastics – The facts 2016 and FPE Market Report Summary 2016
29 www.CEFLEX.euPlastic recycling –
possible limitations and requirements
◼ Collection
◼ Markets for applications made from recycled
plastic
◼ Technology
− A vital part of any plastic recycling strategy for polyolefin plastic packaging
will be, in addition to mechanical recycling, the development of chemical
recycling capability to:
− Renew the polymer properties and remove impurities after several
mechanical recycling loops
− Remake the polyolefin so that they can be reused in direct and indirect
contact with food. This is vital as food packaging represents a very
significant market for polyolefin packaging.Perception: Design for recycling in EU needed Reality: Collection in Asia/Africa essential
Value driven collection to stop marine litter: examples

  India                Ghana (?)                South Africa                                    Indonesia
                                                                     Ivory Coast

“The only way to stop Ocean plastic is                 A Global Commitment
to reveal the value in plastic by                      March 2011: leaders from plastics associations
transferring as much value as possible                 around the world developed and signed The
                                                       Declaration of the Global Plastics Associations
into the hands of the collectors.”
David Katz, Founder & CEO of the Plastic Bank          for Solutions on Marine Litter

            www.plasticbank.org                        https://www.marinelittersolutions.com/
Alliance to End Plastic Waste (AEPW)
◼ Initial budget: 1,5 billion US $, regional focus: Asia
◼ Objectives
− Infrastructure development to collect and increase recycling
− Innovation that make recycling and recovering plastics easier and
create value from all post-use plastics
− Education and engagement of governments, businesses, and
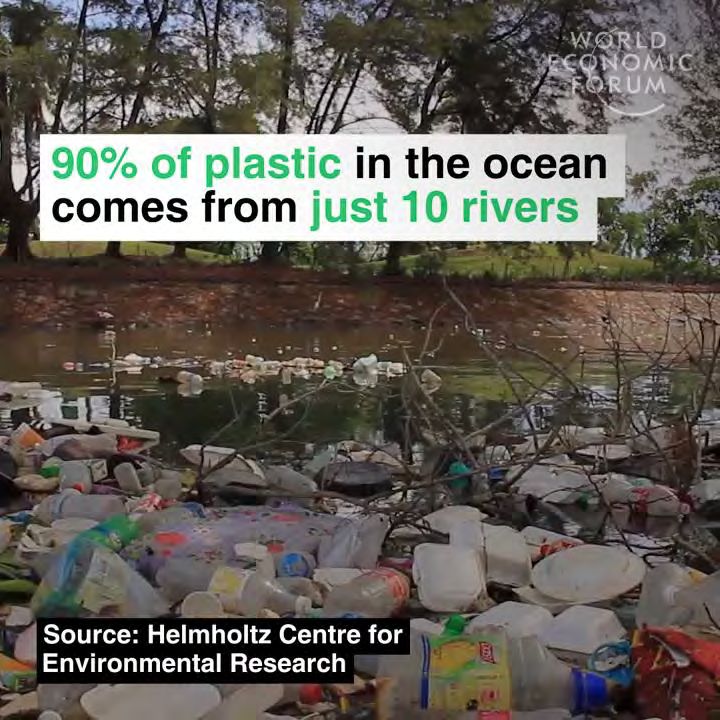
communities to mobilize action
− Clean up of concentrated areas of plastic waste already in the
environment, particularly the major conduits of waste, like rivers
◼ Founding members: BASF, Berry Global, Braskem, Chevron Phillips
Chemical Company LLC, Clariant, Covestro, Dow, DSM, ExxonMobil, Formosa
Plastics Corporation, U.S.A., Henkel, LyondellBasell, Mitsubishi Chemical Holdings,
Mitsui Chemicals, NOVA Chemicals, OxyChem, PolyOne, Procter & Gamble, Reliance
Industries, SABIC, Sasol, SUEZ, Shell, SCG Chemicals, Sumitomo Chemical, Total,
Veolia, and Versalis (Eni).
www.endplasticwaste.orgPerception: recycling ‚only‘
Reality: holistic approach
◼ Perception
− Recycling
− Design for recycling
− Mono material
Packaging Waste
Hierarchy according to
Directive 2008/98/EC
◼ Reality: holistic approach Prevention
− Collection Reuse
− Prevention = light-weighting Recycling
− Design for resource efficiency Energy
recovery
− FunctionalityPrevention of packaging waste – the two
options
Material prevented from
becoming waste:
= 5g or 10%
Rigid pack Rigid pack
(weight 50 g) (weight 45 g)
= 45g or 90%
Flexible pack
(weight 5 g)Which packaging is more resource
efficient?
◼ A rigid pack (weight 50 g) ◼ Or a flexible pack (weight
with 80% recycling rate? 5 g) with 0% recycling
rate?
→ Material loss is 10 g → Material loss is 5 gPrevention and Light-weighting
outperform Recycling
Packaging Scenarios for EU Food Supply (except beverages) in units:
“Base scenario“ “Focus on recycling” “Focus on Prevention”
Situation today with 100% recycling with 0% recycling
flexible
packaging
40%
non-flexible non-flexible
packaging flexible packaging
packaging
60% 100%
100%
Potential consequences (per annum):
Carbon footprint 40% less
(in CO2-eq) 6% more
(=0.9% of total EU CO2-eq)
Weight of 26.5 mio t less
packaging material 17 mio t more
(=1 million truck loads)
Source: ifeu 2014, verified/reviewed by Carbotech 2014Prevention and Light-weighting From filler to retailer: From packaging supplier to filler: 1 truck for flexibles vs up to 26 trucks for non-flexibles
It is not about recycling only, it is about:

◼   Resource efficiency: enable consumption with lowest possible
    resources
◼   Prevention: Serve same purpose with less material / resources
◼   Design for
    − Recycling ?
    − Re-Use ?
    − Resource efficiency !
      (and minimization of material losses and overall environmental impacts)

     “Circular Economy” should aim to minimizing the loss of
     materials/resources leaving the circle – regardless whether
     this is achieved by prevention, recycling or recovery
Executive Summary: the purpose of packaging
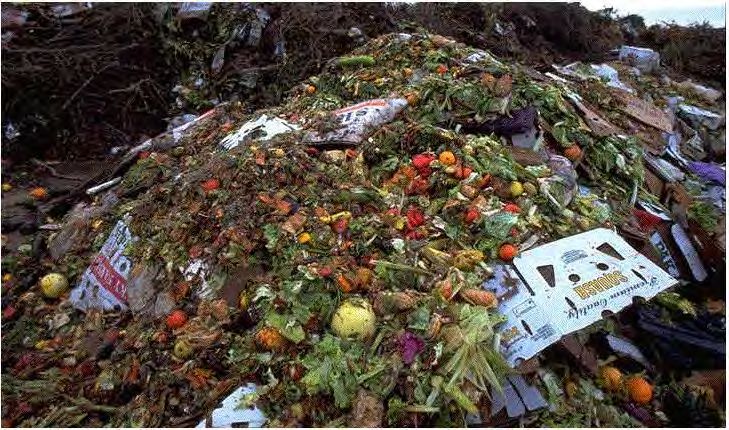
Produce litter: Minimize food waste: Feed people:
no yes yes
Without packaging it is impossible to
◼ Feed the world
◼ Enable sustainable consumptionPerception and reality:
the relevance of packaging?
The CO2 footprint of one flight (per person) corresponds to the
CO2 fooprint of how many years of packaging consumption per
person? (all packaging materials incl. - transport, primary, secondary)
◼ Flight Berlin – Paris – Berlin (800kmx2)
− 5 years packaging consumption
◼ Flight Berlin–Singapur–Berlin (9.900kmx2)
− 30 years packaging consumption
Source: GVM, Denkstatt, Ökologische Bewertung von Verpackungen, April 2018Take Aways
◼ Packaging means (also compared to unpacked food)
− Improved hygiene, helping to increase life expectancy
− Reducing food waste (having 10x greater environmental impact)
◼ Flexible packaging means
− Prevention of packaging materials used and of food waste
− Light-weighting and energy savings from packaging manufacturer to filler,
and from filler to retailer
− Most resource efficient packaging solutions
◼ Circular Economy and sustainable (food) consumption requires
− Most resource efficient packaging solutions (prevention, recycling, recovery)
− It is not about recycling only, it is about minimising the losses leaving the
circle
− Design for resource efficiency rather than for recycling only
− No recycling without collection
− Collection needs financial incentives (EPR, buy-back,…)FPE’s Key Sustainability Messages Multilingual ◼ Infographics ◼ Poster ◼ Fact sheet ◼ Pocket guide ◼ Website www.sustainability.flexpack-europe.org
Visit, Contact and Follow Us

◼   Visit us: www.flexpack-europe.org
◼   Contact us: enquiries@flexpack-europe.org
◼   Follow us:
You can also read