WorkSafeBC Pre-Drilling Season Update - Budd Phillips WSBC Email: Energy Safety ...
←
→
Page content transcription
If your browser does not render page correctly, please read the page content below
WorkSafeBC Pre-
Drilling Season Update
Budd Phillips WSBC
Email: Budd.Phillips@worksafebc.com

December 15, 2020
Agenda
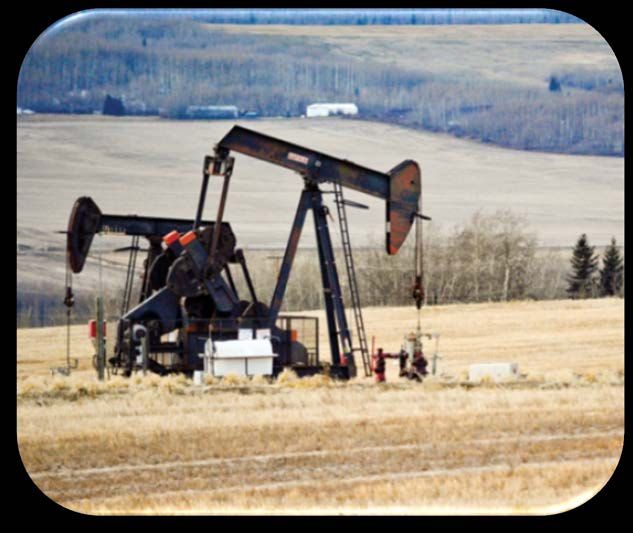
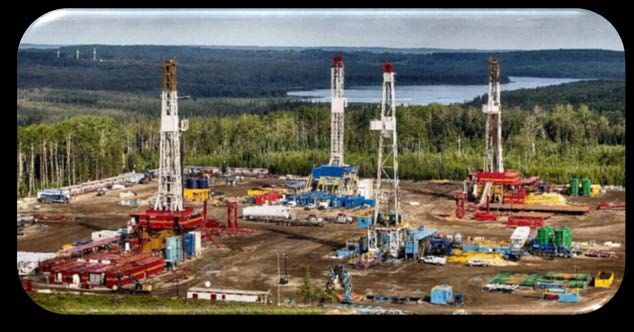
-State of the Oil and Gas Sector in BC
Field Incidents
-Review of compliance issues
-Field Incidents
-Occupational Disease/ECP’s
-Oil and Gas Initiative focus areas 2021-2023
-Regulatory Changes 2021
-Questions
2
Industry Statistical Overview

Oil and Gas Industry
2015-2019

Prepared By: Business Intelligence and Analytics
Data as of Oct, 2020
Industry Classifications

704002 – Oil & Gas Drilling

704003 – Oil & Gas Field Servicing

704009 – Seismic Exploration

713018 – Oil or Gas Production

721038 – Oil and Gas pipeline construction

767005 – Oil or Gas Transmission

                                             4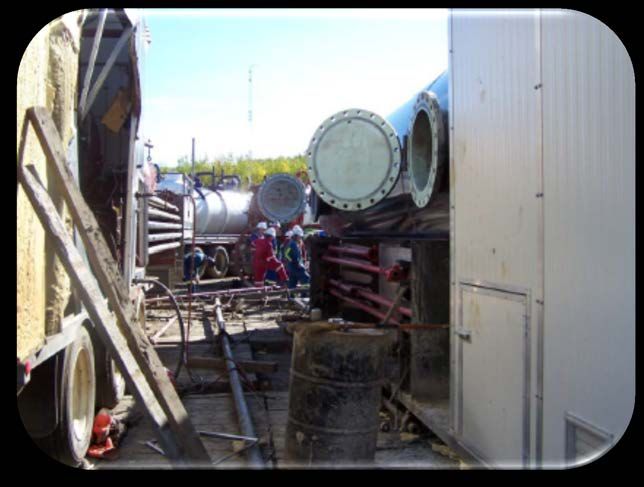
Snapshot of the Industry
• In 2019, there were 1,876 employer-CUs in the selected industry(s), which remained stable over past 5
  years.

• The injury rate for the selected industry(s) remains lower than the injury rate for all BC CUs combined.

• The average percentage of workers returning to work within 4 weeks for the selected industry(s) is
  lower than all BC average over the past 5 years.

• The completed duration for the selected industry(s) remains higher than the completed duration for all
  BC CUs combined.

• Oil and gas drilling, servicing and related labourers, Oil and gas well drilling and related workers and
  services operators, and Transport truck drivers account for the most claims in the selected industry(s).

• There were 1,318 prevention orders issued between 2015 and 2019. As of Sep 30, 2020, 125
  prevention orders have been issued year-to-date.

• Between 2015 and 2019, there were 9 accepted work-related death claims in the selected industry(s).
  As of Aug 31, 2020, 2 work-related death claims have been accepted year-to-date.

                                                                                                             5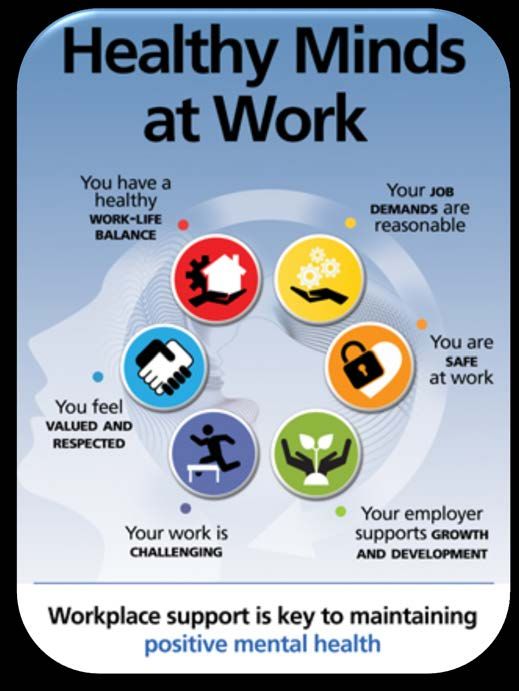
Top Classification Units by Claim Count
STD/LTD/Fatal Claims, 2015 - 2019
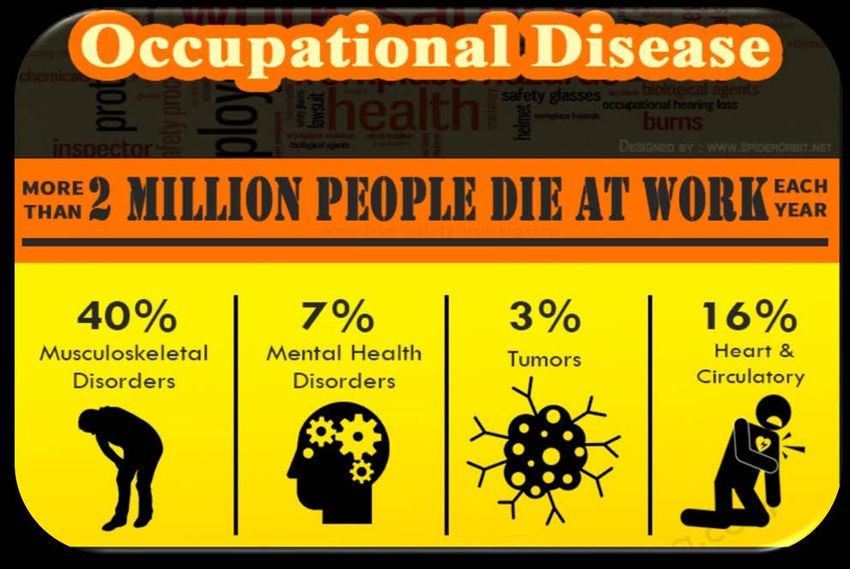
Classification Units # of Claims % of Claims
704003 - Oil or Gas Field Servicing 152 36%
721038 - Oil or Gas Pipeline Construction or Repair 133 32%
713018 - Oil or Gas Production 52 12%
704002 - Oil or Gas Drilling 43 10%
767005 - Oil or Gas Transmission (oil or gas pipeline) 33 8%
704009 – Seismic Exploration 7 2%
Total 420 100%
6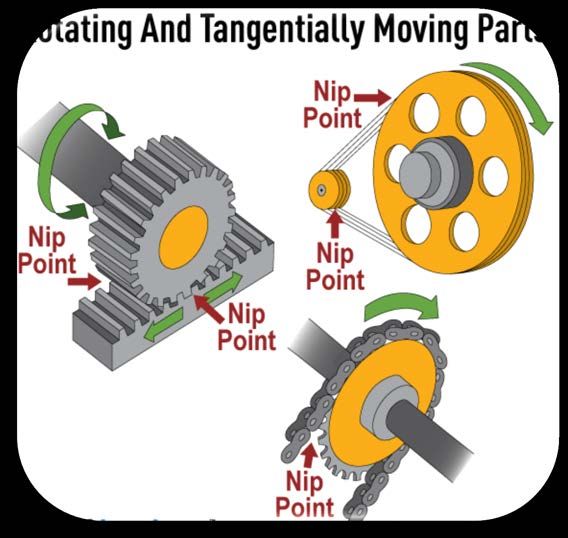
Base Rates
   CU                                                                                          Change from
        CU Description                                   2015 2016 2017 2018 2019
 Number                                                                                        2014 to 2018

704002      Oil or Gas Drilling                             2.09   1.82   2.01   2.15   1.89          -12%

704003      Oil or Gas Field Servicing                      2.06    1.7   1.83   1.81   1.89            4%

704009      Seismic Exploration                             2.22   1.93   2.13   2.43   2.83           16%

713018      Oil or Gas Production                           1.07   1.03   0.91   0.74   0.73           -1%

            Oil or Gas Pipeline Construction or
721038                                                      2.93   3.09    3.1   2.94   2.03          -31%
            Repair
            Oil or Gas Transmission (oil or gas
767005                                                      0.71   0.81   0.94   0.93   1.02           10%
            pipeline)

Additional information on Claims for Work-related Deaths can be viewed online:
http://www.worksafebc.com/insurance/premiums/default.asp

                                                                                                          7
Statistical Overview
Measure                            2015             2016             2017           2018           2019 Total/Average

STD/LTD/Fatal
                                     118                62                  92         71             77          420
Claims
Claim Cost Paid           $11,223,315        $7,811,536       $9,356,832 $8,166,867          $9,002,214    $45,560,762
Work Days Lost                    8,660             6,956            6,553         5,280           7,874       35,323
Injury Rate*                         0.4               0.3              0.4           0.3            0.4           0.4
Person Years**                   18,415           13,266           18,630         14,898          16,650       16,372
Return to Work
                                    35%              25%              33%            26%            33%          30%
(
Injury Rate Trend
Industry               2015   2016   2017   2018   2019
Selected Industry(s)    0.4    0.3    0.4    0.3    0.4
All BC                  2.2    2.2    2.2    2.2    22

                                                          9
Claims and Employment Trends
Selected Industry(s)    2015     2016     2017     2018     2019
Time-loss Claims          77       46       72       51        61
# of Person Years      18,415   13,266   18,630   14,898   16,650

                                                                    10
Complete Duration
2015 2016 2017 2018 2019
Complete Selected
Duration
Selected Selected Selected Selected Industry(s
Industry(s) All BC Industry(s) All BC Industry(s) All BC Industry(s) All BC ) All BC
< 6 Months 67 46,314 34 45,744 59 47,910 39 48,693 41 49,666
6-12 Months 13 2,328 15 2,356 3 2,490 10 2,674 4 3,115
12-24 Months 7 894 9 834 3 884 6 979 2 1,142
>=24 Months 242 6 228 2 246 3 227 6 278
Total Claims 87 49,778 64 49,162 67 51,530 58 52,573 53 54,201
Completed Duration summary year is based on the latest STD payment year for the claims with wage loss payment ended.
11High Duration
High Duration Measures 2015 2016 2017 2018 2019 Total/Average
High Duration Claims 29 35 17 22 21 124
Claims Ending Wage loss Payment 87 64 67 58 53 329
% High Duration Claims 33% 55% 25% 38% 40% 38%
High Duration summary year is based on the latest STD payment year for the claims with wage loss payment
ended.
12Return to Work (RTW) RTW Claims, 2015 - 2019 RTW Selected Industry(s) All BC
Top 10 Occupations
STD/LTD/Fatal Claims, 2015 - 2019
                       Occupation Type                       # of Claims    % of Claims

Oil and gas drilling, servicing and related laborers                   56           13%
Oil and gas well drilling and related workers and services
                                                                       53           13%
operators
Construction trades helpers and laborers                               30            7%

Transport truck drivers                                                30            7%
Oil and gas well drillers, servicers, testers and related
                                                                       26            6%
workers
Contractors and supervisors, oil and gas drilling and
                                                                       21            5%
services
Petroleum, gas and chemical process operators                          19            5%

Heavy equipment operators (except crane)                               16            4%

Steamfitters, pipefitters and sprinkler system installers              16            4%

Other                                                                153           36%

Total                                                                420          100%

                                                                                          14
Age and Gender
STD/LTD/Fatal Claims, 2015 - 2019
Female Male Total
Age
# of Claims % of Claims # of Claims % of Claims # of Claims % of Claims
15 to 24 3 1% 54 13% 57 14%
25 to 34 8 2% 113 27% 121 29%
35 to 44 2 0% 79 19% 81 19%
45 to 54 7 2% 72 17% 79 19%
55 to 64 5 1% 58 14% 63 15%
65+ 19 5% 19 5%
Total 25 6% 395 94% 420 100%
15Top 10 Accident Types
STD/LTD/Fatal Claims, 2015 – 2019
Accident Type # of Claims % of Claims
Overexertion 65 15%
Fall on Same Level 56 13%
Struck By 51 12%
Fall from Elevation 40 10%
Involuntary motion 25 6%
Caught In 22 5%
Exposure to Noise 20 5%
MVI 20 5%
Exposure to Heat, Cold 19 5%
Other 102 24%
Total 420 100%
16Accident Types
STD/LTD/Fatal Claims, 2015 - 2019
Work Days
Top 5 Accident Types SLF Claims Percent Top 5 Accident Types Percent
Lost
Overexertion 65 15% Struck By 4,955 14%
Fall on Same Level 56 13% Overexertion 4,672 13%
Struck By 51 12% MVI 4,214 12%
Fall from Elevation 40 10% Fall from Elevation 3,765 11%
Involuntary motion 25 6% Fall on Same Level 3,190 9%
Other 183 44% Other 14,527 41%
Total 420 100% Total 35,323 100%
Top 5 Accident Types Claim Cost Paid Percent
Struck By $7,795,552 17%
Fall from Elevation $4,930,877 11%
Exposure to Heat, Cold $3,841,738 8%
MVI $3,524,731 8%
Fall on Same Level $3,110,456 7%
Other $22,357,409 49%
Total $45,560,762 100%
17Top 5 Injury Types
STD/LTD/Fatal Claims, 2015 - 2019
Injury Type # of Claims % of Claims
Other Strains 114 27%
Fractures 74 18%
Back Strain 44 10%
Contusion 26 6%
Concussion 21 5%
Other 141 34%
Total 420 100%
18Injury Types
Work Days
Top 5 Injury Types Percent
Lost
Fractures 31%
10,891
STD/LTD/Fatal Claims, 2015 - 2019
Other Strains 24%
8,310
Top 5 Injury Types SLF Claims Percent
Back Strain 7%
Other Strains 114 27% 2,472
Fractures 74 18% Concussion 6%
2,156
Back Strain 44 10%
Contusion 26 6% Heat Burns 5%
1,807
Concussion 21 5% Other 27%
9,687
Other 141 34%
Total 420 100% Total 100%
35,323
Top 5 Injury Types Claim Cost Paid Percent
Fractures $12,805,020 28%
Other Strains $6,333,661 14%
Heat Burns $3,426,473 8%
Concussion $2,656,476 6%
Back Strain $2,017,325 4%
Other $18,321,807 40%
Total $45,560,762 100%
19Top 5 Source of Injury & Body Part
STD/LTD/Fatal Claims, 2015 - 2019
# of % of # of % of
Source of Injury Body Part
Claims Claims Claims Claims
Working Surfaces 82 20% Wrist, Fingers & Hand 51 12%
Bodily Motion 47 11% Back 47 11%
Metal items 40 10% Ankle, Toe & Feet 47 11%
Vehicles 36 9% Knee 40 10%
Boxes, Containers 21 5% Shoulders 36 9%
Other 194 46% Other 199 47%
Total 420 100% Total 420 100%
20Serious Injury Claims
Accident Types SI Claims Percent Injury Types SI Claims Percent
Struck By 24 22% Fractures 51 46%
Fall on Same Level 20 18% Concussion 9 8%
Caught In 12 11% Amputation 7 6%
Fall from Elevation 11 10% Heat Burns 6 5%
Exposure to Heat, Back Strain 5 5%
7 6%
Cold
Other 33 30%
Other 37 33%
Total 111 100% Total 111 100%
Between 2015 and 2019, there were 111 serious injury* claims in the selected industry(s). Serious
injuries represent 36% of the claims and account for 91% of the claims cost paid to date in the selected
industry(s).
*Serious Injuries include time-loss claims that represent either a serious medical diagnosis, or a potentially-serious medical diagnosis with a
long recovery period of 50+ days paid (10+ weeks off work). Serious Injuries also include all work-related death claims.
21Long Recovery Sprains and Strains Claims
Top 5 Accident Types LRSS Claims Percent Top 5 Injury Types LRSS Claims Percent
Overexertion 21 43% Other Strains 43 88%
Fall from Elevation 5 10% Back Strain 4 8%
Fall on Same Level 5 10% Bursitis & Related 1 2%
Involuntary motion 5 10%
Carpal Tunnel
1 2%
Syndrome
Other Bodily Motion 5 10%
Total 49 100%
Other 8 16%
Total 49 100%
Between 2015 and 2019, there were 49 LRSS* claims in the selected industry(s). LRSS injuries
represent 16% of the claims and account for 17% of the claims cost paid to date in the selected
industry(s).
*Long Recovery Sprain and Strain Injury Claims include all short-term disability and long-term disability claims with a first payment in the
year of injury or in the three months following the year of injury that meet one of the following criteria: 1) Sprain or strain medical diagnosis
2) Rheumatism medical diagnosis 3) Carpal Tunnel medical diagnosis with a long recovery period (50 or more work days lost within the year
of injury or in the three months following the year of injury) and excluding work-related death claims.
22Accepted Claims for Work-related Deaths
Accepted year between 2015 and 2019
Work-related deaths
9 100%
Traumatic injury Disease
4 44% 5 56%
Motor vehicle Other traumatic Asbestos-related
Other disease
incident injury disease
1 11% 3 33% 4 44% 1 11%
Additional information on Claims for Work-related Deaths can be viewed online:
https://public.tableau.com/profile/worksafebc#!/vizhome/Work-relatedDeathsDashboard/Thedashboard
23Claim Costs by Benefit Type
Total claim cost regardless of injury year Total claim cost in the year of injury
$1,751,384
$5,855,558 4%
$3,885,642 $856,337
13%
9% 15%
$2,070,825 $102,225
36% 2%
$15,148,685
33%
$18,919,494
42%
$2,064,171
36%
$606,798
11%
Fatality Vocational Rehabilitation Health Care
Long-Term Disability Short-Term Disability
Between 2015 and 2019, the total claim cost paid regardless of year of injury was $46 million, and
from this, $6 million was paid for costs within the year of injury. The most common benefit type paid
was Long-term Disability with a total claim cost of $19 million, 42% of the total cost; the most
common benefit type paid for claim costs in the year of injury was Short-term Disability, with a total
claim cost of $2 million, or 36% of the total cost.
24Prevention Activity
*Other Contacts include consultations, education presentations, notice of incidents, compliance agreements, and various
other documents conducted by an authorized WorkSafeBC employee.
25Prevention Orders
26Top Regulations Cited by which Industry
Group
27Penalties and Warning Letters
28Field Issues
Injuries and Fatal’s and near misses
of concern
29Waste Recovery and Fires
- Oil and Gas waste treatment/recovery site.
Dumping/mixing and off loading product and
the waste ignited and a fire ensued that caused
considerable damage to the facility. This is the
3rd like incident in NEBC since 2013.
- In the last 2 incidents no workers were seriously
injured, 1st incident workers suffered serious
burn injuries
- Issues of concern include: lack of adequate
waste profile sheets (what is being delivered to
site-what is created when products are mixed),
control of ignition sources, effective monitoring
of flammable vapours that can be generated in
the work process. OHSR 4.3(2), 23.5(2), WCAct
21(2)(a) (Three key parties-owner of the
waste, transporter and receiver)
30Kinetic Energy control
Workers were in the process of attempting to
remove a nut from an out of service pump jack
to use on another unit. In the process of
attempting this work a large metal beam
(walking beam) fell onto the worker, crushing
the worker who suffered fatal injuries.
Issues of concern: failing to conduct an
adequate risk assessment prior to doing the
work-hazard id- the pump jack had previously
had parts scavenge from the unit, no records
kept of what had been removed from any
items in the bone yard, Failing to recognize the
need to control kinetic energy (the force of
gravity that all objects will fall to the ground
OHSR 23.5(2), 3.3(b), 10.2, WCAct 21(1),
24.2(b)
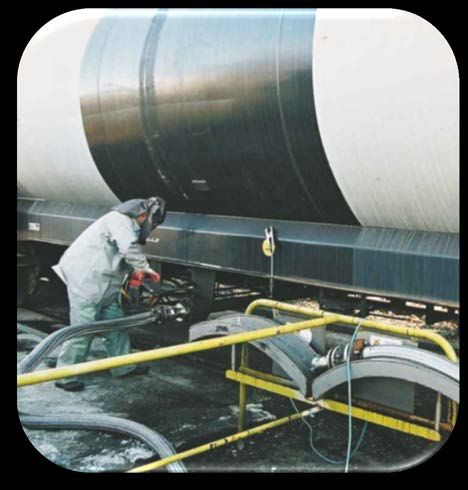
31Tank Cleaning-Fire and Explosion
Workers cleaning the interior of a P-
tank using a vac/steam combo unit.
Flammable vapours were generated
followed by a flash fire and explosion
several workers suffered injuries and
were transported to hospital.
Issues of concern: risk
assessment-fire and explosion, LEL
monitoring, control of ignition
sources, ensuring workers safety at
the site, proper supervision and PC
oversight (ensuring that work onsite
is compliant with the OHSR and
WCAct) OHSR 23.5(2), 5.27(3),
5.31(c), WCAct 24(1)(a) and
21(1)(a)
32Inspections of Equipment
Workers were on the floor of a Service rig
when the center floor sliding door dislodged.
This caused 2 workers to un-expectantly fall
to the ground 10 feet below the floor. One
worker suffered multiple serious injuries, with
a delay in transport to a hospital as first aid
was not available onsite.
Issues of concern: inspection and
maintenance of equipment in accordance with
the manufacturers manual (no manual for the
service rig), guard rails not in place to protect
from falling, no first aid/first aid assessment
OHSR 3.16(1)(a)(b), 3.20(b), 4.55,
14.12(2) WCAct 21(1) and 24(1)(b)
33Field Issues
Compliance Issues
34Compliance-COVID 19 Safety Plans
https://www.worksafebc.com/en/resources/he
alth-safety/checklist/covid-19-safety-
plan?lang=en WCAct 21 Employer Obligations
35Compliance-Flash Fires and
Controlling Ignition Sources
Recent incidents with Flash fires/explosion indicate
that the RISK is not being adequately assessed
and Controlled:
-This means assessing all potentials for the
generation and release of flammable vapours.
-What are you planning to do (scope of work)? What
permits are needed, what equipment is needed?
-How could vapours be generated and released
during the work?
-How are we monitoring the hazardous atmosphere?
What type of monitors are we using?
-Are ignition sources being adequately controlled
including static electricity?
-This is more than checking the boxes on a
checklist!
OHSR 23.5, 5.27, 5.28 WCAct 21 and WCAct 24
36Compliance-Grounding and Bonding
Oil and Gas sites-critical issue to controlling
ignition sources.
-Employers and workers knowing the difference
-Providing appropriate grounding onsite whether
a temporary work location of permanent
-Testing the ground-different instrument from
checking bonding-also proper calculations required
to ensure the ground is adequate).
-Location of the bonding attachment points so
that operators are fully aware of where and how to
attach their equipment to the grounding and bonding
system
-Operators then validating the bond-testing with an
appropriate OM meter (also what is the maximum
allowable resistance when testing)
-Training / education of workers in what’s
required and what are hazards associated with failing
to do a proper job and what to do if the system at
site is not adequate. OHSR 5.27, 5.28, 23.6, 23.74
37Compliance-Use of Scavengers to
clean produced water of H2S
-Toxic Process Gases – CHLO2 (Chlorine
Dioxide) being used in a cleaning scavenger
for H2S liquids (Part 6.116-6.127 for
CHLO2 Risk assessment, specific ECP,
Training/Education, separate enclosure
for CHLO2 equipment, ventilation,
emergency shutdown and ventilation,
Monitors and Alarms)
As well as using Hydrogen Peroxide-
H2O2 is highly reactive when mixed with
organics, Oxidizer and when mixed with
Oxygen is highly flammable AND EXPLOSIVE
OHSR 23.5 risk assessment and
appropriate SWP
38Compliance-Safe Guarding and radio use
Safe Guarding of equipment to
protect workers from the inadvertent
contact with moving, rotating spinning
parts. Continues to be an issue when
guards have not been installed or are
removed and not replaced back onto
Fracing equipment.
This is also a concern with access to
running and hoisting lines on service
rigs, swabbing units and drilling rigs
In the perforating side of completions –
the radio frequency assessment
requirements have changed BUT still
require the Operator to follow the
defined assessment process on site.
OHSR 12.2 and 21.61-62
39Compliance-First Aid Services, Supplies
and Equipment and Written Procedures
What is needed based upon a site assessment of the
workplace (5 items to consider) and no less than the
Tables in Schedule 3-A
The employer MUST also develop written First aid
Procedures (6 items displayed in conspicuous locations at
the worksite). Note: special procedures are required if air
transport is the primary means of transport
See the complete Guidelines for First aid:
https://www.worksafebc.com/en/law-policy/occupational-
health-safety/searchable-ohs-regulation/ohs-
guidelines/guidelines-part-
03#998F33D891434F2D915491565A68E1F9
-see the conditions for using an MTC in place of a
dressing station or First aid room, also an MTC MUST
be attached to the vehicle chassis OHSR 3.16-17 &
17.10
40Compliance- Contractor Service
Providers brought to site
-Producers what is in place to ensure that when you
bring contract services to site that they are compliant
with the OHSR and WCAct requirements? and are you
providing adequate hazardous product SDS information.
Common areas of deficiency include:
-High pressure line restraint not adequately anchored at
both ends, not restraining the full length the piping, lack
of documentation available for workers for the
installation and inspection of the restraint system
-Emergency egress systems on service and drilling rigs-
certifications and inspections out of date, not anchored or
installed correctly
-SDS for produced water being used i.e. to kill a well
WCAct 24,25, OHSR 23.69, 23.39
41Field Issues
Occupational Disease
42Occupational Disease – ECP’s
-Occupational Disease continues to expand in impacts
and scope (occupational Disease fatalities continue to
eclipse traumatic injury claims each year-As of
November 147 fatalities- 61 traumatic injury and
86 Disease))
-Areas for monitoring and ECP development:
Silica, Lead, Hydrocarbon based drilling fluids, Diesel
Exhaust, Benzene, Mercury, Hearing Loss, NORMS,
H2S and all designated substances require ECP’s
MSI risk assessments and risk control OHSR 4.47-53
(Part 5.48-5.59 for an outline of what is required
around site surveys, monitor and development
of ECP’s)
-Toxic Process Gases – CHLO2 (Chlorine Dioxide)
being used in a cleaning scavenger for H2S liquids
(Part 6.116-6.127 for CHLO2 Risk assessment,
specific ECP, Training/Education, separate
enclosure for CHLO2 equipment, ventilation,
emergency shutdown and ventilation, Monitors
and Alarms)
43Oil and Gas Initiative 2021-2023
What will WSBC be focusing upon over
the next 3 years?
44Oil and Gas 2021-2023 Initiative
Focus
Background
Problem
The Oil and Gas Initiative is designed to focus on areas
of concern within the oil and gas sector that is
generating their serious injury claims.
Primary goal
Prevent serious and fatal injuries in the following
areas:
-Fire and explosions across the oil and gas sector, with
particular emphasis upon well servicing and waste
disposal
-Control of hazardous energy
-Restraint/Engineering of Temporary flow piping systems
-Manual free falling
-Pipeline construction
-Occupational exposures
45Oil and Gas 2021-2023 Initiative
Focus Continued
Focus
3 year time frame
-Conduct targeted inspections within the
focus areas
-Support the development tools and
resources relating to safe work procedures
in high risk operations
-Support and partner with Energy Safety
Canada and industry trade associations to
see that their initiatives align with
mitigation measures relating to strategic
focus areas
-Deliver key messaging and information to
employers and workers through the HSA
and sector associations
46Additional Areas to Consider
47Additional areas of consideration and
Planning
-Process safety/engagements were initiated 3
years ago and will continue for the next 3 years-
several new Producers are part of the program
-New MSI Team, all WSBC Officers have received
additional training in this area-expect to asked
about your companies Ergonomic program (lots of
strain/stress and repetitive motion injuries
-Bullying and Harassment and Discriminatory
action programs-continued complaints what is
your program like, training of workers and
supervisors
-Mental Health Safety-fastest growing area of
Occupational Health concerns and issues, what are
you doing to support your workers especially in
these trying time? (resources and training
being developed for employers).
48What’s changing in 2021?
49Regulation Review and Changes 2021
-First aid changes to the tables 3-A (preliminary
consultation underway)
Public Hearings (virtual where held
December 10, 2020
-Part 6 Restricted intervals for pesticide
application
-Part 8 High visibility apparel
-Part 8 Safety headgear
-Part 16 Mobile equipment
-Part 18 Traffic control
-Part 21 Blasting
Recommendations to the BOD in February 2021
and implemented in July 2021
50Questions?
51You can also read