You Down With OTT? An Overview Of The Competitive Video Ecosystem - Video Advertising Bureau
←
→
Page content transcription
If your browser does not render page correctly, please read the page content below
You Down With OTT?
 An Overview Of The Competitive Video
 Ecosystem

                                        1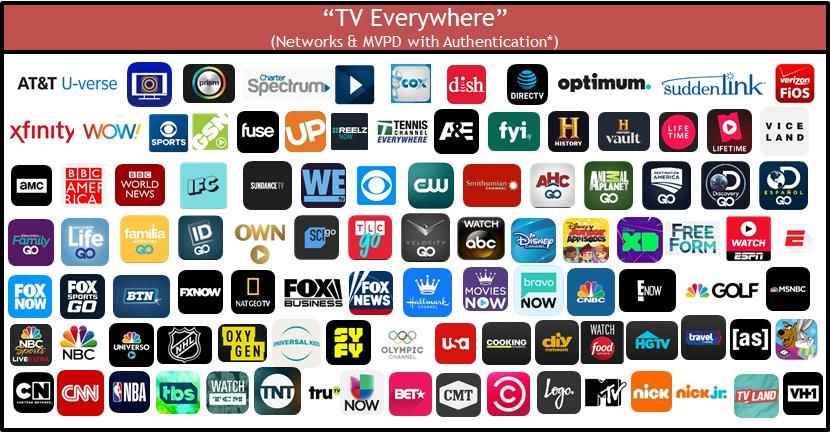
Contents
                    The Math of OTT              3

                    Definition                   4

                    OTT Video Landscape          5-15

                    Connected Devices            16-23

                    Streaming Services           24-35

                    Consumer Behaviors           36-43

                    Key Takeaways                44

                    Glossary                     45

                    Contact Information          46

VAB: YOU DOWN WITH OTT?

                                                         2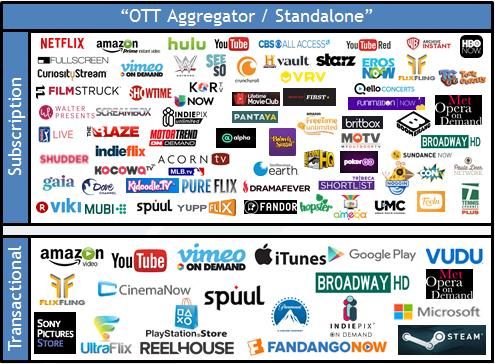
The Math Of OTT: A Formula Of Addition, Not Subtraction
With 820 million connected video devices in the U.S. and hundreds of different streaming
  services, the over-the-top video ecosystem is about delivering more to the consumer

• More…Distribution
     •   71% of Internet users use an OTT service at least once a month

• More…Content
     •   Consumers have a voracious appetite for content, in fact a large majority of OTT HHs (70%) also have a
         multichannel subscription

• More…Choice
     •   Nearly one-third of OTT subscribers hold 3 or more means of accessing OTT content, an eight-fold increase over
         just the last two years

• More…Convenience
     •   45% of streamers say it’s important to them to be able to watch TV programs “on the go” while 81% say it’s
         important to them to watch TV programs whenever they want

• More…Advertising Opportunities
     •   Currently, advertising comprises 45% of all online video revenue and is projected to grow to almost 60% over
         the next 10 years
     •   65% of people who use a second screen while streaming have looked up info on a product that’s been advertised
         in a TV show

VAB: YOU DOWN WITH OTT?

                                                                                                                          3
What is OTT (Over-The-Top)?

Definition: Premium long form video content that is streamed over the internet
through an app or device onto a TV (or PC, Tablet, or Smartphone) without requiring
users to subscribe to a wired cable, telco or satellite TV service.
OTT consumer journey: OTT leverages “apps” to stream video content to a television via an internet connection. Viewing
methods include: (a) on-demand where viewers select and watch content when they choose to, and (b) linear/live – where
viewers watch at the particular time, channel or app (live content is streamed in real time as the event happens)

   Viewers stream TV content from the Internet     All major networks are making their     Content is streamed and plays
       using either a smart TV, OTT device,          content available either through    instantly in full-screen and can be
  connected game console or IP set top box that    their own app or via a virtual MVPD      ad-supported if the network
   received signals from digital video ad server           like Hulu or Sling TV                       chooses

  VAB: YOU DOWN WITH OTT?

                                                                                                                               4
The Math of OTT: More Distribution Points

      Currently, 71% of Internet users use an OTT service

VAB: YOU DOWN WITH OTT?

                                                             5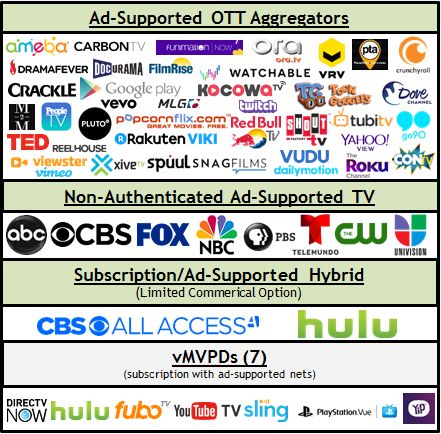
OTT Content Can Be Accessed In Several Ways And Falls
                     Primarily Into Two Groups

                       Devices                            Streaming Services
         Connected Devices allows the streaming       Means of access are ad-supported,
             of specific, selected content.           subscription, rental, or purchase.

        Devices include Streaming Players/Sticks   These access points can take the form of
          (e.g. Roku/Amazon Fire TV), Gaming       OTT content aggregators (e.g. Crackle),
           Consoles (e.g. PS4), and Smart TVs            Standalone apps (e.g. ABC),
                                                        or virtual MVPDs (e.g. Sling).

  Streaming services and devices often work in tandem. For example, streaming
   Hulu content from a mobile phone to the television via Google Chromecast.

 VAB: YOU DOWN WITH OTT?

Source: SNL Kagan
                                                                                              6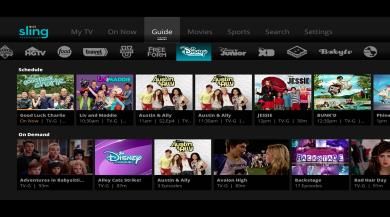
OTT Streaming Services & Devices Ecosystem

VAB: YOU DOWN WITH OTT?

Note: the above reflects a representative sampling of services and devices and each segment does not necessarily reflect every offering available.
                                                                                                                                                     7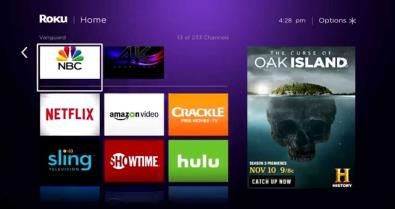
OTT Households Are Growing And Currently Represent 14.1MM
                                                   Homes…

                                                                    OTT-only Household Trend

                            20

                                                                                                                                                                                        OTT households nearly
                            15                                                                                                                                                            tripled since 2013
     U.S. Households (M)

                            10

                             5

                             0
                                     2013                              2014                             2015                             2016                             2017
                                                                                                 OTT-only HHs

Source: 2017 S&P Global Market Intelligence, Kagan. 2013 and 2014 data as of June 2014; 2015-2017 data as of June 2017.
-   OTT HHs (multichannel substitutes) are HHs that rely on unmanaged Internet or OTT delivery to view television shows or movies in lieu of a traditional multichannel subscription.
    Figure does not include subscribers to virtual service providers such as Sling TV, PlayStation Vue or DIRECTV NOW.
-    Virtual service providers (vMVPDs) characterized by unmanaged (Internet/OTT) delivery of aggregated live, linear networks and on-demand content similar to a traditional
    multichannel offering for a monthly subscription
                                                                                                                                                                                                                8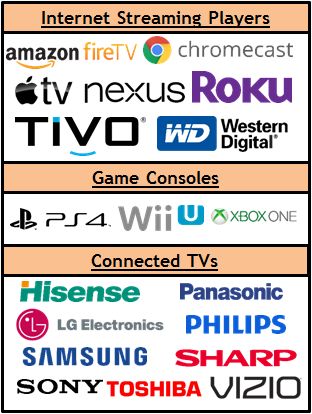
…Which Translates To 11% Of TV Homes; However
    Three-Fourths Of All Homes Are Multi-channel TV Households
                                                                           Video HHs by Method of Delivery
                                                                                                                         2017
                                                                     OTA HHs
                                                          vMVPDs-only 12%
                                                             HHs
                                                              3%

                                             OTT-only HHs
                                                 11%

                                                                                                                                                                                       ¾ of homes are multi-channel
                                                                                                                               Multichannel                                                                      TV HHs
                                                                                                                                   HHs
                                                                                                                                   74%

Source: 2017 S&P Global Market Intelligence, Kagan. As of June 2017.
(1) Multichannel HHs - Residential multichannel household count excludes DBS overlap created by households taking multiple multichannel subscriptions. Includes cable, DBS, telco and other multichannel
platforms. Excludes commercial subs. (2) OTT HHs (multichannel substitutes) are HHs that rely on unmanaged Internet or OTT delivery to view television shows or movies in lieu of a traditional multichannel
subscription. Figure does not include subscribers to virtual service providers such as Sling TV, PlayStation Vue or DIRECTV NOW. (3) Virtual service providers (vMVPDs) characterized by unmanaged
(Internet/OTT) delivery of aggregated live, linear networks and on-demand content similar to a traditional multichannel offering for a monthly subscription. (4) OTA HHs - Households that receive broadcast network
signals using an antennae. Does not exclude households that also access OTT content
                                                                                                                                                                                                                          9
While MVPD Subscriptions Will Maintain A Large Share Of HHs,
OTT-Only HHs Are Projected To Grow to 17.9MM Homes By 2021
Projected Video HHs by Method of Delivery
CAGR %
100
90
U.S. Households (M)
80 -2.4%
70
60
50
40
30 +8.2%
20 +1.9%
10
+43.4%
0
2016 2017 2018 2019 2020 2021
Multichannel HHs OTT-only HHs vMVPD-only HHs OTA HHs
Source: 2017 S&P Global Market Intelligence, Kagan. As of June 2017.
(1) Multichannel HHs - Residential multichannel household count excludes DBS overlap created by households taking multiple multichannel subscriptions. Includes cable, DBS, telco
and other multichannel platforms. Excludes commercial subs. (2) OTT HHs (multichannel substitutes) are HHs that rely on unmanaged Internet or OTT delivery to view television
shows or movies in lieu of a traditional multichannel subscription. Figure does not include subscribers to virtual service providers such as Sling TV, PlayStation Vue or DIRECTV NOW.
(3) Virtual service providers (VSPs) characterized by unmanaged (Internet/OTT) delivery of aggregated live, linear networks and on-demand content similar to a traditional multichannel
offering for a monthly subscription. (4) Households that receive broadcast network signals using an antennae. Does not exclude households that also access OTT content
10By 2021, About 200 Million US Consumers Will Use An OTT
Video Service Or Connected TV At Least Once Per Month
US OTT Video Service Users and Connected TV Users
Millions and % of Internet Users
72.1% 72.7% 73.1%
70.8% 71.5%
66.9% 67.5% 67.9%
65.3% 206.4 209.5
193.3
61.5% 198.6 202.8
194.4
188.1 191.6
181.5
168.1
2017 2018 2019 2020 2021
OTT Video Service Users Connected TV Users
# = users in millions
Source: eMarketer, July 2017, “Programmatic Connected TV And OTT Video Advertising: Automation, Audience Attracts Digital And TV Ad Buyers.”. Note: “OTT
Video Service Users” reflect individuals of any age who watch video via any app or website at least once per month that provides steaming video content over
the internet and bypasses traditional distribution; examples include HBO Now, Hulu, Netflix and YouTube. “Connected TV Users” reflect individuals of any age
who use the internet through a connected TV at least once per month. 11The Math of OTT: More Access To More Content
70% of OTT households also have an MVPD subscription
VAB: YOU DOWN WITH OTT?
12The Overwhelming Majority Of OTT Users Also Have A Cable or
Satellite Subscription
Looking at those households that have OTT capabilities, 70% also have a Cable+ subscription
Over-the-Top (OTT) Households by Service Type
Streaming
Only
15%
Streaming +
Cordless
Antenna
15% Cable Plus
70%
VAB: YOU DOWN WITH OTT?
Source: ComScore Total Home Custom Reporting, U.S. December 2016; comScore Single-Source (TV+OTT) Custom Reporting, U.S. December 2016 13Because Of This, Streaming - While Growing - Still Only
Accounts for a Fraction of Total “TV” Viewing Hours…
Streaming’s Share of TV Viewing Hours
A18-49, October 2017
11%
8%
5%
2015 2016 2017
VAB: YOU DOWN WITH OTT?
Source: Pivotal Research Analysis of Nielsen Data, A18-49, October 2017; Roku Inc. 14…Even As The Number Of People That Access TV Content From
The Internet Grew By Double-Digits Over The Last Two Years
Do You Access TV Content From The Internet?
87% 90%
86%
82%
77% 76% 78%
65% 63%
53%
49% 48%
P18-24 P25-34 P35-49 P55+
2015 2016 2017
VAB: YOU DOWN WITH OTT?
Source: PwC Consumer Intelligence Services video survey, 2017 from “Consumer Intelligence Series: I stream, you stream” Report.
© 2017 PricewaterhouseCoopers LLP, a Delaware limited liability partnership. 15Let’s Take A Closer Look At Connected Devices…
Devices / Platforms
Internet Streaming Players e.g.
Game Consoles e.g.
Connected TVs e.g.
VAB: YOU DOWN WITH OTT?
16There Are Currently 820 Million Connected Video Devices in the U.S.
The largest segments are smartphones (30% of devices), smart TVs (20%) and PCs/Home Media Servers (15%)
U.S. Connected Devices, 2015 – 2021 (in millions)
300
250 2017 device ownership
Streaming
200 Media
Players
Blu-ray 6%
Players
6%
150 Streaming
Sticks
4%
Game Smartphone
users
100 Consoles
8% 30%
Tablets in
use
50 11%
Smart TVs
20%
Desktop/Laptop/Home
Media Servers
0 15%
2015 2016 2017 2018 2019 2020 2021
Smartphone Users Smart TVs
Tablets in Use Home Media Servers/Desktop/laptop
Game Consoles Streaming Sticks
Source: 2017 SNL Kagan, a division of S&P Global Market Intelligence. As of October 2017.
(1) Gaming Consoles - Includes the subset of game consoles that are connected to the Internet such as Sony Playstation, Microsoft Xbox and Nintendo Wii.
(2) Streaming Media Players - Includes installed base of Internet-connected standalone set-tops designed for online video viewing such as AppleTV, Roku,
GoogleTV, standalone TiVo and other devices. (3) Streaming Sticks - Includes installed base of streaming sticks designed for online content viewing such as
Chromecast and the Roku Streaming Stick, often in conjunction with another connected device. (4) Tablets - Excludes enterprise tablets in use.
17The Preferred Device For Viewing Streaming Video Is The Television,
Either On a Smart TV Or On A TV Using a Streaming Media Player
Preferred method of watching online video
0% 5% 10% 15% 20% 25% 30%
On Smart TV 25%
On TV using SMP 25%
On TV using gaming console 11%
On computer 11%
On TV using computer 9%
On TV using DVD/Blu-ray player 6%
On tablet 4%
On smartphone 3%
Other 1%
No OTT TV viewing 6%
% internet adults
VAB: YOU DOWN WITH OTT?
Source: 2017 SNL Kagan, a division of S&P Global Market Intelligence
18Viewing On-Demand Video Content Is A Top Activity Across All
Connected TV Devices
% of % of % of
Streaming Media Gaming Console
Smart TV Activities Device Device Device
Owners Player Activities Owners Activities Owners
Viewed SVOD Content 70% Viewed SVOD Content 71% Played a Video Game 73%
Viewed Live Sports 53% Viewed TV Everywhere Viewed SVOD Content 43%
41%
Content
Viewed TV Everywhere Streamed Online Music 22%
43% Streamed Online Music 34%
Content
Viewed TV Everywhere
Viewed Premium Network Viewed Premium Network 21%
34% 29% Content
VOD VOD
Viewed Premium Network 19%
Streamed Online Music 30% Viewed Live Sports 27% VOD
Download Online Rented 27% Download Online Rented 26% Download Online Purchased 16%
Video Video Video
Download Online Purchased 24% Download Online Purchased 25% Download Online Rented 16%
Video Video Video
Played a Video Game 22% Played a Video Game 14% Viewed Live Sports 15%
Purchased Physical Goods 13% Purchased Physical Goods 12% Purchased Physical Goods 11%
VAB: YOU DOWN WITH OTT?
Source: 2017 SNL Kagan, a division of S&P Global Market Intelligence, excludes “watching TV” for smart TV activities.
19The Majority Of Long-Form Streaming Occurs On A Television
Viewers prefer watching longer-form streaming video on a TV, and secondly on Mobile devices
Primary type of service used to access video, by device
Television 80% 10% 3% 7%
Mobile Device 58% 22% 3% 17%
Desktop/Laptop 42% 34% 4% 21%
0% 20% 40% 60% 80% 100%
Subscription Streaming (e.g. Netflix, Hulu) video-sharing (e.g. YouTube, Vine)
Digital Download or Rental (e.g. iTunes, Google Play) Other
VAB: YOU DOWN WITH OTT?
Source: eMarketer, 2016
20Streaming Sticks/Boxes & Smart TVs Are The Most Popular
“Primary” OTT Streaming Devices
Streaming Sticks/Boxes Smart TVs
38 MM 28 MM
U.S. HHs U.S. HHs
with this device with this device
73% 63%
Of these HHs used their Of these HHs used their
streaming stick/box to smart TV to stream OTT
stream OTT
VAB: YOU DOWN WITH OTT?
Source: comScore Connected Home and OTT Intelligence, U.S., April 2017 21It’s Projected That Smart TVs Will Widen Their Penetration
Gap Against The Next Largest Connected TV Device By 2021
US Connected TV Users, by Device
2016-2021 (Millions)
2016 2017 2018 2019 2020 2021
Smart TV 62.0 81.2 94.2 102.6 109.3 114.3
Connected Game Console 58.4 62.8 66.5 69.5 71.8 73.9
Roku 32.6 38.9 45.9 53.4 61.3 69.0
Google Chromecast 29.9 36.9 44.5 51.8 58.3 64.6
Amazon Fire TV 26.3 35.8 44.1 50.8 56.1 62.6
Blu-Ray Player 29.0 29.0 29.0 29.0 29.0 29.0
Apple TV 19.9 21.3 22.6 23.6 24.4 25.2
Total 152.7 168.1 181.5 188.1 191.6 194.4
VAB: YOU DOWN WITH OTT?
Source: eMarketer, August 2017, “Programmatic Connected TV And OTT Video Advertising: Automation, Audience Attracts Digital And TV Ad Buyers.”
Note: reflects individuals of any age who use the internet through a connected TV at least once per month. The total reflects the US connected TV user
universe, therefore figures by device are not additive for the total.
22Roku Has The Highest Cumulative Weekly Time Spent Out
Of All The Devices Available For Viewing OTT Content
Aggregate Weekly Hours (MM)
of Internet Video Consumption by Device
118
78 76
65 64
38 37
27 24
17
Roku Amazon Fire PlayStation Samsung Xbox Vizio Smart LG Smart TV Apple TV Google Sony
TV/Stick Smart TV TV Chromecast
VAB: YOU DOWN WITH OTT?
Source: Kantar Millward Brown / Roku Streaming Leadership Study, Q3 2017; Roku Inc. 23The Math of OTT: More Choice
There’s been an eight-fold increase recently in people
who have access to 3+ OTT subscription services
VAB: YOU DOWN WITH OTT?
24Let’s Take A Closer Look At Streaming Services…
Streaming Services
OTT Aggregators e.g.
Standalone TV e.g.
(Authenticated Apps)
Subscription e.g.
(with “limited commercial” option)
VAB: YOU DOWN WITH OTT?
2550% Of Internet Users Access An Online Video Subscription
Once A Week, Followed Closely By Network TV Apps
Frequency of Viewing
56%
50% 49%
32% 30%
25%
21% 22% 22%
18% 19%
6%
Online Video Subscription Network TV Apps Pay-TV VOD TV Everywhere
(e.g. HBO, Showtime)
Frequently (1x+ wk) Infrequently (less than 1x wk) Never
VAB: YOU DOWN WITH OTT?
Source: 2017 SNL Kagan, a division of S&P Global Market Intelligence; U.S. 3Q 2017 Survey Summary Report. Base: 2,526 A18+ internet users.
Q. Over the past three (3) months, how often did you perform these activities?
26Nearly One-Third of OTT Subscribers Hold 3 or More Means of
Accessing OTT Content, An Eight-Fold Increase vs. Just 2 Years Ago
Number of Subscriptions*
70%
60%
60%
50% 45%
40% 36% 37%
34% 32%
31%
30%
21%
20%
10%
4%
0%
2015 2016 2017
One Two Three or more
*’Subscriptions’ includes Netflix, Hulu, Amazon, Network Standalones (HBO Now, CBS All Access, etc.) and vMVPDs (Sling,
YouTube TV, etc)
VAB: YOU DOWN WITH OTT?
Source: Hub “What’s TV Worth”, April 2017; Survey fielded to 2,026, ages 16-74 27However, Consumers Actually Only Watch Half Of The
Subscription Video Services That They Have Access To
Number of Services Available to Me* vs. Number of Services I Watch Regularly
Average Number of Services Number of Services Available
Regularly Watched to Me
Traditional Pay
2 3.8
TV Subscribers*
2.8 5.3
Cord Trimmers
Cord Cutters + 1.8 3.2
Cord Nevers
VAB: YOU DOWN WITH OTT?
Source: PwC Consumer Intelligence Services video survey, 2017 from “Consumer Intelligence Series: I stream, you stream” Report.
© 2017 PricewaterhouseCoopers LLP, a Delaware limited liability partnership. *Due to heightened levels of password sharing, PwC reports on access to a
service rather than subscription to a service. * Reflects Cable/Telco/Satellite subscribers
28Millennials And Gen X Are Most Likely To Be Streaming OTT
Content And Are Highly Likely To Have 4+ Subscriptions
The # of subs is highest for the
SVOD usage is seen across all generations,
younger generations
with heaviest concentration in Millennials &
Gen Z % SOV users by generation
100%
13%
26% 24%
28% 80% 41%
22%
(72 26%
Index) 44% 60% 31%
(129
28%
Index) 40%
27% 65%
(100
43% 51%
Index) 20%
32%
0%
Gen Z/Millennials Gen X Boomers/Seniors 1 Paid OTT video 2 Paid OTT Video 3 Paid OTT Video 4+ Paid OTT Video
Subscription Subscriptions Subscriptions Subscriptions
Indices are to population size of each generation
Gen Z/Millennials Gen X Boomers/Seniors
VAB: YOU DOWN WITH OTT?
Source: 2017 SNL Kagan, a division of S&P Global Market Intelligence
29Currently, The Four Major OTT Streaming Services (+YouTube)
Average 2+ Hours Of Usage Per Viewing Day Per User Household
However, this usage pales in comparison to ad-supported TV which averages
7.9 hours of usage per active TV household everyday
Viewing Metrics for Selected Over-the-Top (OTT) Streaming Services
Monthly Viewing Days per Hours per HH per Viewing Day
Household
2.9
12.3
9.9 2.2 2.1 2.0
8.1
5.5
VAB: YOU DOWN WITH OTT?
Source: comScore OTT Intelligence, U.S., April 2017; streaming usage based on consumption across TV-connected devices only. TV data based on Nielsen
Npower R&F Time Period Report, 4/1/17 – 4/30/17, Total Day, Live+SD, Households, ad-supported cable TV + broadcast TV. 30While Netflix Leads Major OTT Streaming Services In HH
Penetration, It Trails Hulu For The Most Streaming Hours Per HH
Selected Over-the-Top (OTT) Streaming Services by Wi-Fi Household
Penetration & Engagement
35.0
Avg. Monthly Viewing Hrs. per HH
30.0
25.0
20.0
15.0
10.0
5.0
0.0
0% 5% 10% 15% 20% 25% 30% 35% 40% 45%
Wi-Fi Household Penetration
How to read the chart: Netflix is watched in 40% of Wi-Fi households for an average of 27 hours
per month per user household
Source: comScore OTT Intelligence, U.S., April 2017; streaming usage based on consumption across TV-connected devices only.
31The Four Major OTT Streaming Services Account For Nearly
80% Of OTT Viewing Time For OTT Households
Share (%) of Total OTT Viewing Hours
Other
21%
40%
7%
14%
18%
VAB: YOU DOWN WITH OTT?
Source: comScore OTT Intelligence, U.S., April 2017; streaming usage based on consumption across TV-connected devices only. 32Among The Major SVOD Services, Acquired Network TV Content
Is As Popular, Or Even More Popular, Than Original Series
Content Types Viewed on Netflix, Hulu & Amazon Prime Video
77%
74% 74% 74% 73% 74%
66% 64%
58% 57% 57%
54% 52%
49%
40%
Netflix Hulu Amazon Prime Video
Recent Movies Older Movies Network TV Series: Prior Seasons Network TV Series: Current Season Original TV Programs
(released within (released over 2
past 2 years) years ago)
VAB: YOU DOWN WITH OTT?
Source: Kagan, a media research group within the TMT offering of 2018 S&P Global Market Intelligence. Results from an online consumer survey conducted in
September 2017, base: Netflix users – 1,480; Hulu users – 549; Amazon Prime Video users – 938. Question: You indicated that you currently have a
subscription to (online video service). Which of the following types of video content do you view from the service?
33Collectively, Subscribers Also Find Acquired Network TV Series
To Be More Enjoyable Than Original Content On These Services
Content Most Enjoyed on Netflix, Hulu and Amazon Prime Video
Other Other Other
(1%) (1%) (2%)
Original TV Movies
Programs (17%) Original TV
Movies
Original TV (29%) (17%) Programs
Programs (25%) Movies
(35%) (44%)
Acquired TV
Acquired TV
Acquired TV Network
Network
Network Series
Series
Series (64%)
(29%)
(35%)
Source: Kagan, a media research group within the TMT offering of 2018 S&P Global Market Intelligence. Results from an online consumer survey conducted in
September 2017, base: Netflix users – 1,480; Hulu users – 549; Amazon Prime Video users – 938. Question: Of the content you view on (online video service)
which would you say is the content you most enjoy viewing? “Movies” include recent movies (released within past 2 years) and older movies (released over 2
years ago). “Acquired Network TV Series” includes prior seasons of network TV series and current season of network TV episodes. 34Furthermore, Within Households That Watch Network TV Apps,
These Apps + Hulu Account For More Viewing Time Than Netflix
10.1 MM HHs TV Network App Households:
Share (%) of Total OTT Viewing Time
That View Network TV Apps via OTT
(on connected-TV devices)
19% 14%
Network TV Apps
Hulu
Netflix
7% 16%
YouTube
Amazon Video
14%
All Other
29%
VAB: YOU DOWN WITH OTT?
Source: comScore OTT Intelligence, U.S., April 2017. *Network TV App definition excludes premium networks such as HBO and Showtime and Skinny Bundles
such as Sling. HHs based on consumption across TV-connected devices only.
35The Math of OTT: More Convenience
81% of streamers say it’s important to them to watch
TV programs whenever they want
VAB: YOU DOWN WITH OTT?
36Many Consumers Don’t Keep Their Video Subscriptions After
Signing Up For A Trial Or Just Share Someone Else’s Passwords
The #1 Reason for Ending a Subscription is “I didn’t use it enough” (29%)
55% 33% 81%
of Cord Trimmers “Regularly” Don’t Typically Keep the of Focus Group Participants Report
Subscribe to a Trial Version of a Subscription After the Trial That They Share Passwords With
Service Period is Over Friends and Family
VAB: YOU DOWN WITH OTT?
Source: PwC Consumer Intelligence Services video survey, 2017 from “Consumer Intelligence Series: I stream, you stream” Report.
© 2017 PricewaterhouseCoopers LLP, a Delaware limited liability partnership. 37OTT Is About Convenience, Both From A Time & Place
Perspective
Flexibility on when and where they watch is important for OTT viewers
Important to me when watching TV programs
100%
90%
% Agree & index vs. Adults
81%
80% 72%
70%
60%
50% 45%
40% 33%
30%
20%
10%
110 150 Index vs. A18+ Pop 103 115 Index vs. A18+ Pop
0%
Watch on the Go Watch whenever I want
Connected Device Owners Streamers
VAB: YOU DOWN WITH OTT?
Source: Gfk MRI 2016 Doublebase: Definitions – Connected Device Owner (Television Sets Most Recent Purchase-Features Smart TV/Internet Connectable or
Internet Video Devices for TV Household Owns Any or All Household Owns Video Game Systems); Streamers Definition (Watch TV through a TV network’s
app or through another online streaming TV service.) 38Additional Research Continues To Validate That Convenience Is The
Primary Reason Why Viewers Use OTT Services
Reasons to use OTT Services
Convenience 33.9%
It's cheaper 29.0%
Ability to watch certain TV shows and whole seasons 29.0%
Viewers use
No commercials or ads 28.5% OTT to get
23.5% access to
Ability to watch TV/movies on your computer
more content
Better selection 22.3%
Easier to find what you're looking for 18.3%
I enjoy the original content offered by these services 18.0%
Ability to watch TV/movies on your smartphone 17.6%
Ability to watch TV/movies on your tablet 15.6%
I don't use monthly subscription services or third party rental services 37.7%
VAB: YOU DOWN WITH OTT?
Source: TiVo Q3 2017 Online Video and Pay TV Trends Report, December 2017
39OTT Viewers Also Crave Quality, Engaging TV Programming
They also demand quality programming and access to a variety of library TV content
Important to me when watching TV programs
100%
87%
% Agree & index vs. Adults
90% 83% 83% 80%
79%
80% 71% 74%
70% 63%
60%
50%
40%
30%
20%
10% 101 106 106 125
101 106 119 107 Index vs.A18+ Pop
0%
Quality of TV Programs Variety of Programs Access to Older TV Episodes Access to TV series not on air
Connected Device Owners Streamers
VAB: YOU DOWN WITH OTT?
Source: Gfk MRI 2016 Doublebase: Definitions – Connected Device Owner Definition - (Television Sets Most Recent Purchase-Features Smart TV/Internet
Connectable or Internet Video Devices for TV Household Owns Any or All Household Owns Video Game Systems); Streamers Definition - (Watch TV
through a TV network’s app or through another online streaming TV service.)
40The Math of OTT: More Advertising Opportunities
65% of people who use a second screen while streaming
have looked up info on a product advertised in a TV show
VAB: YOU DOWN WITH OTT?
41Advertising Is The Largest Revenue Model Across The
Entire Online Video Ecosystem & Its Share Is Projected To Grow
Currently, advertising comprises 45% of all online video revenue and is projected to
grow to almost 60% over the next 10 years
Online Video Revenues
(All video, not only OTT video)
43,597
$ in Millions 41,890
38,536 40,219
35,215
36,884
31,679 33,585
29,739 25,580
27,414 22,646 24,091
24,657 19,830 21,217
17,104 18,458
20,684 14,449 15,759
13,166
11,901
10,015
2016 2017 2018 2019 2020 2021 2022 2023 2024 2025 2026 2027
Subscription Purchase Rental Advertising
VAB: YOU DOWN WITH OTT?
Source: 2017 SNL Kagan, a division of S&P Global Market Intelligence; “The State of the Online Video Delivery,” 2017 Edition
42Two-Thirds Of Second Screen Users Look Up Info About A
Product They See While Streaming A TV Show
% of Those Using A Second Screen for Each of the Following
(Frequently + Sometimes)
Look Up Who's Acting/Playing in the Show/Game 81%
Communicate with Friends Unrelated to Show/Game 78%
Look Up Info on Product Featured on a Show 65%
Look Up Info on Product Advertised in a Show 65%
Communicate with Friends About the Show/Game 64%
Post on Social Media About the Show/Game 50%
Browse Merchandise Related to the Show 46%
Check Fantasy Sports Stats 44%
Purchase Merchandise Related to the Show/Game 35%
VAB: YOU DOWN WITH OTT?
Source: PwC Consumer Intelligence Services video survey, 2017 from “Consumer Intelligence Series: I stream, you stream” Report.
© 2017 PricewaterhouseCoopers LLP, a Delaware limited liability partnership. 43So, Are You Down With OTT?
If you like more then you should be since the math of OTT is a formula of addition, not subtraction.
Consumers have a voracious appetite for video content, especially for premium multiplatform TV, and they
can satisfy their cravings anywhere, anytime through a wide selection of devices and streaming services
71% of Internet users use an OTT service
Distribution at least once a month
65% of people who use a second
Advertising 70% of OTT HHs also have a
screen while streaming have looked
Content
Opportunities multichannel subscription
More…
up info on a product advertised in a
TV show
81% of streamers say it’s important to them
to watch TV programs whenever they want
Convenience Choice Eight-fold increase in people who have
access to 3+ OTT subscription services
VAB: YOU DOWN WITH OTT?
44Glossary
• Ad Networks: provides an outsourced sales capability for publishers and a means to aggregate inventory and audiences from
numerous sources in a single buying opportunity for media buyers
• Buy-Side / Demand-Side Platforms (DSPs): a technology platform that provides centralized & aggregated media buying from
multiple sources including ad exchanges, ad networks and sell side platforms, often leveraging real-time bidding capabilities of
these sources
• Multichannel HHs: Households that subscribe to a service offering multiple channels of video programming through either a cable,
telco or satellite provider (often referred to as an MVPD – multichannel video programming distributor)
• OTA HHs (Over-The-Air): Households that receive broadcast network signals using an antennae; it does not exclude households
that also access OTT content
• OTT (Over-The-Top): Premium long form video content that is streamed over the internet through an app or device onto a TV (or
PC, Tablet, or Smartphone) without requiring users to subscribe to a wired cable, telco or satellite TV service
• OTT Aggregator: wide range of content from multiple providers delivered over the internet through one streaming source (i.e.
Netflix) without the involvement of a traditional multichannel subscription
• OTT-only HHs: Households that rely on unmanaged Internet or OTT delivery to view television shows or movies in lieu of a
traditional multichannel subscription
• Sell-Side / Supply-Side Platforms (SSPs): a technology platform that provides outsourced media selling and ad network
management services for publishers. The business model resembles that of an ad network in that it aggregates ad inventory
however they serve publishers exclusively and does not provide services for advertisers
• Standalone App: content from one provider delivered directly to the consumer over the internet without the involvement of a
traditional multichannel subscription (i.e. CBS All Access)
• TV Everywhere (TVE): apps that allow viewers to access content over the internet by logging in with their Multichannel Video
Programming Distributor (MVPD) subscription user name / password authentication (i.e. Watch ESPN, Fox Now)
• vMPVDs (virtual multichannel video programming distributor): unmanaged (Internet/OTT) delivery of aggregated live, linear
networks and on-demand content similar to a traditional multichannel offering for a monthly subscription
VAB: YOU DOWN WITH OTT?
45For More Information Visit Us Online
TheVAB.com
Follow us:
@VideoAdBureau
Like us:
facebook.com/VideoAdvertisingBureau
46You can also read