A Correlation Analysis of Normalized Indicators of Citation - MDPI

Page created by Douglas Weaver
 
CONTINUE READING
A Correlation Analysis of Normalized Indicators of Citation - MDPI
publications
Article
A Correlation Analysis of Normalized Indicators
of Citation
Dmitry M. Kochetkov
 Peoples’ Friendship University of Russia (RUDN University), Moscow 117198, Russia;
 kochetkov_dm@rudn.university or kochetkovdm@hotmail.com; Tel.: +7-925-865-64-45
                                                                                                   
 Received: 31 July 2018; Accepted: 11 September 2018; Published: 13 September 2018                 

 Abstract: Recently, more and more countries are entering the global race for university competitiveness.
 On the one hand, global rankings are a convenient tool for quantitative analysis. On the other hand,
 their indicators are often difficult to quickly calculate and they often contradict each other. The author
 of this paper hoped to use widely available indicators for a quick analysis of the University’s
 publication strategy and opted for the normalized citation indicators available in the SciVal analytical
 tool, namely, Source Normalized Impact per Paper (SNIP) and Field-Weighted Citation Impact
 (FWCI). The author demonstrated the possibility of applying the correlation analysis to the impact
 indicators of a document and a journal on a sample of social and humanitarian fields at Peoples’
 Friendship University of Russia (PFUR, “RUDN” in Russian). A dot diagram of university (or
 country) documents was used to form a two-factor matrix (SNIP and FWCI) that was further divided
 into four quadrants. Such an analysis illustrated the present situation in that discipline. An analysis
 of the RUDN university publications revealed problems and prospects in the development of social
 sciences and humanities. A serious problem observed was that high-quality results were often
 published in low-impact journals that narrowed the results’ potential audience and, accordingly,
 the number of citations. A particular attention was paid to the application of the results in practice.

 Keywords: normalized indicators; correlation analysis; Source Normalized Impact per Paper; SNIP;
 Field-Weighted Citation Impact; FWCI

1. Introduction
      Recently, programs for increasing the global competitiveness of universities funded by national
and local governments have been launched almost all over the world. In Russia, the project called
5-100 [1] was launched in 2013. At present, 21 leading Russian universities are participating in the
project; Peoples’ Friendship University of Russia (PFUR, “RUDN” in Russian) is among them. The main
goal of the Project is to have five Russian universities enter the TOP-100 of global university rankings.
QS World University Rankings (QS) [2] and Times Higher Education World University Rankings
(THE) [3] are among the most popular ranking systems. Both rankings use a normalized citation
indicator for the calculation. Without going deeper into the calculation methodology, suffice it to say
that they differ significantly. The issues regarding normalizing citations for subject areas are discussed
in the article by Waltman and van Eck [4] and Waltman [5]. For this study, it was necessary to select the
metrics to be used for analysis within the framework of university research management. Accordingly,
the author limited the metrics to those available in widely distributed analytical packages that did not
require large additional computations. Thus, the choice fell on Field-Weighted Citation Impact (FWCI)
and Source Normalized Impact per Paper (SNIP), which are available in SciVal from Elsevier.
      Source Normalized Impact per Paper (SNIP) was introduced by Professor Henk Moed [6] at the
Centre for Science and Technology Studies (CTWS), University of Leiden. After receiving a dose of
criticism, Professor Moed revised the indicator [7]. It measured the impact of scientific publications

Publications 2018, 6, 39; doi:10.3390/publications6030039                 www.mdpi.com/journal/publications
A Correlation Analysis of Normalized Indicators of Citation - MDPI
Publications 2018, 6, 39                                                                              2 of 9

through contextual citation weighting based on the total number of citations in the subject field using
Scopus data. In other words, as stated by the CTWS, “SNIP corrects for differences in citation practices
between scientific fields, thereby allowing for more accurate between-field comparisons of citation
impact” [8]. SNIP is calculated by dividing the number of citations per paper in the journal by the
citation potential in the subject field. The study [9] confirmed that from various journal metrics, SNIP
has the greatest correlation with expert ratings (for example, Excellence in Research for Australia
(ERA) [10]), possibly due to its normalized nature.
      Field-Weighted Citation Impact (FWCI) is the ratio between the actual number of citations received
by a publication set and the average number of citations received by all other similar publications.
The latter is referred to as the expected number of citations. Similar publications refer to the same
discipline of the same type and the same age. FWCI is a Snowball Metric [11]. FWCI is measured by
dividing the number of citations received by the publication by the average number of citations to
publications in the database published in the same year of the same type and within the same subject
category. When several publications are considered, the ratio between the actual and average citations
for each publication is first calculated. FWCI is calculated then as a mean value. Publications can also
be assigned to more than one subject category.
      The use of quantitative indicators overcomes the subjectivity of peer review, although it is incorrect
to rely solely on numbers [12]. Ideally, FWCI should be equal to SNIP. In reality, of course, such a
situation is unlikely, but the perfect positive correlation between these two indicators takes place as a
direction for improvement of the university’s publication strategy. The author decided to focus on the
problem area for RUDN (and for Russian universities in general) in the social sciences and arts and
humanities. It is no secret that Russian universities are most often associated with the natural sciences.
Moreover, given the low citation potential in these areas, only a few citations can affect the value of
the normalized indicator rather significantly. The research question was how to use the SNIP and
FWCI indicators together for the purposes of research management and advancement in international
rankings in terms of social sciences and humanities. The author also tried to illustrate the application
of this study’s results in practice.

2. Materials and Methods
     The calculation method of normalized citation indicators enables comparative analysis not only
with universities but also with university groups because the value is taken not as a sum, but as a
mean. Therefore, three objects were compared: Project 5-100 in general, the Chinese “League of nine”
or C9 [13] and Universities of Excellence (Germany) [14]. The analysis was conducted on six subject
fields and areas (Arts and Humanities; Business, Management, and Accounting; Decision Sciences;
Economics, Econometrics, and Finance; Psychology; Social Sciences). Only documents of the “article”
type were selected for analysis due to the following:

1.     It is most often in journal articles that the approved original results of scientific research
       are published;
2.     It is very difficult to estimate the level of “non-journal” sources because of the lack of data.

     First, the Pearson correlation coefficient was calculated for these subject fields and areas.
The correlation coefficient, like the covariance analysis, characterizes the degree to which the two
variables “change together”. Unlike the covariance analysis, the correlation coefficient is scaled in such
a way that its value does not depend on the units in which the variables of the two measurements are
expressed. Any value of the correlation coefficient should be in the range from −1 to +1 inclusive.
Correlation analysis elucidates whether data sets are associated in magnitude, namely, higher values of
one data set are associated with larger values of the other set (positive correlation) or, on the contrary,
low values of one set are associated with larger values of the other (negative correlation), or data of
two ranges are not related in any way (zero correlation).
A Correlation Analysis of Normalized Indicators of Citation - MDPI
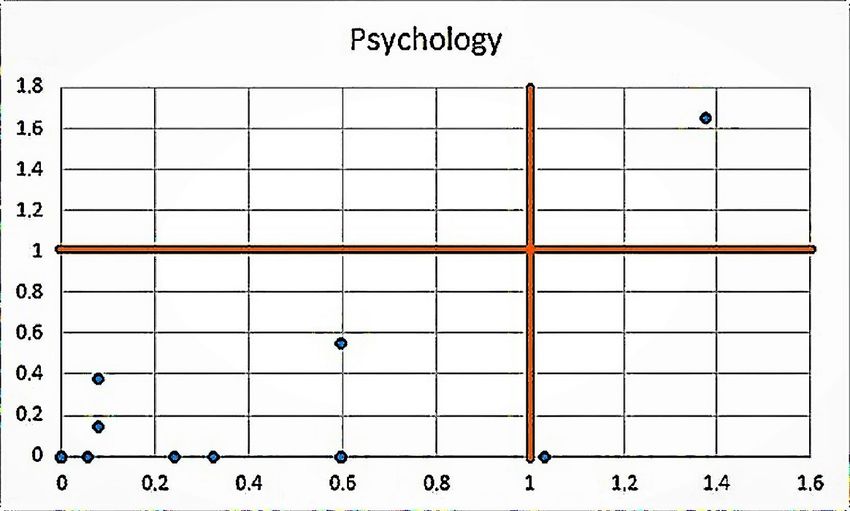
Publications 2018, 6, 39                                                                                                           3 of 9
Publications 2018, 6, x FOR PEER REVIEW                                                                                            3 of 10

      Next,
      Next, aa dot
               dot diagram
                   diagram was
                            was constructed
                                constructed for
                                            for publications
                                                publications in
                                                              in each
                                                                 each of
                                                                       of the
                                                                          the subject
                                                                              subject areas
                                                                                      areas based
                                                                                              based on
                                                                                                    on FWCI
                                                                                                       FWCI
and
 and SNIP indicators. Lines were then drawn through points 1 (global average citation potential) on
     SNIP   indicators. Lines were  then drawn  through  points   1 (global average   citation  potential) on
the  abscissa  and  y-axis. Thus, a two-factor  matrix was obtained,    which   produced     four quadrants
 the abscissa and y-axis. Thus, a two-factor matrix was obtained, which produced four quadrants (see
(see Figure
 Figure 1). 1).

      Figure 1.1. Two-factor matrix
      Figure                 matrix for
                                     for the
                                          the distribution
                                               distribution of
                                                             of articles
                                                                 articleswithin
                                                                          withinthe
                                                                                 thesubject
                                                                                     subjectfield/area.
                                                                                              field/area. Source:
      author’s
      author’s own
                own development.
                    development.

        Quadrant
        Quadrant11“Everything
                        “Everythingis is    bad”.
                                              bad”. TheTheresults  of the
                                                              results   of university
                                                                            the universityresearch   are published
                                                                                                research    are publishedin low-impact
                                                                                                                                   in low-
journals    and   receive   low   citation    rates.   The   problem     lies  in the  field  of either
 impact journals and receive low citation rates. The problem lies in the field of either relevance or    relevance     or   importance
of   the research
 importance      of theagenda
                          research asagenda
                                       such, or       in the
                                                  as such,   or fact  that
                                                                 in the  factresearch      in this
                                                                               that research         field
                                                                                                 in this    is still
                                                                                                         field  is stillininits
                                                                                                                              its infancy
                                                                                                                                   infancy
(at
 (at the
      the university).
          university).
        Quadrant
        Quadrant22“Rising“RisingStars”.
                                    Stars”. The Thequality
                                                      qualityof publications
                                                                  of publications in this
                                                                                        infield
                                                                                            this exceeds   the level
                                                                                                  field exceeds      theoflevel
                                                                                                                             the sources
                                                                                                                                     of the
in which     they  are   published.     It is time   for  the  university     to  make    a shift
 sources in which they are published. It is time for the university to make a shift towards the   towards    the  next    level.    Such  a
                                                                                                                                       next
situation
 level. Such is often   related
                a situation    is to an underestimation
                                  often                           by scientists ofbytheir
                                           related to an underestimation                       own capabilities.
                                                                                          scientists  of their own capabilities.
        Quadrant
        Quadrant 3 “Everything is fine”. High-quality research results are
                     3  “Everything        is fine”.    High-quality       research     results   are published
                                                                                                       published in   in high-quality
                                                                                                                           high-quality
sources.    Authorities     must   strive    to ensure     that most   publications
 sources. Authorities must strive to ensure that most publications of the university      of the  university   are  in   thisare
                                                                                                                               quadrant.
                                                                                                                                    in this
        Quadrant
 quadrant.          4  “Overestimation”.          University     scientists   overestimate      the  quality  of  their   publications,
whichQuadrant
          does not correspond          to the level University
                       4 “Overestimation”.               of sources inscientists
                                                                           which they       are published.
                                                                                         overestimate      theDespite
                                                                                                                   qualitytheofreview their
procedure,
 publications, sometimes
                   which does suchnotsituations
                                         correspond ariseto because   of the
                                                              the level         poor work
                                                                           of sources         of the they
                                                                                         in which     reviewer   or editor, orDespite
                                                                                                           are published.            under
the
 the influence     of the status
       review procedure,            of the researcher
                                sometimes                    or the university
                                                 such situations      arise because itself.of Most  likely,
                                                                                              the poor      the of
                                                                                                         work    university
                                                                                                                     the reviewer  shouldor
revise   its research    agenda,    at  least   in  part.
 editor, or under the influence of the status of the researcher or the university itself. Most likely, the
        The point
 university         E represents
               should     revise itsthe     balance:
                                      research          the citation
                                                    agenda,            level
                                                                at least       of the document and the source coincide and
                                                                          in part.
at theThesame point E represents the balance: the citation level given
                time   correspond       to  the  citation    potential   in  the   of thesubject
                                                                                            documentfield/area
                                                                                                         and the  insource
                                                                                                                      a givencoincide
                                                                                                                                   period.
and at the same time correspond to the citation potential in the given subject field/area in a given
3. Results
period.
     Table 1 shows the results of the correlation analysis.
3. Results
       Table 1 shows the results of the correlation analysis.
A Correlation Analysis of Normalized Indicators of Citation - MDPI
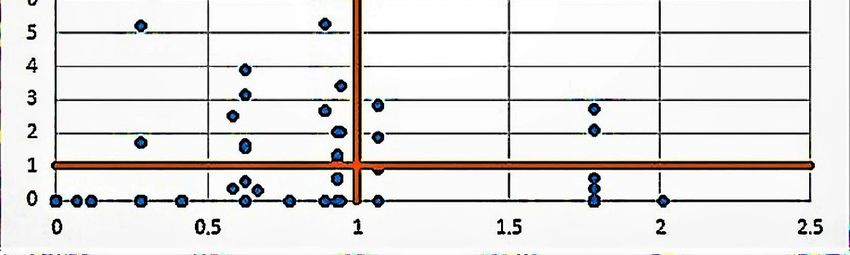
Publications 2018, 6, 39                                                                                                  4 of 9

Publications 2018, 6, x FOR PEER REVIEW                                                                               4 of 10
      Table 1. Comparative correlation analysis of the normalized citation of articles and the normalized
      Table 1.indicator
      impact    Comparative
                        of the correlation
                               source *. analysis of the normalized citation of articles and the normalized
      impact indicator of the source *.
                                                                                                   Universities of
                                         RUDN            Project 5-100         League C9
         Subject Field/Area                                                                         Excellence
                                                                                                     Universities of
                                      RUDN                Project 5-100            League С9
       Subject Field/Area         N **    Corr ***      N **     Corr ***    N **     Corr ***     N ** Excellence
                                                                                                           Corr ***
        Arts and Humanities      N 97
                                   **    Corr ***
                                           −0.01      N2743
                                                         **      Corr
                                                                   0.11***      N
                                                                             1788 **    Corr ***
                                                                                       0.12           N
                                                                                                   4718 **    Corr ***
                                                                                                            0.33
     Arts and Humanities          97      −0.01       2743          0.11        1788       0.12       4718       0.33
       Business, Management,
    Business,                      83       0.19        1324       0.32      3763      0.35        2355     0.36
           andManagement,
                Accounting        83       0.19       1324          0.32        3763       0.35       2355       0.36
        and Accounting
          Decision Science         29       0.76        412        0.33      2697      0.28        1444     0.31
       Decision Science           29       0.76        412          0.33        2697       0.28       1444       0.31
      Economics, Econometrics,
   Economics, Econometrics,        116      −0.04      2292        0.2       2503      0.39        2473       0.4
             and Finance          116      −0.04      2292          0.2         2503      0.39        2473          0.4
          and Finance
             Psychology
          Psychology              1515       0.63
                                            0.63        616
                                                      616          0.36
                                                                    0.36     1742
                                                                                1742   0.330.33    61266126    0.4 0.4
            Social Sciences
         Social Sciences           264
                                  264       − 0.02
                                           −0.02       5891
                                                      5891         0.13
                                                                    0.13     6231
                                                                                6231    0.4 0.4    87638763   0.360.36
      * Source:
         Source:author’s
                  author’sown owndevelopment based
                                   development     on theon
                                                 based    data
                                                            thefrom
                                                                 dataSciVal,
                                                                       from Elsevier
                                                                             SciVal, B.V. ** Number
                                                                                      Elsevier B.V. of
                                                                                                    ** observations.
                                                                                                       Number of
      *** Correlation coefficient.
      observations. *** Correlation coefficient.

     It became obvious from the table that Peoples’ Friendship University of Russia falls behind the
correlation coefficient
              coefficient obtained
                           obtainedforforthe
                                          thecompared
                                               comparedgroups
                                                           groupsofofuniversities
                                                                       universities   (including
                                                                                   (including       Project
                                                                                                 Project      5-100)
                                                                                                           5-100) in
in almost
almost   all all areas
             areas     of social
                    of social      sciences
                               sciences  andand   humanities.
                                               humanities.       An especially
                                                             An especially         critical
                                                                             critical       situation
                                                                                       situation   is in isArts
                                                                                                            in Arts
                                                                                                                and
and  Humanities,
Humanities,          Economics,
                 Economics,   and and   Social
                                    Social      Sciences
                                            Sciences  in in  general.High
                                                          general.     Highrates
                                                                              ratesfor
                                                                                    forDecision
                                                                                         Decision Sciences
                                                                                                     Sciences and
Psychology do not seem valid due to the      the extremely
                                                 extremely small
                                                              small sample
                                                                    sample size.
                                                                             size. In turn, the universities of
Project 5-100 fall behind Chinese and German colleagues. German Universities of Excellence are the
leaders in
         invirtually
             virtuallyall
                       allsubject
                           subjectareas. AnAn
                                    areas.   analysis of the
                                                analysis     situation
                                                          of the       in each
                                                                 situation      subject
                                                                            in each      area isarea
                                                                                      subject    presented    below
                                                                                                      is presented
in moreindetail.
below      more detail.

3.1. Arts and
3.1. Arts and Humanities
              Humanities
     The
     The first
          firstattempt
                attempttoto
                          build  a point
                             build       chart
                                    a point    in the
                                             chart  inArts
                                                       the and
                                                           ArtsHumanities   field was
                                                                 and Humanities       unsuccessful
                                                                                   field           because
                                                                                         was unsuccessful
of several “runouts”  (e.g., one article obtained  FWCI   44.39, see Figure 2).
because of several “runouts” (e.g., one article obtained FWCI 44.39, see Figure 2).

      Figure 2.
      Figure 2. Distribution
                 Distribution of
                              of publications
                                 publications in
                                              in the
                                                 the Arts
                                                     Arts and
                                                          and Humanities
                                                               Humanities subject
                                                                          subject category
                                                                                  category by
                                                                                           by Field-Weighted
                                                                                              Field-Weighted
      Citation Impact
      Citation  Impact (FWCI)
                        (FWCI) andand Source
                                      Source Normalized
                                               Normalized Impact
                                                            Impact per
                                                                    per Paper
                                                                        Paper (SNIP).
                                                                               (SNIP). Source:
                                                                                       Source: author’s
                                                                                                author’s own
                                                                                                         own
      development    based  on the data from  SciVal, Elsevier
      development based on the data from SciVal, Elsevier B.V. B.V.

     Therefore, itit was
     Therefore,      was decided
                          decidedtotoremove
                                      removefour
                                               fourextreme
                                                    extremeFWCI
                                                            FWCIvalues,
                                                                 values,  eventually
                                                                        eventually   obtaining
                                                                                   obtaining   a picture
                                                                                             a picture of
of the
the    publication
    publication      distribution
                distribution      (see
                               (see     Figure
                                     Figure 3). 3).
A Correlation Analysis of Normalized Indicators of Citation - MDPI
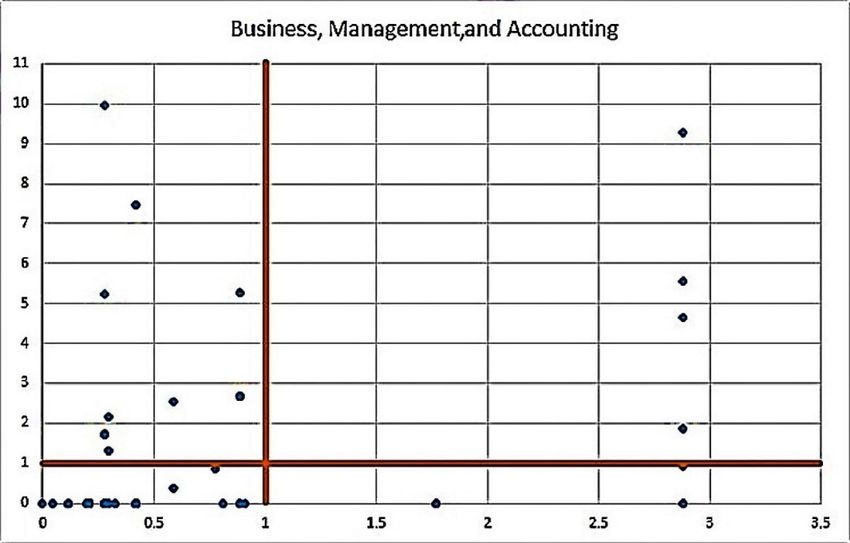
Publications 2018, 6, 39                                                                                                               5 of 9
       Publications 2018, 6, x FOR PEER REVIEW                                                                               5 of 10

       Publications 2018, 6, x FOR PEER REVIEW                                                                               5 of 10

      FigureFigure  3. Distributionofofpublications
               3. Distribution          publications inin  thethe
                                                                Arts andand
                                                                   Arts    Humanities   subjectsubject
                                                                                Humanities      categorycategory
                                                                                                          by FWCI by andFWCI
                                                                                                                          SNIP, and
            excluding  extreme   values. Source:   author’s  own  development     based on the
      SNIP, excluding extreme values. Source: author’s own development based on the data from  data  from  SciVal, Elsevier B.V.
                                                                                                                              SciVal,
      Elsevier B.V.
            Most
            Figurepublications
                    3. Distributionare   in the firstinand
                                     of publications       the second
                                                                Arts andquadrants.
                                                                           Humanities Taking     into account
                                                                                        subject category  by FWCItheand
                                                                                                                      observations
                                                                                                                          SNIP,
      with excluding
             the FWCIextreme
                         extreme values.
                                    valueSource:
                                             which author’s
                                                       were own   development
                                                              removed,            based
                                                                           the main     on the data
                                                                                       problem    wasfrom
                                                                                                       theSciVal,  Elsevier between
                                                                                                            discrepancy     B.V.
      Most publications are in the first and second quadrants. Taking into account the observations
      the selection of sources and the quality of published scientific results. Two out of the four removed
with the FWCI       extreme value
            Most publications            which
                                    are in    the    were
                                                   first andremoved,
                                                               second      the main Taking
                                                                                        problem     was    the discrepancy        between
      publications     were published       in  the   journal   Man in quadrants.
                                                                         India, and another      into
                                                                                                 two inaccount   the observations
                                                                                                          the Pertanika    Journal of
the selection
      with the
      Social     of  sources
                 FWCIand
              Sciences   extreme and   the    quality
                                    value which
                             Humanities.                 of  published
                                                       were removed,
                                             The coverage       of Man inthe scientific
                                                                               main
                                                                             India       results.
                                                                                    in problem
                                                                                       Scopus was    Two    out
                                                                                                  wasdiscontinuedof  the
                                                                                                       the discrepancy    four   removed
                                                                                                                            between
                                                                                                                       in 2017.
publications     were
      the selection    ofpublished
                         sources andinthe    the   journal
                                                quality        Man in India,
                                                          of published             and results.
                                                                            scientific  another     twoout
                                                                                                  Two           thePertanika
                                                                                                          inofthe    four removedJournal of
      publications
Social3.2.
       Sciences    andwere
           Business,          published
                        Humanities.
                       Management,     and  inAccounting
                                          The   the   journal of
                                                 coverage       Man
                                                                  Man in India,
                                                                          in Indiaandinanother
                                                                                        Scopustwo  wasindiscontinued
                                                                                                          the Pertanika Journal
                                                                                                                            in 2017.of
      Social Sciences and Humanities. The coverage of Man in India in Scopus was discontinued in 2017.
            In this subject area, the same problem occurred as in the previous case: one of the publications
3.2. Business, Management, and Accounting
      obtained    FWCI
      3.2. Business,      19.94 (incidentally,
                       Management,     and Accountingit was also published in the Pertanika Journal of Social Sciences and
      Humanities).
      In this subject In Figure
                          area, the4, as  in the
                                       same         case of Arts
                                                 problem            and Humanities,
                                                               occurred                   most of the
                                                                            as in the previous           publications
                                                                                                      case:  one of theare     in the
                                                                                                                            publications
            In this
      first and      subject
                 second        area, thewith
                           quadrants,      samea problem        occurred    as in  the previous case: one of the publications
obtained    FWCI     19.94   (incidentally,       itbig
                                                      wasbias  visible
                                                            also        in the
                                                                  published     first.
                                                                                  in  the Pertanika Journal of Social Sciences and
      obtained FWCI 19.94 (incidentally, it was also published in the Pertanika Journal of Social Sciences and
Humanities). In Figure 4, as in the case of Arts and Humanities, most of the publications are in the first
      Humanities). In Figure 4, as in the case of Arts and Humanities, most of the publications are in the
and second     quadrants, with a big bias visible in the first.
      first and second quadrants, with a big bias visible in the first.

          Figure 4. Distribution of publications in the Business, Management, and Accounting subject category
          by FWCI and SNIP, excluding extreme values. Source: author’s own development based on the data
          from SciVal, Elsevier B.V.
          Figure 4. Distribution of publications in the Business, Management, and Accounting subject category
      Figure 4. Distribution of publications in the Business, Management, and Accounting subject category
          Therefore,
          by FWCI and  inSNIP,
                          this case, the problems
                                excluding            concern
                                          extreme values.     relevance
                                                           Source:       and
                                                                   author’s   significance
                                                                            own            of based
                                                                                 development  the research  itself.
                                                                                                    on the data
      by FWCI and SNIP, excluding extreme values. Source: author’s own development based on the data
          from SciVal, Elsevier B.V.
      from SciVal, Elsevier B.V.
             Therefore, in this case, the problems concern relevance and significance of the research itself.
      Therefore, in this case, the problems concern relevance and significance of the research itself.
A Correlation Analysis of Normalized Indicators of Citation - MDPI
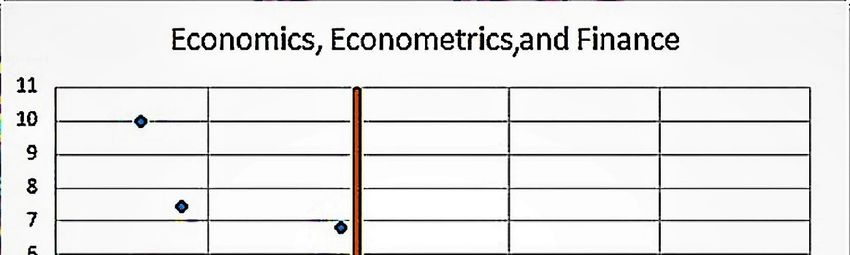
Publications 2018, 6, 39                                                                                                     6 of 9

      Publications 2018, 6, x FOR PEER REVIEW
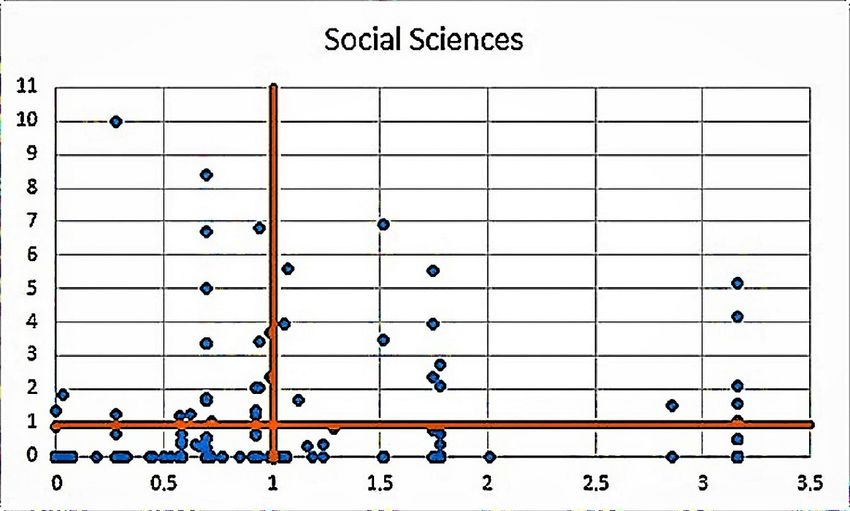
3.3. Decision                                                                                                      6 of 10
      PublicationsSciences
                   2018, 6, x FOR PEER REVIEW                                                                      6 of 10

      As
      3.3.mentioned
      3.3.              above, there are very few publications in this area, and almost all of them are in the
           Decision Sciences
           Decision  Sciences
first quadrant     (see Figure
             As mentioned       5). there are very few publications in this area, and almost all of them are in
                 mentioned above,
                             above,
            As                      there are very few publications in this area, and almost all of them are in
      Basedfirston
      the first     the analysis
                 quadrant          results,
                           (see Figure
                                Figure 5). the development of research in this direction does not seem
      the        quadrant  (see        5).
very promising.
             Based on the analysis results, the development of research in this direction does not seem very
          Based on the analysis results, the development of research in this direction does not seem very
      promising.
      promising.
3.4. Economics, Econometrics, and Finance
      3.4. Economics, Econometrics, and Finance
     3.4.this
          Economics,    Econometrics,    andtwo
                                              Finance
     In       category,     there were             extreme values of FWCI, the first one being the same article as
           In this
the one inInthe     category,
                 category
              this              there
                    category,Business,  were
                                there were     two extreme
                                                     extreme values
                                            Management,
                                               two           values  of FWCI,
                                                                        FWCI, the
                                                               and Accounting
                                                                     of        the(and
                                                                                    firstthe
                                                                                    first onesecond
                                                                                          one  being the
                                                                                               being  the
                                                                                                       onesame  article as
                                                                                                            appearing
                                                                                                          same  article asin the
     the
Asianthe  one
      Journal in  the
          one inofthe category
                    Social         Business,
                            Science,
                      category         whose
                                   Business,  Management,      and
                                                  coverage inand
                                              Management,          Accounting
                                                                Scopus          (and   the
                                                                         was discontinued
                                                                   Accounting              second
                                                                                (and the second     one
                                                                                                 inone  appearing
                                                                                                    2016).          in the
                                                                                                            The distribution
                                                                                                        appearing   in the
     Asian Journal
     Asian  Journal ofof Social
                         Social Science,
                                 Science, whose
                                          whose coverage
                                                    coverage in
                                                              in Scopus
                                                                 Scopus was
                                                                         was discontinued
                                                                             discontinued in  in 2016).
                                                                                                 2016). The
                                                                                                        The distribution
                                                                                                             distribution
situation here is similar to the one observed for Arts and Humanities, that is, the publications are
     situation here
     situation  here is is similar toto the
                                        the one
                                             one observed
                                                   observed for
                                                             for Arts
                                                                  Arts and
                                                                       and Humanities, thatthat is,
                                                                                                is, the
                                                                                                    the publications
                                                                                                        publications are
                                                                                                                       are
concentrated    mainlysimilar
                            in quadrants        1 and 2, whereas     manyHumanities,
                                                                            qualitative publications        are published in
     concentrated
     concentrated     mainly
                      mainly    in  quadrants
                                inFigure
                                    quadrants     1 and  2, whereas  many  qualitative    publications  are published   in
low-impact    journals
     low-impact            (see(see
                    journals         Figure6).6). 1 and 2, whereas many qualitative publications are published in
      low-impact journals (see Figure 6).

          Figure
      Figure
          Figure  5. Distribution
                  5. Distribution
              5. Distribution     of
                               of of publicationsin
                                  publications
                                     publications inthe
                                                  in the Decision
                                                     the Decision Sciences
                                                         Decision  Sciences
                                                                    Sciencessubject category
                                                                              subject
                                                                            subject           by FWCI
                                                                                       category
                                                                                    category  by FWCI and SNIP.
                                                                                                  by FWCI
                                                                                                      and SNIP.
                                                                                                           and SNIP.
          Source:
      Source:
          Source:  author’s
               author’s own
                   author’s own  developmentbased
                              development
                            own  development   basedon
                                               based  onthe
                                                      on the data
                                                         the data from
                                                             data from  SciVal,
                                                                   fromSciVal,  Elsevier
                                                                         SciVal,Elsevier
                                                                                 ElsevierB.V.
                                                                                           B.V.
                                                                                         B.V.

            Figure 6. Distribution of publications in the Economics, Econometrics, and Finance subject category
          Figure 6. Distribution of publications
      Figure 6. Distribution of publications  in in
                                                  thethe Economics,Econometrics,
                                                       Economics,   Econometrics, and
                                                                                  and Finance
                                                                                        Financesubject
                                                                                                subjectcategory
                                                                                                          category by
          by FWCI
              FWCI and
                    and SNIP.
                        SNIP. Source:
                               Source: author’s
                                       author’s own
                                                own development
                                                      development based
                                                                   based on
                                                                         on the
                                                                            the data
                                                                                data from
                                                                                     from SciVal,
                                                                                           SciVal, Elsevier
                                                                                                   Elsevier B.V.
      FWCI and SNIP. Source: author’s own development based on the data from SciVal, ElsevierB.V.
          by                                                                                                 B.V.
A Correlation Analysis of Normalized Indicators of Citation - MDPI
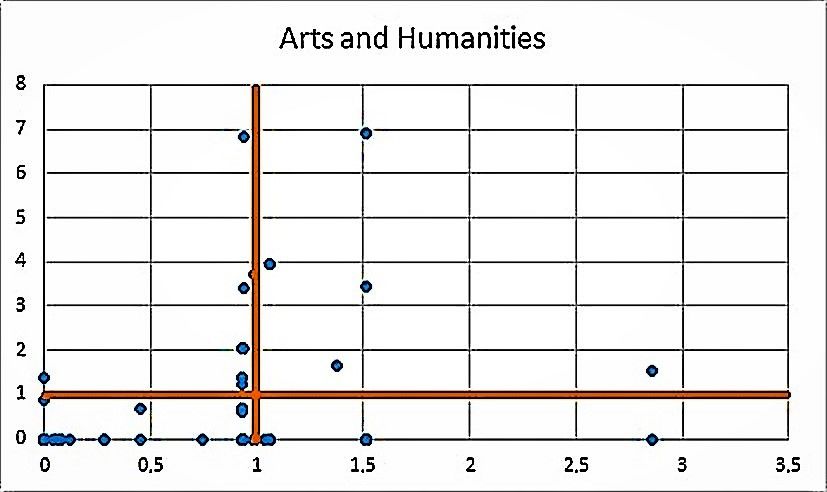
Publications 2018, 6, 39                                                                                                7 of 9

      Publications 2018,
      Publications 2018, 6,
                         6, xx FOR
                               FOR PEER
                                   PEER REVIEW
                                        REVIEW                                                               77 of
                                                                                                                of 10
                                                                                                                   10
3.5. Psychology
     3.5. Psychology
     There  are even fewer publications in this category than in Decision Sciences. In addition, most of
the documents    are even
           There are in the firstpublications
                          fewer  quadrant (see    Figure
                                              in this     7). than in Decision Sciences. In addition, most
                                                      category
      of the documents are in the first quadrant (see Figure 7).
3.6. Social Sciences
      3.6. Social Sciences
     Finally, in Social Sciences, five publications with extreme FWCI values were deleted (among them,
           Finally, at
the publications     in the
                         Social Sciences,
                             junction       fiveareas
                                        of the   publications  with extreme
                                                       of Education           FWCI values
                                                                      and Mathematics     were very
                                                                                       looked  deleted (among and
                                                                                                    interesting
     them, the publications at the junction of the areas of Education and Mathematics looked very
promising). Among the remaining publications (the number of publications in this subject field was
     interesting and promising). Among the remaining publications (the number of publications in this
the largest, 264), the first quadrant again prevails. A correlation between the level of the journal and
     subject field was the largest, 264), the first quadrant again prevails. A correlation between the level
the article’s  citation
      of the journal  and isthe
                             missing   (see
                                article’s    Figure
                                          citation    8).
                                                   is missing (see Figure 8).

          Figure
      Figure     7. Distribution
             7. Distribution  of of publicationsin
                                 publications     inthe
                                                     the Psychology
                                                         Psychology subject
                                                                      subjectcategory by FWCI
                                                                               category       and and
                                                                                         by FWCI  SNIP.SNIP.
                                                                                                        Source:
                                                                                                             Source:
          author’s own  development   based  on  the  data from SciVal, Elsevier
      author’s own development based on the data from SciVal, Elsevier B.V.      B.V.

          Figure
      Figure      8. Distribution
             8. Distribution      of publications
                              of publications      in the
                                               in the      Social
                                                      Social      Sciences
                                                              Sciences     subject
                                                                        subject     category
                                                                                category   byby FWCI
                                                                                              FWCI   and
                                                                                                   and   SNIP.
                                                                                                       SNIP. Source:
          Source: author’s  own  development  based   on the data from  SciVal,
      author’s own development based on the data from SciVal, Elsevier B.V.     Elsevier B.V.

4. Discussion and Conclusions
      Based on the analysis, the following conclusions can be drawn:
1.     With only two indicators available in SciVal, the author could quickly analyze the University’s
       publication strategy in terms of subject areas.
A Correlation Analysis of Normalized Indicators of Citation - MDPI
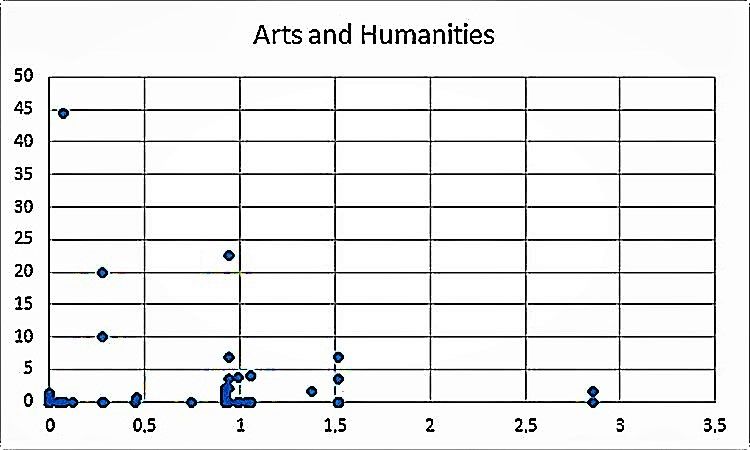
Publications 2018, 6, 39                                                                                                  8 of 9

2.     The correlation between the citation of publications and the level of the journal in Peoples’
       Friendship University of Russia (RUDN) is much lower than that of comparable universities.
       One of the possible reasons is a very high level of self-citation. Table 2 shows the FWCI values
       including and excluding self-citations.

      A comparative analysis showed that, in four subject areas, the FWCI of publications including
self-citations is higher than one (i.e., this corresponds to the global citation potential in a given field at
a given period). An unfavorable situation was observed only in the categories of Decision Sciences
and Psychology. However, when the self-citations were removed, a relatively large gap was revealed
with the C9 and Universities of Excellence. The same problems were observed in other universities
participating in the Project 5-100: the value of the normalized citation indicators for RUDN was even
higher than the average for the Project 5-100 (excluding the two above-mentioned areas).

           Table 2. Comparative analysis of normalized citation including and excluding self-citations *.

                                                                                                        Universities of
                                           RUDN                  5-100                 C9
       Subject Area/Indicators                                                                           Excellence
                                   FWCI      FWCI 2      FWCI       FWCI 2      FWCI        FWCI 2     FWCI      FWCI 2
                                    **        ***         **         ***         **          ***        **        ***
         Arts and Humanities        1.36       0.68       1.38           0.54   1.49         1.14       1.39      1.04
        Business. Management,
                                    1.12       0.63       1.11           0.59   1.47         1.17       1.37      1.06
           and Accounting
           Decision Sciences        0.15       0.07       1.08           0.46   1.32         1.01       1.34      0.94
       Economics. Econometrics,
                                    1.24       0.65       1.02           0.41   1.33         1.08       1.44      1.17
            and Finance
              Psychology             0.3       0.22       1.01           0.76   1.18         0.96       1.42      1.06
            Social Sciences         1.22       0.62       1.09           0.49   1.26         0.96       1.52      1.16
      * Source: author’s own development based on the data from SciVal, Elsevier B.V. ** Field-Weighted Citation Impact
      including self-citations. *** Field-Weighted Citation Impact excluding self-citations.

     At the same time, it cannot be said that the articles from Peoples’ Friendship University of
Russia or other Russian universities receive fewer views than foreign comparators. If the normalized
Field-Weighted Views Impact (FWVI) is examined, one can see that the articles of the RUDN and
5-100 universities are viewed much more often than foreign comparators with higher citation rates
(see Table 3).

                  Table 3. Comparative analysis of the normalized indicator of publication views *.

                      Subject Area/FWVI                RUDN          5-100       C9         Universities of Excellence
                     Arts and Humanities                2.46             2.51   1.13                   1.05
           Business, Management, and Accounting         1.66             1.39   1.33                   1.24
                      Decision Sciences                 1.39             1.53   1.39                   1.27
            Economics, Econometrics, and Finance         1.8             1.74   1.17                   1.09
                          Psychology                    0.79             1.67   1.21                   1.24
                        Social Sciences                 1.89             1.84   1.15                   1.17
                       * Source: author’s own development based on the data from SciVal, Elsevier B.V.

      Thus, the main problem is seen in the contents of the publications and the research activities of
the university.
      One could assume that the researchers are only aiming high, preferring to publish in high-impact
multidisciplinary journals like Nature or Science instead of a field journal. This assumption could be
verified by analyzing publications in the top journal percentiles established by SCImago Journal Rank
(SJR), for example, the top 5% in the subject category Multidisciplinary (data source: SciVal by Elsevier).
However, there were no such publications for RUDN University in 2017 and only 34 articles for the
Publications 2018, 6, 39                                                                                        9 of 9

Russian excellence initiative 5-100 (21 universities). Therefore, at the present time, this hypothesis has
not been supported by data.

3.     There are very few publications in the subject areas of Decision Sciences and Psychology,
       and almost all of them are in the first quadrant. Accordingly, the development of these areas
       seems not very promising.
4.     In the subject fields/areas of Arts and Humanities, Economics, Econometrics, and Finance,
       and Social Sciences, much research falls into the second quadrant (i.e., high-quality research
       results are published in low-impact journals).
5.     In almost all subject fields/areas, there are articles in the fourth quadrant. Low citation rates can
       be attributed both to the discrepancy between the quality of the publication and the level of the
       journal and to the quality of academic English and metadata.

Funding: This study was financially supported by the RUDN University Program 5-100. The author also wishes
to express his deepest gratitude to the anonymous reviewers who certainly made this work better.
Conflicts of Interest: The author declares no conflict of interest.

References
1.    The Ministry of Education and Science of the Russian Federation. Russian Academic Excellence Project 2018.
      Available online: https://5top100.ru/en/ (accessed on 31 July 2018).
2.    QS Quacquarelli Symonds Limited. TOPUNIVERSITIES 2018. Available online: https://www.topuniversit
      ies.com/university-rankings (accessed on 31 July 2018).
3.    Times Higher Education. World University Rankings 2018. Available online: https://www.timeshigheredu
      cation.com/world-university-rankings (accessed on 31 July 2018).
4.    Waltman, L.; van Eck, N.J. Source normalized indicators of citation impact: An overview of different
      approaches and an empirical comparison. Scientometrics 2013, 96, 699–716. [CrossRef]
5.    Waltman, L. A review of the literature on citation impact indicators. J. Informetr. 2016, 10, 365–391. [CrossRef]
6.    Moed, H.F. Measuring contextual citation impact of scientific journals. J. Informetr. 2010, 4, 265–277.
      [CrossRef]
7.    Waltman, L.; van Eck, N.J.; van Leeuwen, T.N.; Visser, M.S. Some modifications to the SNIP journal impact
      indicator. J. Informetr. 2013, 7, 272–285. [CrossRef]
8.    Elsevier. Journal Metrics in Scopus: Source Normalized Impact per Paper (SNIP). 2018. Available
      online: https://blog.scopus.com/posts/journal-metrics-in-scopus-source-normalized-impact-per-paper
      -snip (accessed on 31 July 2018).
9.    Haddawy, P.; Hassan, S.U.; Asghar, A.; Amin, S. A comprehensive examination of the relation of three
      citation-based journal metrics to expert judgment of journal quality. J. Informetr. 2016, 10, 162–173. [CrossRef]
10.   Australian Research Council. Excellence in Research for Australia (ERA). 2018. Available online: http:
      //www.arc.gov.au/excellence-research-australia (accessed on 31 July 2018).
11.   Elsevier. Snowball Metrics. 2018. Available online: https://www.snowballmetrics.com/metrics/ (accessed
      on 31 July 2018).
12.   Hicks, D.; Wouters, P.; Waltman, L.; de Rijcke, S.; Rafols, I. Bibliometrics: The Leiden Manifesto for research
      metrics. Nature 2015, 520, 429–431. [CrossRef] [PubMed]
13.   C9 LEAGUE. Your University Guide n.d. Available online: https://youruniversityguide.wordpress.com/ea
      st-asia/china/c9-league (accessed on 31 July 2018).
14.   Excellence Initiative (2005–2017). DFG 2018. Available online: http://www.dfg.de/en/research_funding/p
      rogrammes/excellence_initiative/index.html (accessed on 31 July 2018).

                           © 2018 by the author. Licensee MDPI, Basel, Switzerland. This article is an open access
                           article distributed under the terms and conditions of the Creative Commons Attribution
                           (CC BY) license (http://creativecommons.org/licenses/by/4.0/).
You can also read