2020 Asia Cruise Deployment & Capacity Report - Cruise Lines ...
←
→
Page content transcription
If your browser does not render page correctly, please read the page content below
2020 Asia Cruise
 Deployment & Capacity Report
BACKGROUND TO 2020
With the emergence of COVID-19 in 2020, the cruise industry took immediate and aggressive action to
mitigate the risk of the virus. This culminated in a global pause in operations in mid-March.

Since then, the industry developed and implemented extensive public health protocols that allowed cruising
to resume in Europe, parts of Asia, and the South Pacific. As a result of the extensive protocols that have
been adopted by cruise lines since resumption began, the incidence rate of COVID-19 onboard cruise ships is
far lower than practically any other setting—a remarkable achievement that continues to inspire cruise
confidence.

As we continue to work towards resuming operations around the world, and with the demand for cruise
remaining high, we expect to see passenger numbers and their growth trajectory rebound to pre-pandemic
numbers in the coming years. People love to cruise, and we know that people will return to the seas, just as
they will return to restaurants, bars, movie theatres, airplanes, resorts and beyond.

THE 2020 REPORT
This report on cruise activity across the whole of Asia in 2020 naturally reflects the limited cruise activity
versus prior years.

As before, it provides a comprehensive and accurate analysis of deployment, capacity and destination
volumes for the calendar year for every ship that operated in or passed through Asia (whether or not such
ships belonged to a CLIA member line). Trends over the past three years are also reported.

The vast expanse of the world for which cruise operations are analysed extend from India in the west to
Japan and the Philippines in the east, from Russia in the north to Indonesia in the south, a total of 20
nations. (A map is presented in the Appendix).

       Report and analyses Commissioned from:
       CHART Management Consultants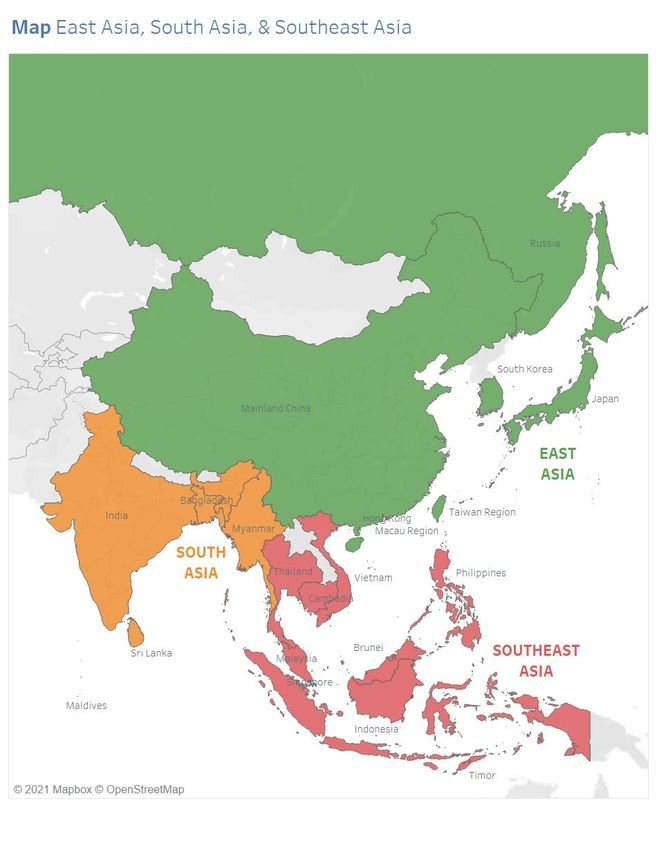
2020 CAPACITY

Ships: In 2020, 34 ships were active in                                          Ships in Asia by Size, 2020
Asian waters with a variety of product
offerings. Mid-sized ships accounted for                                                      12
almost one third of the fleet with 12,
                                                                                  8                           8
while Large and Small each had 8 ships.                                6
There were no expedition ships operating
in Asia in 2020.                                                                                                               0
Segments: Cruise lines catered mainly to
                                                                      Mega      Large       Mid-size         Small      Expedition
the premium and contemporary segments
with 12 such lines operating 18 ships in
Asia. Another 7 upscale cruise lines                           Cruise Ship Segments, 2020
operated 10 ships. There were four luxury
                                                                              Cruise Ship Segment             # Lines
lines (6 ships) and no expedition lines or
vessels.                                                                Premium & Contemporary                    12

Sailings: Within the Asian regions, 279                                                     Upscale               7
Asia-to-Asia itineraries took place and a                                                    Luxury               4
smaller volume of voyages (22) that called
                                                                                        Expedition                0
at Asian ports at some point in the
itinerary. In total, 301 sailings occurred in
2020.                                                                         Cruises Offered by Type, 2020

Cruise Duration: Short cruises still                                  Total                                             301
dominate the itineraries in Asia. Cruises of
2-3 nights accounted for the highest share                     Asia-Asia                                           279
of all cruises, 53 percent, followed by 4-6                    Voyages          22
nights representing 27 percent of all
cruises.

                                       Length of Cruises & Voyages Offered, 2020

                                53%                                                   28%                         4%1%
                                                                                                                     1%       5% 1%     7%

      2-3 nights   4-6 nights     7 nights   8-10 nights     11-13 nights       14 nights     15-19 nights             20+     Voyages

                                                           Capacity Summary, 2018-2020             2020                2019        2018
The allocation of ships and cruise
                                                           Ships                                       34               79            78
itineraries resulted in 1,273 operating
days in Asia for 2020 providing a total                    Sailings                                    301            1,917        2,041
capacity for 655K passengers.                              Operating Days                          1,273           10,245          10,467
                                                           Passenger Capacity (Millions)           0.66                4.02           4.26

                                                                                                                                             2
Capacity: Trends
                                                                                  Activity in Asia, Total Cruises & Voyages
The effects of the pause due to the global
pandemic are clearly visible in the stark drop-                                                                   2086 2041 1917
                                                                                                       1628
off in number of sailings in 2020: from 1,917                               861    970 1094
in 2019 down to only 301 in 2020.                                                                                                                   301

As cruising resumed in later parts of 2020,
                                                                           2013 2014 2015 2016 2017 2018 2019 2020
shorter itineraries dominated the volume with
57% of cruises having a duration of 2-3 nights.                               Cruise Ships Deployed by Type, Asian Region
Cruises of 4-6 nights represent about 27% of                                  Expedition Small Midsize Large Mega Total
the volume in Asia shrinking from 38% in                                 2013      2       14     19       8       0      43
2019.                                                                    2014      5       15     21       9       0      50
93% of cruises in Asia were 7 nights or less in                          2015     4              14          22        11            1               52
2020.                                                                    2016     6              17          21        15            2               61
                                                                         2017     5              17          26        13            5               66
                                                                         2018     5              21          27        19            6               78
                                                                         2019     6              22          26        18            7               79
                                                                         2020     0              8           12        8             6               34

                                                     Duration of Asia-Asia Cruises (nights)
 2020                                      57%                                                               30%                          5% 1%1%         5% 1%
                                                                                                                                                              0%

 2019                         36%                                                  38%                                    5%        5%         3%        5%        2%

 2018                       32%                                                    47%                                              5%        4%     3% 3% 1%

 2017                       31%                                                       52%                                                4% 3% 2%             3% 1%

 2016                       34%                                                    49%                                              7%         3%    2% 3% 1%

 2015                             40%                                             34%                             1% 7%        3%    4%       2%         8%

 2014                              44%                                             29%                            3% 6%        4%         5%        2%        6%

 2013                                46%                                                31%                          1% 4%     3%        6%     2%        7%

                                  2 to 3    4 to 6      7      8 to 10      11 to 13        14        15 to 19        20+

 For 2020, there were 1,273 operating days. Overall passenger capacity for ships in the region in 2020
 was 157,134
                                                  Capacity Growth 2013-2020

                                  Operating Days                          Passenger Capacity (millions)
        13,000                                                                                                                      5
                                                                    10,196        10,467          10,245
        11,000                                                                                                                      4
                                                     8,171                         4.26
         9,000                                                       4.24                             4.02
                                                                                                                                    3
         7,000               5,276         5,849
                 4,307                                 3.08                                                                         2
         5,000                             2.17
                     1.51    1.81                                                                                                   1
         3,000                                                                                                0.66     1,273
         1,000                                                                                                                      0

                 2013        2014          2015         2016        2017          2018                2019           2020
                                                                                                                                                                        3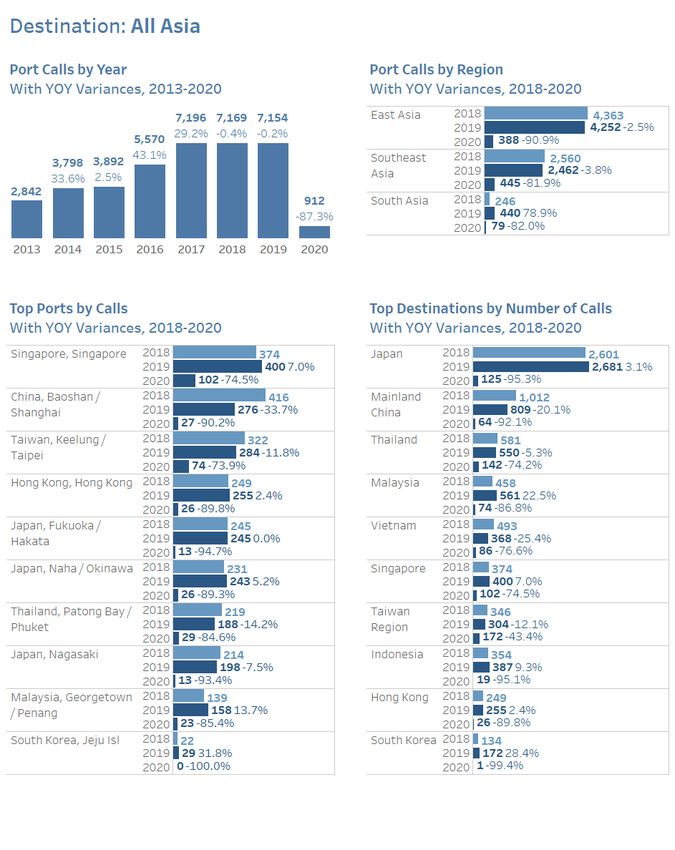
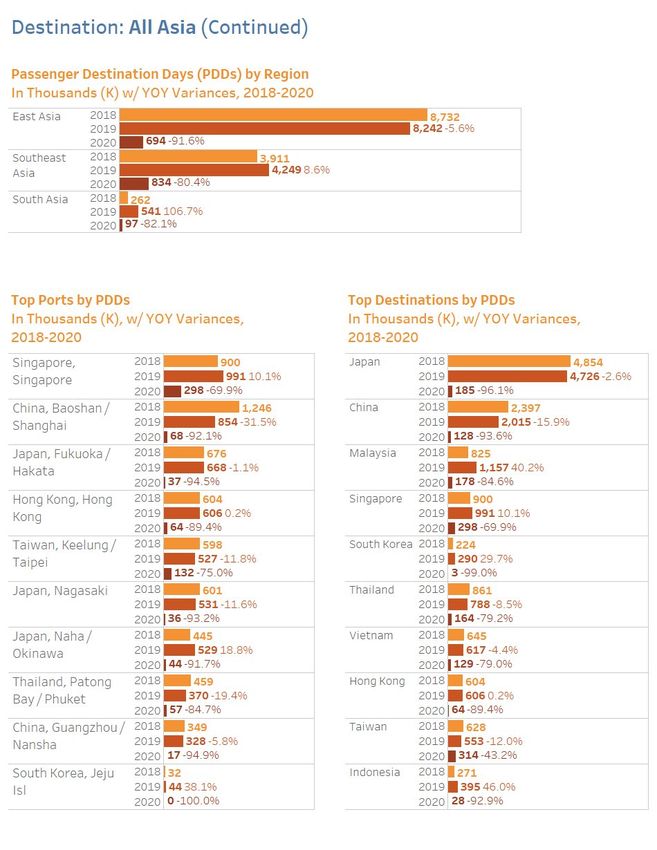
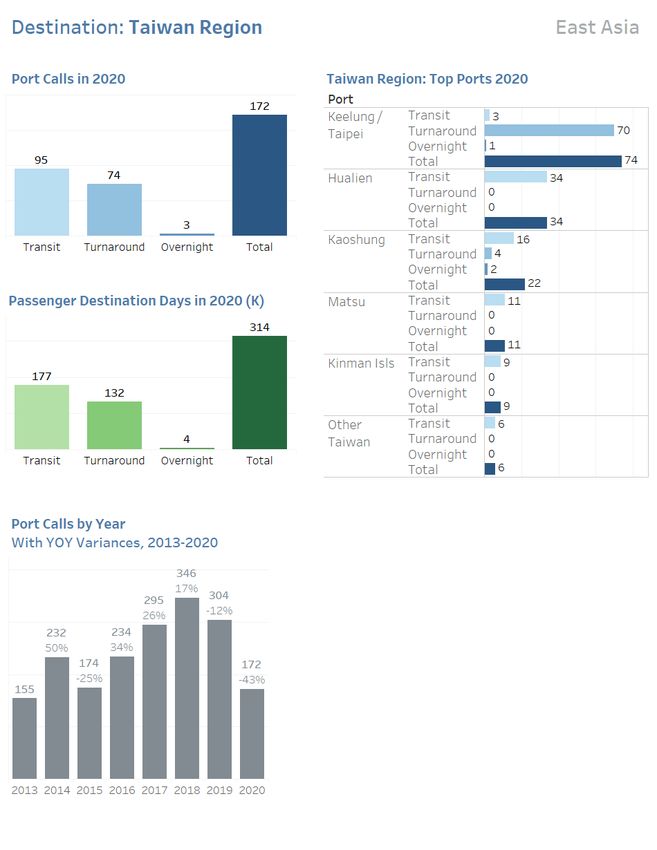
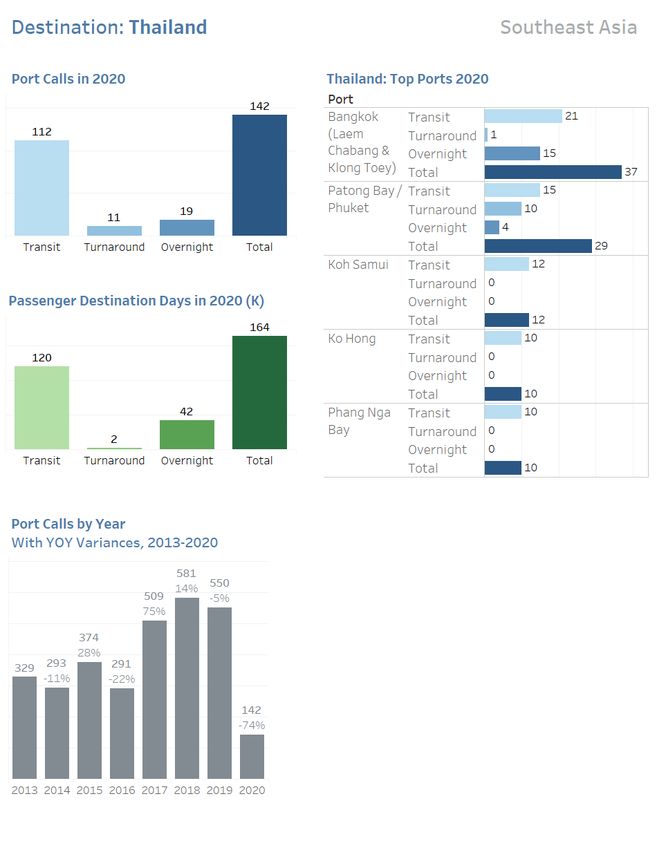
CRUISE DESTINATIONS:
Port Calls and Passenger Destination Days

                                            4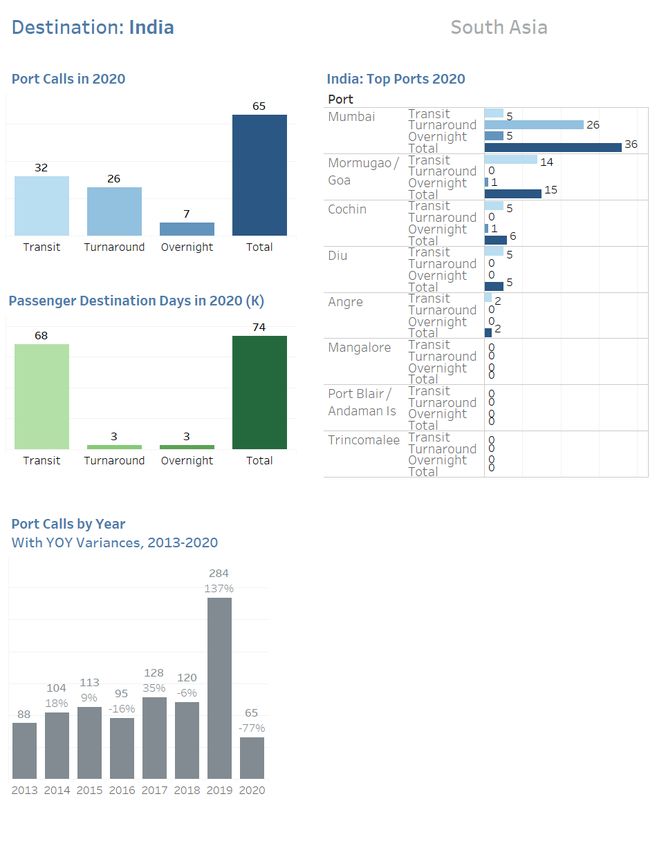
5
6
CAGR Charts
Due to the significant decrease in volume in 2020 as a result
of the global pandemic, compound annual growth figures
are not meaningful and so are omitted from this year’s
report.
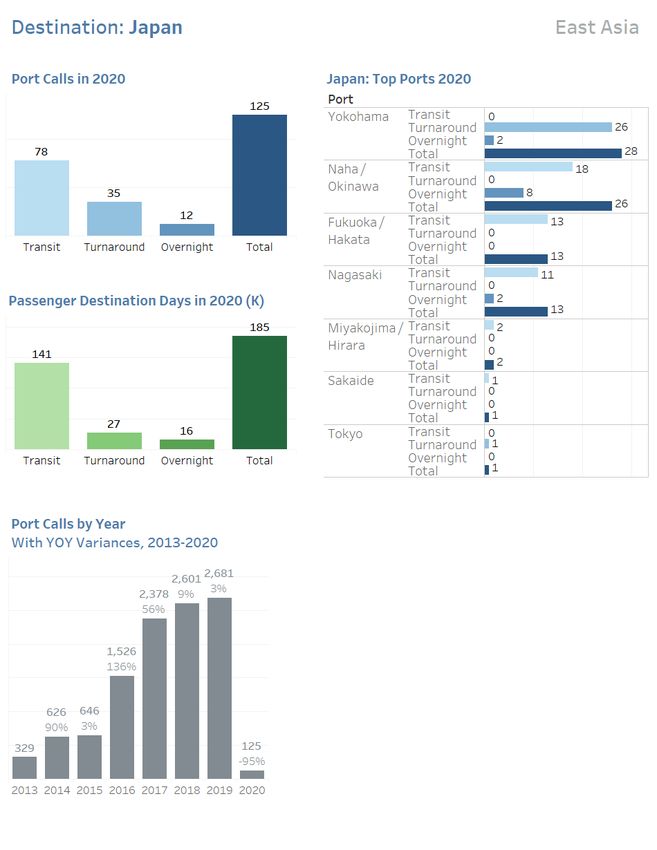
Note: Port calls for Japan prior to 2016 do not include the
three local cruise lines and are therefore under-stated. 7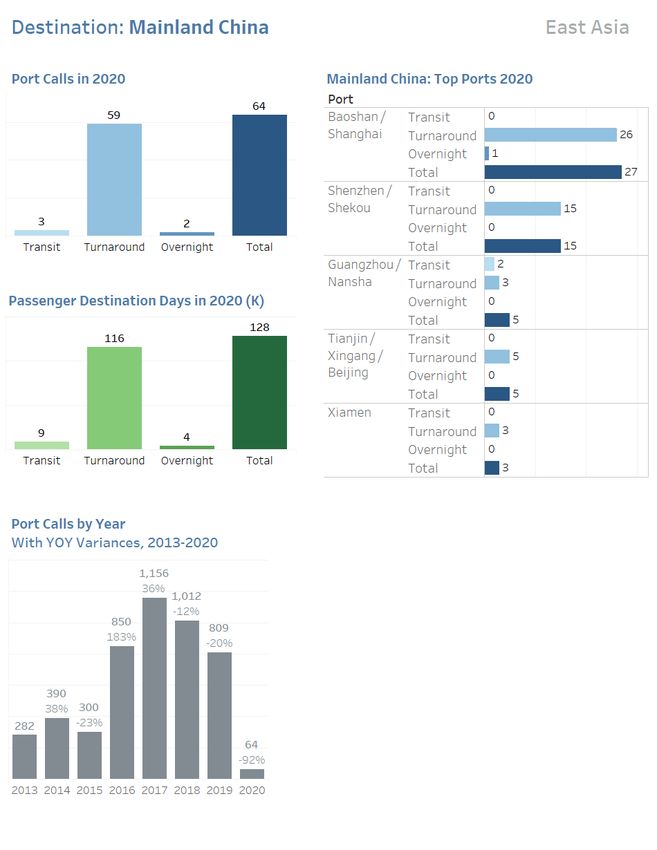
8
9
10
Note: The majority of calls scheduled to ROK after March
2017 did not take place due to the restrictions thereafter
on visits by ships based in Mainland China.                  11
12
13
14
15
16
17
18
19
APPENDIX

           20
APPENDIX: METHODOLOGY
• The forgoing report outlines capacity and destination trends between 2014 and 2020, based on CHART
Management Consultant’s analysis of detailed itinerary information obtained from the cruise lines that
are operating in Asia. Key capacity metrics, like ship counts, cruises, operating days and passenger
capacity, aggregated and analyzed. Additional destination metrics such as port calls and passenger
destination days describe the deployment trends.
• The study entails a comprehensive and detailed analysis of trends in ocean cruise capacity and
destinations visited among 23 international and regional brands cruising in Asia in 2020.
• Consistent with past Asia reports, all analyses and information exclude one-night cruises, river cruises,
ferry or ocean cruise operators with ships under 100 passenger capacity.
• Contrary to previous Asia reports (that analysed planned itineraries), all data represented is based on
itineraries actually operated with passengers on board through the year 2020.
21Appendix - Port Calls by Port, 2020
Top 45 Ports Ranked by Total Calls
Rank Destination Port Transit Turnaround Overnight Total
1 Singapore Singapore 3 86 13 102
2 Taiwan Keelung / Taipei 3 70 1 74
3 Thailand Bangkok (Laem Chabang & Klong Toey) 21 1 15 37
4 India Mumbai 5 26 5 36
5 Vietnam Da Nang / Hue / Chan May 31 0 4 35
6 Taiwan Hualien 34 0 0 34
7 Malaysia Port Klang/ Kuala Lumpur 21 0 8 29
8 Thailand Patong Bay / Phuket 15 10 4 29
9 Vietnam Ho Chi Minh City / Phu My 19 0 10 29
10 Japan Yokohama 0 26 2 28
11 China Baoshan / Shanghai 0 26 1 27
12 Hong Kong Hong Kong 3 18 5 26
13 Japan Naha / Okinawa 18 0 8 26
14 Malaysia Georgetown/ Penang 23 0 0 23
15 Taiwan Kaoshung 16 4 2 22
16 Taiwan Penghu 16 0 0 16
17 China Shenzhen / Shekou 0 15 0 15
18 India Mormugao / Goa 14 0 1 15
19 Malaysia Langkawi 14 0 0 14
20 Japan Nagasaki 11 0 2 13
21 Japan Fukuoka /Hakata 13 0 0 13
22 Sri Lanka Colombo 8 1 3 12
23 Thailand Koh Samui 12 0 0 12
24 Taiwan Matsu 11 0 0 11
25 Thailand Ko Hong 10 0 0 10
26 Thailand Phang Nga Bay 10 0 0 10
27 Vietnam Halong Bay / Hanoi 8 0 2 10
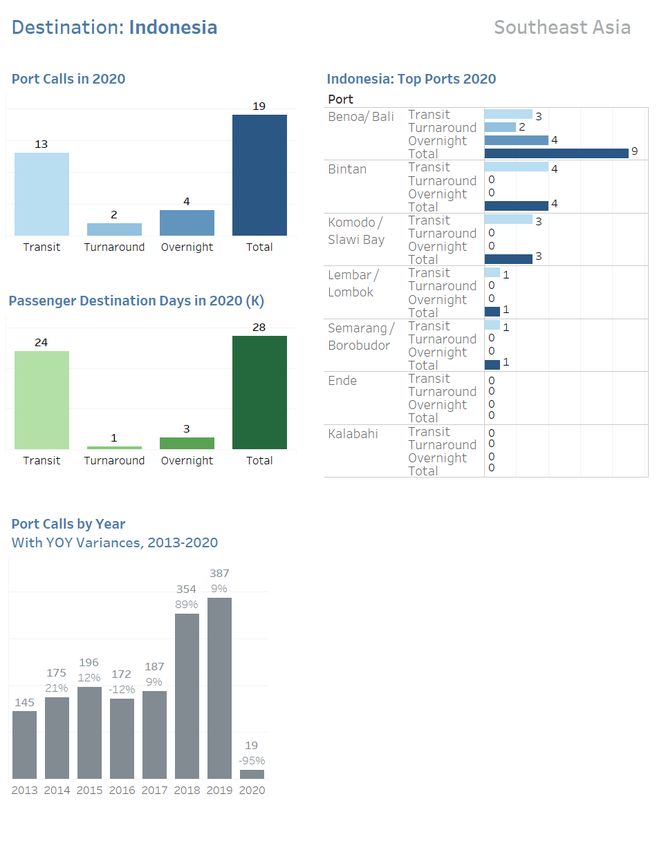
28 Indonesia Benoa/ Bali 3 2 4 9
29 Japan Kobe 3 6 0 9
30 Japan Ishigaki 9 0 0 9
31 Philippines Manila 6 1 2 9
32 Taiwan Kinman Isls 9 0 0 9
33 Thailand Similian Is 9 0 0 9
34 Thailand Ko Rok Nok 9 0 0 9
35 China Hainan / Sanya 0 7 1 8
36 Vietnam Nha Trang 8 0 0 8
37 Cambodia Sihanoukville 7 0 0 7
38 Malaysia Malacca 7 0 0 7
39 India Cochin 5 0 1 6
40 Taiwan Other Taiwan 6 0 0 6
41 Thailand Ko Adang 6 0 0 6
42 China Guangzhou / Nansha 2 3 0 5
43 China Tianjin / Xingang / Beijing 0 5 0 5
44 India Diu 5 0 0 5
45 Thailand Ko Butang 5 0 0 5
22APPENDIX - GLOSSARY
Cruises: Encompass deployment within Asia only. Our definition of a Cruise is a one that both begins and ends in an
Asian port and includes only Asian ports in its itinerary. A Round-trip cruise returns to its port of embarkation while an
Open-jaw cruise (fly-cruise) begins in one Asian port and finishes in another.
East Asia: Geography that includes Mainland China, Hong Kong, Taiwan, South Korea, Japan and East Russia. (See Map,
Page 25)
Ocean cruise: A cruise itinerary that sails to destinations via the ocean; itineraries last 2 or more nights.
Operating Days: Days spent cruising (on both voyages and cruises) in Asian waters.
Overnight Port Call: An overnight call occurs when the vessel departs at least one day after arriving in port. Overnight
calls may be added to a transit call or added to a turnaround call. For example, a vessel arriving in Bangkok on 21 May
and departing on 23 May is counted as making one transit call (21/5) and two overnight calls (21 and 22/5). A vessel
arriving in Hong Kong on 21 May and departing with a different cruise number on 22 May is considered to have had one
turnaround and one overnight call. Note that, in our treatment, an overnight does not exist independently of one or the
other calls.
Passenger Capacity: The number of lower berths multiplied by the number of cruises for each vessel. [Example:
Voyager of the Seas’ 3,114 lower berths on the 62 cruises it operated in 2018 resulted in passenger capacity of 193,068]
Passenger Destination Days (PDD): A measure of potential visits from cruise passengers when a ship calls at a
destination. It assumes 100% lower berth occupancy and that all passengers have the opportunity to go ashore.
[Example: A ship of 1,000 capacity calling at a destination for one day creates a potential of 1,000 PDD. So, if that ship
visits 3 ports on one cruise, it generates 3,000 PDD].
Port Calls: Until this year (2020) Asia Cruise Trends studies consistently reported on PLANNED deployment at the
beginning of each year, the source being the detailed day-by-day itineraries prepared by all cruise operators for each of
their cruise ships in Asia. Occasionally operators make adjustments to their itineraries as the year progresses. In such
cases their actual calls differ from planned call volumes in certain destinations. The difference in industry-wide figures is
usually small. But in 2017 the restriction on cruises from Mainland China to Korea after March required many changes
in East Asia (dramatically reducing port calls to Korea and boosting those to Japan).
For this year, all the analyses are based on ACTUAL itineraries operated in Asia with passengers on board (again as
advised confidentially to CHART Management Consultants by every cruise line).
23APPENDIX - GLOSSARY
Product Segments:
Contemporary & Premium : Mostly large ships that offer predominantly short – 3,4,5-night – cruises as well as some
7-night and longer
Upscale: Distinguished by more spacious, refined on-board accommodation, superior dining, a more discrete service
and higher prices.
Luxury: The Luxury lines are another step above the Upscale in on-board comforts, product inclusions and price-point.
Their ships typically carry few passengers and have very high staff-to-guest ratios. They also typically operate longer
cruises – such as 12 nights.
Expedition: Very small ships (100 to 300 passengers) offering immersion in remote destinations, usually with a high
standard of service and accommodation.
Ship size categories:
Since the 2013 Asia Cruise White Paper, CHART has been defining ships by size as follows:
Mega Ships: Lower berth capacity of 3,500 or more - OR GRT over 150,000
Large Ships: Lower berth capacity of 2,000 to 3,500 - AND GRT over 75,000
Midsize Ships: Lower berth capacity of 750 to 2,000 passengers
Small Ships: Lower berth capacity under 750 passengers
Expedition Ships: Lower berth capacity typically 100 to 300 passengers
South Asia: Geography that includes India, Myanmar/Burma, Bangladesh, Sri Lanka, and the Maldives. (See Map, Page 25)
Southeast Asia: Geography that includes Singapore, Malaysia, Indonesia, Brunei , Philippines, Thailand, Cambodia, Vietnam,
and Timor-Leste. (See Map, Page 25)
Transit Port Call: A transit call applies to all ships that have the arrival and departure scheduled on the same day. The same
passenger load arrives and departs on a transit call.
Turnaround Port Call: A turnaround call occurs when the vessel arrives under one cruise number and departs with a different
cruise number. This would generally involve all passengers on board disembarking and a new passenger load embarking.
Turnarounds mark the end of one cruise and the start of the next. Passengers typically do not have the opportunity to sight-
see or shop, take shore excursions or tour on a turnaround unless they opt to arrive in the port city early or stay over for an
additional night or nights. The ship usually takes on fuel, fresh water, provisions, etc. Passengers and their baggage have to
be disembarked and go through customs and immigration procedures, take transfers to the airport (or hotels). The new
passenger complement has to be embarked.
[Note that in Asia some ships are taking passengers on board in consecutive ports on the one cruise – e.g. Shenzhen and
Hong Kong. In this case the first port is counted as turnaround, the second as transit].
Voyages: Itineraries that include ports of call outside the regions of Asia. Voyages are typically longer than cruises. Voyages
often involve the seasonal positioning of a vessel from Europe, America or Australia to an Asian port from where it will offer a
series of cruises (or from Asia back to one of those cruising areas). Other voyages include vessels on round world or other
long trips, calling at Asian ports as part of the journey.
* * * 24Cruise Destination Countries & SARs by Region
(Following geography)
SOUTH ASIA SOUTHEAST ASIA EAST ASIA
Myanmar/Burma Philippines East Russia
India Vietnam Japan
Sri Lanka Cambodia South Korea
Bangladesh Thailand Mainland China
Maldives Malaysia Taiwan
Singapore Hong Kong SAR
Indonesia Macau Region
Brunei
Timor-Leste
25Commissioned by: CLIA
Cruise Lines International Association (CLIA) is the world’s largest cruise industry trade association,
providing a unified voice and leading authority of the global cruise community. CLIA supports policies and
practices that foster a safe, secure, healthy and sustainable cruise ship environment and is dedicated to
promoting the cruise travel experience. Economic, environmental and cultural sustainability is of the
utmost importance to the cruise industry. We support local economies not just by bringing guests and crew
to their shores but by using local services and goods on our ships. We sustain +1.1M jobs and US$134B in
economic impact worldwide. Every day, the global cruise industry is hard at work protecting the
environment and strengthening local destinations through bold leadership, innovative stewardship, and
strong strategic partnerships.
For more information about CLIA and the Cruise Industry, visit www.cliaasia.org
Research and Analysis by: CHART Management Consultants
CHART assists senior management to understand complex issues, to develop strategic solutions to problems
and to devise innovative approaches to capitalizing on the growth of the cruise industry. The firm brings
unique experience, analytical rigor, strong communication and implementation skills and exceptional client
service to every project.
In recent years the firm’s focus is mostly to Asia and the Pacific. The firm created the highly successful
strategy for Papua New Guinea, the National Cruise Tourism Strategy for the Philippines, the Pacific Cruise
Market Research and Intelligence project and a Development Strategy for SPTO. CHART’s recent analyses
and strategic advice for cruise projects in Asia include: a new port development in China; financing
newbuilds for Asia; private investment in a new Asian cruise operation; operational and market assessment
for a new cruise port development in Vietnam; investment in the Asian river cruise industry.
The firm designed and delivered the 2013 Asia Cruise Association White Paper as well as all Asia Cruise
Trends reports and the subsequent Asia Cruise Deployment & Capacity Reports published by CLIA.
For more information: www.CHARTmgmtconsultants.com
Released July 2021
26You can also read