PGIM India Midcap Opportunities Fund - September 2021 (Mid Cap Fund - An open-ended equity scheme predominantly investing in mid cap stocks)

Page created by Jamie Kelly
 
CONTINUE READING
PGIM India Midcap Opportunities Fund - September 2021 (Mid Cap Fund - An open-ended equity scheme predominantly investing in mid cap stocks)
PGIM India Midcap Opportunities Fund
(Mid Cap Fund - An open-ended equity scheme predominantly investing in mid cap stocks)

 September 2021
PGIM India Midcap Opportunities Fund - September 2021 (Mid Cap Fund - An open-ended equity scheme predominantly investing in mid cap stocks)
Index

• About Us

• PGIM India – Equity Investment Process

• Why Midcaps?

• Why PGIM India Midcap Opportunities Fund?

• PGIM India Midcap Opportunities Fund – Sources of Alpha
PGIM India Midcap Opportunities Fund - September 2021 (Mid Cap Fund - An open-ended equity scheme predominantly investing in mid cap stocks)
28
PGIM India Midcap Opportunities Fund - September 2021 (Mid Cap Fund - An open-ended equity scheme predominantly investing in mid cap stocks)
PGIM India – Equity Investment Process
PGIM India Midcap Opportunities Fund - September 2021 (Mid Cap Fund - An open-ended equity scheme predominantly investing in mid cap stocks)
Investment Process Overview
  Assessing the ability to survive the cycles. Three factors for inclusion in investment
  universe.

                                                 *

                                                                                                                                      Companies
Abundantly                                                     Competitive                                                             strong on
available in                                                                                                                           either are
   India
                                                               Advantage                                                              in focus for
                                                                                                                                       evaluation

  * In companies with less than 10 years of data available, at least 70% of the years should have generated positive operating cash flows.
PGIM India Midcap Opportunities Fund - September 2021 (Mid Cap Fund - An open-ended equity scheme predominantly investing in mid cap stocks)
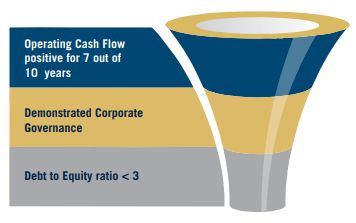
Investment Philosophy

 Respect for   Strong focus on Return on Capital Employed (RoCE) & Return on Equity (RoE)
   Capital

  Operating    A leader or competent challenger in its operating space
 Leadership

   Sector      ▪ Favor industries gearing up for consolidation
 Dominance     ▪ Avoid industries slated for fragmentation

               ▪ Conservative debt
    Solid
               ▪ Positive operating cash flows
 Financials    ▪ Strong projected cash flow generation
Why Midcaps?
Many Themes/Sectors where Midcap companies have significant presence
compared to Large Caps – providing unique opportunities
 Software Product development companies:                                                             Real Estate:
 India is seeing emergence of some interesting IT product                                            Housing will be a long-term story in India. Post RERA, the
 companies. Different from the normal IT Services                                                    transparency has gone up and overtime the competition will
 companies                                                                                           come down

 Discretionary Retail:                                                                               Home Building:
 This segment is a beneficiary of rising per capital GDP and                                         As a corollary to the real estate sector, as the sector takes
 higher discretionary spends. Many sub segments find no                                              off, there will be a good demand of tiles, sanitary ware, etc.
                                                                                                     There is very little representation of large caps in the
 representation in large caps: Footwear, Clothing brands,
                                                                                                     segment
 Food & Retail chain
                                                                                                     Chemicals:
 Water & Water transportation:                                                                       The sector is seeing a lot of vibrancy in terms of growth and
 Water will increasingly become a critical element in the eco-                                       profitability as China clamps down on pollution. Lots of
 system of India. Higher population & erratic monsoons will                                          business is flowing to India
 require water transportation & river linking
                                                                                                     Staffing:
 Hospitality:                                                                                        Manpower management is moving from unorganised to
 Increasing incomes will lead to people travelling more and                                          organised and the trend to outsource non-core activity will
 holidaying. The need for hotel rooms & airlines will grow                                           be a big theme, as corporates will focus on core activities
 manifold                                                                                            and profitability

These are based in the Fund Managers outlook and are subject to change. The scheme may or may not invest in above themes. These themes may change depending upon the market conditions.
Lower interest rate regime augurs well for midcaps
                                                           Largecap v/s Midcap - Debt to Equity Ratio
       300                                                                                                                                                                          8.00

                                                                                                                                                                                    7.50
       250
                                                                                                                                                                                    7.00

                                                                                                                                                                                    6.50
       200
                                                                                                                                                                                    6.00

       150                                                                                                                                                                          5.50

                                                                                                                                                                                    5.00
       100
                                                                                                                                                                                    4.50

                                                                                                                                                                                    4.00
        50
                                                                                                                                                                                    3.50

         0                                                                                                                                                                          3.00

                                           Repo Rate(RHS)                  Nifty 50 D/E Ratio(LHS)                 Nifty Midcap 100 D/E Ratio(LHS)

   •      Historically, midcaps as a segment have been more leveraged than large caps
   •      In this lower interest rate regime, midcap companies are likely to benefit more than larger companies
   •      This should reflect in overall P&L and balance sheet strength going forward and quality companies can look to capitalize

Data as on September 30, 2021. Source: Bloomberg The Large Cap category stocks are represented by Nifty 50 Index and the Midcap stocks are represented by Nifty Midcap 100 Index.
Midcaps tend to outperform Large Caps over long term
12%
               5 years Rolling Return - Midcap performance relative to Large cap                                                                                    5 Years Rolling Returns Analysis
                                         (last 10 years)                                                                                                                     (last 10 years)
10%
                                                                                                                                                                Total number of observations                            1632
8%
                                                                                                                                                                % of observations where
6%                                                                                                                                                              midcaps have outperformed                                78%
                                                                                                                                                                largecap
4%
                                                                                                                                                                Median outperformance                                   5.7%
2%                                                                                                                                                              Current outperformance
                                                                                                                                                                                                                       0.47%
                                                                                                                                                                (30.9.21)
0%
                                                                                                                                                                Maximum outperformance                                 8.64%
-2%
                                                                                                                                                                Maximum underperformance                               -1.92%

 •       Nifty Midcap 100 index has outperformed Nifty 50, 78% times on a 5 years rolling basis, in the last 10 years, with median outperformance
         being 5.7%
 •       However, since early 2018 midcaps have witnessed a correction. Even after the recent rally, the relative outperformance is well below long
         term average.
 •       As economic recovery gains further momentum, midcaps can be expected to revert to mean, as the rally becomes more broad based

      Source: Bloomberg. The above chart is for understanding purpose only. Past performance may or may not sustain in the future. (Midcap represented by Nifty Midcap 100 index and large cap represented by Nifty 50 Index)
Why PGIM India Midcap Opportunities Fund?
PGIM India Midcap Opportunities Fund
 •   The scheme invests at least 65% of its nets asset in Midcap stocks and maximum of 35% each in Equity &
     Equity Related Instruments of other companies and Cash, Money Market, Debt Securities, Liquid & Debt
     schemes of Mutual Fund. Midcap stocks are defined as stocks between 101 to 250 ranked as per market
     capitalization

 •   The fund tends to offer you greater growth potential as compared to large cap stocks, and also with less
     volatility and risk as compared to small cap stocks

 •   The fund looks to identify quality midcap stocks which can benefit from a favourable economic environment,
     based on extensive research and thorough selection process

 •   The fund predominantly invests in midcap stocks in accordance with the investment objective and asset
     allocation. Fund Manager will select equity securities on a top-down and bottom–up, stock–by–stock basis,
     with consideration given to valuation parameters as well as growth, margins, asset returns, and cash flows,
     amongst others

 •   Stocks are selected on the basis of, amongst others, the historical and current financial condition of the
     company, potential value creation/unlocking of value and its impact on earnings growth, capital structure,
     business prospects, policy environment, strength of management, responsiveness to business conditions,
     product profile, brand equity, market share, competitive edge, research, technological know–how and
     corporate governance
Investment Approach : PGIM India Midcap Opportunities Fund

 The zebra in the centre is the                   The zebra in the outer periphery    The zebra, which is aware of
 safest, but gets low quality grass               has the risk of being attacked by   the risk and stands at the outer
 which is stamped by the hoof of                  lions but has access to the         periphery gets the best grass
 other horses                                     greener grass.                      and is risk aware

                    In the Midcap, we are the risk aware zebra, standing at the periphery

 Source : Zebra in the Lion Country by Ralph Wagner
Approach leads to High-Conviction portfolio with Low Overlap
                              Low Portfolio Overlap of 30.6%, with top ideas beyond benchmark
                                                                         Top 5 ideas beyond the Benchmark
                                                                                                                            Bharat Rasayan Ltd
                 PGIM India
                  Midcap      30.6%                                                                                          Sagar Cement Ltd
                Opportunities
                                    Benchmark*
                                                                                                                             MTAR Technologies Ltd
                   Fund
                                                                                                                             Muthoot Finance Ltd
                                                                                                                             Coforge Ltd

                                            No. of stocks
         120
                                                                               100                                              Top 10 Holdings (% of net assets)
         100
           80                                                                                                                PGIM India MCOF                            30.2%
           60                       48
                                                                                                                             Benchmark*                                 21.2%
           40
           20
            0
                  PGIM India MidCap Opportunities Fund                     Benchmark*

Data as on September 30, 2021 *Nifty Midcap 100 TR Index. These are based on the Fund Manager’s outlook and are subject to change. Stocks referred to in the document are only for understanding
purpose and should not be considered investment advise.
Portfolio composition

                Stable Growth                                          High Growth                                             Turnaround

                Top 40%-45%                                        Middle 40%-45%                                        Bottom 10%-20%

       • Companies with                                       • Companies with                                      • Turn around stories/
         stable earnings and                                    strong earnings                                       good companies
         strong earnings                                        growth (above                                         going through bad
         visibility (14-16%)                                    20%)                                                  times with
                                                                                                                      significant potential
                                                                                                                      for alpha generation

This is the general strategic portfolio composition of the fund. It does not exactly indicate the composition of the fund at the current moment
Portfolio Metrics - Quality portfolio with Higher Growth, Lower Leverage, Lower Risk

                       ROE                                             Beta                                   Debt to Equity^
 14.0%         13.2%                              1.20                                            200.0%

                                                                                                  180.0%                          172.2%
 12.0%                                                                           1.00
                                                  1.00
                                                                                                  160.0%
                                10.0%
 10.0%                                                          0.83
                                                                                                  140.0%
                                                  0.80
                                                                                                  120.0%
  8.0%
                                                  0.60                                            100.0%
  6.0%
                                                                                                   80.0%
                                                  0.40
  4.0%                                                                                             60.0%
                                                                                                                 44.2%
                                                                                                   40.0%
  2.0%                                            0.20
                                                                                                   20.0%

  0.0%                                            0.00                                              0.0%
         PGIM India Midcap    Benchmark*                 PGIM India Midcap    Benchmark*                   PGIM India Midcap    Benchmark*
         Opportunities Fund                              Opportunities Fund                                Opportunities Fund

  • A quality portfolio with a higher Growth (ROE), lower Leverage (debt-to-equity ratio) and
    lower Risk (portfolio beta) v/s the benchmark index

Data as on September 30, 2021 *Nifty Midcap 100 TR Index ^Ex Financials Source: Bloomberg. ROE – Return on Equity.
Portfolio Metric – Current Sector and Stock Positioning
                    Stock (Top 10)                          % Holding                  Top 3 Sectors Over/Underweight                      % Overweight
Mphasis Ltd.                                                   4.02%
Ashok Leyland Ltd.                                             3.28%
                                                                                Industrials                                                   6.12
Voltas Ltd.                                                    3.13%            Materials                                                     3.44
Max Financial Services Ltd.                                    3.11%
                                                                                Information Technology                                        2.77
JB Chemicals & Pharmaceuticals Ltd.                            2.93%
Cummins India Ltd.                                             2.88%                        Top 3 Sectors Underweight                  % Underweight
Sanofi India Ltd.                                              2.85%            Utilities                                                     -7.54
L&T Technology Services Ltd.                                   2.84%
                                                                                Financials                                                    -4.77
Canara Bank                                                    2.83%
BASF India Ltd.                                                2.83%            Energy                                                        -2.00

          Top 5 Stocks Overweight                    % Overweight
                                                                                                             Market Cap Breakup
J.B. Chemicals & Pharma Ltd                                2.93
                                                                                                                    1.4% 0.0%
Basf India Ltd                                             2.83                                                               6.0%
Sobha Ltd                                                  2.67
Max Healthcare Institute Ltd                               2.64                                                 23.2%
Acc Ltd                                                    2.58
          Top 5 Stocks Underweight                  % Underweight
Adani Total Gas Ltd                                        -2.88
                                                                                                                            69.4%
SRF Ltd                                                    -2.41
Godrej Properties Ltd                                      -1.98
Tata Power Co Ltd                                          -1.98
Shriram Transport Finance                                  -1.92                            Large Cap    Mid Cap       Small Cap    Cash      Not Classified

 Data as on September 30, 2021. These are based on the Fund Manager’s outlook and are subject to change Source: Bloomberg
To Summarize
                    PGIM India Midcap Opportunities Fund

  A quality portfolio with
  • Companies with
       • Respect for capital
       • Sector dominance or able challengers
       • Consolidating industries
       • Solid Financials

  • Broadly three types of companies
      • High growth
      • Stable growth
      • Turn around

  • Characteristics of
     • Low overlap with the benchmark
     • High ROE
     • Low Debt to Equity Ratio
     • Beta less than 1
PGIM India Midcap Opportunities Fund –
           Sources of Alpha
The story behind our current success – portfolio positioning

                                                       >15% exposure to
                                 Companies beyond      small caps – much
                                top 50-60 companies     more than peers

                                 Low overlap of 30%-    Overweight on
                                 35% with benchmark    sectors which are
                                     and peers          currently under
                                                            bought

Data as on September 30, 2021
10
                                                                                                                                         15
                                                                                                                                                20
                                                                                                                                                      25
                                                                                                                                                                                                                             10
                                                                                                                                                                                                                                  15
                                                                                                                                                                                                                                        20
                                                                                                                                                                                                                                               25

                                                                                                                            0
                                                                                                                                5
                                                                                                                                                                                                                   0
                                                                                                                                                                                                                       5
                                                                                                                  Apr-20                   14.59                                           Apr-20                                        18.60
                                                                                                                  May-20                 12.11                                             May-20                                            20.13
                                                                                                                  Jun-20                  13.71                                            Jun-20                                       17.41
                                                                                                                   Jul-20                 13.96                                             Jul-20                                           20.16
                                                                                                                  Aug-20                  13.79                                            Aug-20                                            21.13
                                                                                                                  Sep-20                 11.81                                             Sep-20                                              22.56
                                                                                                                  Oct-20                      15.40                                        Oct-20                                            21.02

                                                                                           Financials
                                                                                                                                                                                                                                                         Materials
                                                                                                                  Nov-20                         18.90                                     Nov-20                                              22.41
                                                                                                                  Dec-20                        17.43                                      Dec-20                                        18.84
                                                                                                                  Jan-21                        17.51                                      Jan-21                                         19.09
                                                                                                                  Feb-21                             20.45                                 Feb-21                                            19.88
                                                                                                                  Mar-21                   14.58                                           Mar-21                                       17.40
                                                                                                                  Apr-21                        17.93                                      Apr-21                                             21.52
                                                                                                                                                                                                                                                                                 Exposure to Materials (%)

                                                                                                                                                             Exposure to Financials (%)
                                                                                                                  May-21                        18.16                                      May-21                                        18.26
                                                                                                                                                                                                                                                         Average Index Weight

                                                                                           Average Index Weight
                                                                                                                  Jun-21                      15.69                                        Jun-21                                       16.80
                                                                                                                   Jul-21                 13.38                                             Jul-21                                     16.56
                                                                                                                  Aug-21                  13.64                                            Aug-21                                      15.97

Source: Bloomberg The Index considered in the graphs above is Nifty Midcap 100 TRI Index
                                                                                                                  Sep-21                  13.68                                            Sep-21                                      15.32
                                                                                                                                                                                                                             10
                                                                                                                                                                                                                             15
                                                                                                                                                                                                                             20
                                                                                                                                                                                                                             25
                                                                                                                                                                                                                             30
                                                                                                                                                                                                                             35

                                                                                                                                                                                                                              0
                                                                                                                                                                                                                              5

                                                                                                                            0.5
                                                                                                                            1.5
                                                                                                                            2.5
                                                                                                                            3.5

                                                                                                                              0
                                                                                                                              1
                                                                                                                              2
                                                                                                                              3
                                                                                                                              4

                                                                                                                  Apr-20                                                                                           Apr-20                14.72
                                                                                                                  May-20                                                                                           May-20                15.94
                                                                                                                  Jun-20                                                                                           Jun-20                 16.41
                                                                                                                   Jul-20                                                                                           Jul-20                    19.30
                                                                                                                  Aug-20                                                                                           Aug-20                    18.96
                                                                                                                  Sep-20                                                                                           Sep-20                     19.24
                                                                                                                  Oct-20                                                                                           Oct-20                     19.69
                                                                                                                                                                                            Industrials

                                                                                           Real Estate

                                                                                                                  Nov-20            0.99                                                                           Nov-20                    18.31
                                                                                                                  Dec-20              1.37                                                                         Dec-20                       21.97
                                                                                                                                                                                                                                                                                                             Sources of Alpha – Overweights /Underweights

                                                                                                                  Jan-21                 1.79                                                                      Jan-21                        24.19
                                                                                                                  Feb-21              1.31                                                                         Feb-21                           25.12
                                                                                                                  Mar-21              1.38                                                                         Mar-21                              31.07
                                                                                                                  Apr-21               1.55                                                                        Apr-21                            28.44
                                                                                                                                                                                                                                                                                Exposure to Industrials(%)

                                                                                                                                                             Exposure to Real Estate (%)

                                                                                                                  May-21             1.28                                                                          May-21                           25.72
                                                                                                                                                                                            Average Index Weight

                                                                                           Average Index Weight

                                                                                                                  Jun-21               1.45                                                                        Jun-21                       22.77
                                                                                                                   Jul-21              1.50                                                                         Jul-21                     19.91
                                                                                                                  Aug-21                 1.83                                                                      Aug-21                    18.81
                                                                                                                  Sep-21                             3.47                                                          Sep-21                       22.99
Sources of Alpha- Some winners identified early
                                                                             Weightage (%) in Portfolio
  6
                 5.05
       5.02

                           4.56

  5

                                                                      3.98
                                        3.91
                    3.83
          3.61

                                                                                  3.53
  4
                                                  3.30
                                     3.23
                              3.10

                                                                                         2.90
                                                            2.74

  3

                                                                               2.44
                                                         2.37

                                                                                                                                                     2.38
                                                                                                                          2.32
                                                                                                   2.32
                                                                   2.32
                                               2.31

                                                                                                                                 2.22

                                                                                                                                              2.20
                                                                                            2.15

                                                                                                                                 2.17

                                                                                                                                                               1.95

                                                                                                                                                                            1.85
                                                                                                                                          1.75
                                                                                                             1.76

                                                                                                                                                                                    1.62
                                                                                                                                                        1.59

                                                                                                                                                                                   1.55
  2

                                                                                                                                                                         1.46
                                                                                                                                                                  1.26
                                                                                                                       1.27
                                                                                                                1.17
                                                                                                      1.09
  1

  0
       Apr-20    May-20    Jun-20    Jul-20    Aug-20    Sep-20    Oct-20      Nov-20    Dec-20    Jan-21    Feb-21    Mar-21    Apr-21   May-21     Jun-21    Jul-21    Aug-21    Sep-21

                                                                     Bharat Rasayan Ltd              Dixon Technologies

      • Companies have positive Operating Cash Flow (OCF) 70% of the time
      • Low Debt/Equity
      • No Corporate Governance issues

Source: Bloomberg. These stocks are only for illustration purposes and not a recommendation for investors.
Fund Performance
                   Performance (CAGR)                                   Fund                Nifty Midcap 100 TR Index ^        Nifty 50 TR Index #
                         Period                           Returns (%)     Value (INR) *    Returns (%)     Value (INR) *    Returns (%)   Value (INR) *
  PGIM India Mid Cap Opportunities Fund(G) – Regular Plan
 Last 1 Year                                              87.82                18,781.68      80.55             18,054.56      58.54         15,854.13
 Last 3 Years                                             34.24                24,211.97      22.13             18,227.47      18.63         16,703.89
 Last 5 Years                                                19.85             24,742.95      15.72             20,758.82      16.82         21,766.55
 Since Inception                                             20.19             42,240.00      20.38             42,746.62      15.63         31,193.80
   PGIM India Mid Cap Opportunities Fund(G)-Direct Plan
 Last 1 Year                                                 91.54             19,153.59      80.55             18,054.56      58.54         15,854.13
 Last 3 Years                                                36.55             25,482.77      22.13             18,227.47      18.63         16,703.89
 Last 5 Years                                                21.79             26,814.02      15.72             20,758.82      16.82         21,766.55
 Since Inception                                             21.64             46,390.00      20.38             42,746.62      15.63         31,193.80

Data as on September 30, 2021. Date of Inception: Regular Plan: December 02, 2013; Direct Plan: December 02, 2013. CAGR – Compounded
Annual Growth Rate. ^ Scheme Benchmark. # Standard Benchmark. *Based on standard investment of Rs.10,000 made at the beginning of the
relevant period. All the above returns are in CAGR. Past performance may or may not be sustained in future and should not be used as a basis for
comparison with other investments. Different plans have a different expense structure. Mr. Aniruddha Naha is managing this fund since April 05,
2018 and Mr. Vivek Sharma is managing this fund since June 01, 2021. No other schemes are managed by Vivek Sharma.
Fund Performance
                      Performance of other schemes managed by Aniruddha Naha
    Period               Last 1 Year                    Last 3 Years                     Last 5 Years                            Fund Manager Details
                   Scheme       Benchmark        Scheme        Benchmark         Scheme        Benchmark                         Fund         Managing
 Scheme Name                                                                                                   Benchmark
                     (%)           (%)             (%)            (%)              (%)            (%)                           Manager        Since
 PGIM India
                                                                                                                               Aniruddha
 Flexi Cap          73.58           62.87         28.67           19.50            19.43          16.62         Nifty 500                April 5th, 2018
                                                                                                                                 Naha
 Fund

       Period                   Last 6 Months                          Since Inception                                        Fund Manager Details
                                            Benchmark                            Benchmark                                   Fund
 Scheme Name            Scheme (%)                           Scheme (%)                                 Benchmark                         Managing Since
                                               (%)                                  (%)                                     Manager
 PGIM India                                                                                         CRISIL Hybrid
 Balanced                   10.58             12.41             12.90               12.04          50+50 Moderate Aniruddha Naha           Feb 4th, 2021
 Advantage Fund                                                                                        Index

 Past performance may or may not be sustained in future and should not be used as a basis for comparison with other investments. CAGR –
 Compounded Annual Growth Rate. The above returns are for Regular Plan - Growth Option. All the above returns are in CAGR. Different plans
 have a different expense structure. Mr. Aniruddha Naha is managing 4 schemes of PGIM India Mutual Fund. PGIM India Flexi cap fund is co-
 managed with Anandha Padmanabhan Anjeneyan (Equity portion) and Ravi Adukia (Overseas Investment). Returns for PGIM India Small Cap
 Fund are not provided, as the scheme has not completed 6 months of performance. PGIM India Balanced Advantage Fund returns for less than 6
 months are Simple Annualised Returns and is co-managed by Mr. Hitash Dang (Equity Portion), Mr. Kumaresh Ramakrishnan (Debt Portion) and
 Mr. Ravi Adukia (Overseas Investment). On account of the difference in the features of the schemes, the performance of these schemes is not
 strictly comparable. . Please refer to www.pgimindiamf.com for details on performance of all schemes including direct plans.. Performance as on
 September 30, 2021
Fund Facts
 Scheme Name           PGIM India Midcap Opportunities Fund
  Type of scheme       Mid Cap Fund - An open - ended equity scheme predominantly investing in mid cap stocks

     Investment        The primary objective of the Scheme is to achieve long-term capital appreciation by predominantly
      objective        investing in equity & equity related instruments of mid cap companies.

                       IDCW** (Payout of Income Distribution cum Capital Withdrawal option / Reinvestment of Income
   Plan / Options
                       Distribution cum Capital Withdrawal option) and Growth.

                       10% of the units allotted may be redeemed/switched-out to debt schemes/PGIM India Arbitrage Fund
                       without any exit load within 90 days from the date of allotment of units; Any redemptions/switch-outs in
                       excess of the abovementioned limit would be subject to an exit load of 0.50%, if the units are
     Exit Load         redeemed/switched-out to debt schemes/PGIM India Arbitrage Fund within 90 days from the date of
                       allotment of units; Nil - If the units are redeemed/switched-out after 90 days from the date of allotment
                       of units. No exit load will be charged for switches and STP between any open-ended equity schemes,
                       hybrid schemes (except PGIM India Arbitrage Fund) and fund of funds schemes.
                       Mr. Aniruddha Naha
   Fund Manager
                       Mr. Vivek Sharma

 Benchmark Index       Nifty Midcap 100 TR Index

**Income Distribution cum Capital Withdrawal option
Riskometer and Important Disclosures
PGIM India Midcap Opportunities Fund
(An open-ended equity scheme predominantly
         investing in mid cap stocks)

    AUM Breakup: Asset class wise disclosure of AAUM: AUM as on June 30, 2021 (Rs in Crores): Income: 1,473.23, Equity Other than ELSS: 3,670.66, Balanced: 0.00,
    Liquid: 782.42, Gilt: 132.38, Equity ELSS: 359.44, Hybrid: 1,117.35, GOLD ETF: 0.00, Other ETF: 0.00, Fund of Fund Investing Overseas: 1,524.29, Total: 9,059.75;
    Average AUM for the month: Income: 1,539.34, Equity Other than ELSS: 2,861.28, Balanced: 0.00, Liquid: 1,002.65, Gilt: 125.49, Equity ELSS: 356.52, Hybrid: 951.88,
    GOLD ETF: 0.00, Other ETF: 0.00, Fund of Fund Investing Overseas: 1,273.05, Total: 8,110.22; Disclosure of percentage of AUM by geography: % of Total AUM as
    on June 30, 2021: Top 5 cities: 50.15%, Next 10 cities: 16.73%, Next 20 cities: 4.89%, Next 75 cities: 28.24%, Other: 0.00%, Total: 100.00%; Disclosure of AUM by
    Service Category: AUM as on June 30, 2021 (Rs. in Crores): Mutual Funds: 9,060.00, PMS: 128.00, Advisory: 2,338.00, Total: 11,526.00.
    The information contained herein is provided by PGIM India Asset Management Private Limited (the AMC) on the basis of publicly available information, internally
    developed data and other third party sources believed to be reliable. However, the AMC cannot guarantee the accuracy of such information, assure its completeness,
    or warrant such information will not be changed. The information contained herein is current as of the date of issuance* (or such earlier date as referenced herein) and
    is subject to change without notice. The AMC has no obligation to update any or all of such information; nor does the AMC make any express or implied warranties or
    representations as to its completeness or accuracy. There can be no assurance that any forecast made herein will be actually realized. These materials do not take into
    account individual investor's objectives, needs or circumstances or the suitability of any securities, financial instruments or investment strategies described herein for
    particular investor. Hence, each investor is advised to consult his or her own professional investment / tax advisor / consultant for advice in this regard. The information
    contained herein is provided on the basis of and subject to the explanations, caveats and warnings set out elsewhere herein. The views of the Fund Manager should
    not be construed as an advice and investors must make their own investment decisions regarding investment/ disinvestment in securities market and/or suitability of the
    fund based on their specific investment objectives and financial positions and using such independent advisors as they believe necessary
    © 2020 Prudential Financial, Inc. (PFI) and its related entities. PGIM, the PGIM logo, and the Rock symbol are service marks of PFI and its related entities, registered
    in many jurisdictions worldwide.
    MUTUAL FUND INVESTMENTS ARE SUBJECT TO MARKET RISKS, READ ALL SCHEME RELATED DOCUMENTS CAREFULLY.

    Dated: October 12 , 2021                                                                                                                            C194/2021-22

    www.pgimindiamf.com • Toll-Free: 1800-2667-446 • Connect with us on
You can also read