Moving forward together - Performance scorecards 9th January 2020 - Ofcom
←
→
Page content transcription
If your browser does not render page correctly, please read the page content below
Moving forward together
     Performance scorecards
          9th January 2020
Contents
Page   Content
3      Understanding performance in essential service sectors
4      Working together
6      Performance across our sectors
9      Cross sector metrics – UKCSI
10     Performance scorecard – Telecoms
13     Performance scorecard – Energy
18     Performance scorecard – Water & Sewerage
24     Performance scorecard – Banking & Building Societies

Understanding performance in essential
service sectors
Understanding and monitoring the performance of the sectors we regulate is an important
tool for improving consumer outcomes.
This document provides insight into how effectively companies in water, energy, telecoms and essential financial services are
delivering for their consumers. Working with Ofgem, Ofcom, Ofwat, the Consumer Council for Water and the FCA, the UK
Regulators Network (UKRN) have brought together key consumer metrics covering service quality, price differentials and
satisfaction levels.
These metrics draw on the extensive research and data collected within each of these sectors, providing a high level view as
well as a signposting users to those more detailed metrics. More information from each of the regulators and CC Water on
the metrics that they collect in their sector can be found by clicking on their logos below.
We intend that these performance scorecards will:
• Help regulators and regulated companies determine where to focus action;
• Increase the incentives for suppliers to improve performance
• Provide regulators and policymakers with indicators that will help identify and address any common challenges across
  sectors
Working together

Collaboration has been at the heart of this project, with regulators and UKRN working
together to build a picture of the consumer experience across the sectors they regulate.
Collaboration will continue to play an important role in understanding the performance of and consumer experience in our
sectors.
Consumer Minister, Kelly Tolhurst, said “Performance scorecards will be a welcome step for customers: providing them with
trusted, impartial information to compare how well companies deliver for their customers. This will help people make an
informed judgement about who should provide them their water, telecoms, energy, and essential financial services, but it will
also incentivise companies to improve their performance to attract customers and beat their competition. I will continue to
work with the UK Regulators Network and regulators to expand the information available in the scorecards.”
Jonathan Oxley, CEO of UKRN, said “Understanding the experience of consumers across our sectors is a vital part of
improving consumer outcomes. I am delighted at the ways in which our members have worked together, building on their
extensive sectoral knowledge to create shared insight. I hope this project helps consumer groups and other interested parties
recognise where consumer needs can be best served.”
Working together
Dr Mike Keil, Head of Policy and Research at the Consumer Council for Water, said: “Bringing together the
wealth of information we share on consumers’ experiences is an invaluable tool in helping us turn up the
heat on utility providers that are falling short of their customers’ expectations. Our hope is that this project
will also act as a catalyst for even closer collaboration between regulators and consumer groups.”
John Russell, Senior Director of Strategy and Planning from Ofwat, said “I welcome the publication of the first iteration of
the UKRN performance scorecards. Turning data into actionable insights is one of the key themes of Ofwat’s new strategy,
and I am confident that bringing together these metrics into one place will make it easier for stakeholders and the public to
understand how well regulated businesses across our sectors are performing”.
Mary Starks, Director of Consumers and Markets at Ofgem, said: “We are committed to improving transparency in the energy
sector to enable consumers to make informed decisions and support measures to do this across all regulated utilities and
services. The UKRN’s scorecard is a welcome development towards this objective and will help ensure companies across all
sectors look to improve the service they give to consumers.”
Lindsey Fussell, Consumer Group Director from Ofcom, said “When you’re shopping around for a phone or broadband
provider, there are lots of different things to think about – from price to the quality of service you’re likely to get. These
scorecards help people to easily compare how different providers perform, so they can choose the right service for them.”
Chris Woolard, Executive Director of Strategy and Competition from FCA, said “The UKRN scorecard is an important step
forward in bringing key information for consumers together in one place. Working together the regulators have created an
accessible resource which will help consumers when they are making important decisions about providers of vital services.”
Performance across our sectors
Within the performance scorecards we have included a range of metrics we believe will
be of interest and that will help to identify where consumers are being well-served and
where performance need to improve.
We have summarised some of the key takeaways here around satisfaction, service quality, value for money and complaints.
However, it is important to note that the metrics all use different methodology and cannot therefore be directly compared
across sectors. These slides also include other metrics that may help stakeholders, including net promoter score (NPS) and
price differentials in the energy sector.

Satisfaction/service quality
The level of customer satisfaction is generally high, there are gaps in all sectors between the stronger performers and those
in need of further improvement. For example, customer satisfaction levels in telecoms vary from 96% for the top
performing provider in the mobile sector, to a 79% satisfaction level for the lowest performer, a broadband provider. In
energy, customer satisfaction levels with suppliers range between 73-78%, with an average score of 74%.
When looking at Overall Service Quality in water and sewerage, an average of 40% of customers say they would be very
likely to recommend their supplier (represented by a score of 9 or 10 on a 1-10 scale). When we look at the top performing
company in this sector this increases to 58% of customers.
Performance across our sectors
For personal current accounts, survey results published in August 2019 show that that the proportion of
customers who are either very or extremely likely to recommend their personal current account provider to friends
and family varies considerably, from 82% for the highest performing provider to 46% for the lowest.

Net Promoter Score
We have also included the NPS scores in the water, energy and telecom sectors. NPS is calculated as the proportion of
consumers who are promoters of their supplier/provider minus those who are detractors. Consumers are asked: On a scale of
0 to 10, how likely are you to recommended your supplier/provider to a friend, family member or colleague? Responses are
grouped as follows: Promoters (score 9-10); Passives (score 7-8); Detractors (score 0-6). The score can range from a low of
-100 (if every customer is a Detractor) to a high of 100 (if every customer is a Promoter). Based on the global NPS standards,
any score above 0 is considered “good”, a score of 50 and above is considered “excellent”.
In Water 18 of the 21 companies (86%) received a positive NPS score, with scores ranging from an NPS of -10 to 44 (17
average NPS). In Energy the larger and medium size suppliers (accounting for 92% of the market), range between an NPS of -
15 to 17 (-6 average NPS). In Telecoms, of the suppliers listed the range in NPS is -7 to 53. The supplier with an NPS of 53 in
Telecoms is the highest NPS seen across the 3 sectors.

                                                   Energy               Telecoms         Telecoms          Telecoms
                     Sector     Water
                                            (Large/Medium/Small)         Landline        Broadband          Mobile
       Average NPS score          17                  -6                   16                12               30
Performance across our sectors Value for money The scorecards also capture some metrics on perceptions of value for money. These include perceptions of the value for money among mobile customers, where between 82% and 97% of customers are satisfied with the value for money they receive from their supplier. For water, the range is between 56% and 85% of customers who believe they get good value for money, and for sewerage it is between 57% and 84%. Complaints Complaints are not comparable across sectors because of the different ways complaints processes are structured and information is collected and reported to the regulators. In energy, the complaints are reported by suppliers for large and medium size (per 100,000 accounts) and smaller suppliers (per 10,000 accounts). The number of complaints varies between 2.287% to 0.105% for large and medium suppliers to 13.38% to 0.005% for the smaller suppliers. In water, written complaints are reported per 10,000 properties and the average percentage of complaints is less than 1% (0.22%) across the 21 water companies in the scorecard, with the highest figure being 0.46%. In telecoms the complaints figure is reported directly to the regulator and is recorded per 100,000 subscribers, the figures across mobile, landline and broadband are also all below 1%, with the highest figure being 0.1%. In banking, firms report to the regulator complaints opened per 1000 accounts. In the latest figures reported, the highest complaints recorded the total was 0.85%.
Cross-sector metrics - UKCSI
 In addition to the detailed metrics from each individual sector, we have also included the
 sector scores from the UKCSI survey published by The Institute of Customer Service.
 UKCSI is a national benchmark of customer satisfaction. It is published twice a year and has run since 2008. The results shown
 below are from the July 2019 survey. The sector scores provide a high level view of how each sector performs based on five
 dimensions: experiences with the organisations; complaint handling; and perceptions of an organisation’s customer ethos,
 emotional connection and ethical behaviour.
 UKCSI scores are expressed as an index score out of 100. UKCSI covers 13 sectors and is based on 45,000 responses. 242 named
 organisations receive a UKCSI rating. More details about how the survey works and further information about The Institute of
 Customer Service, including how they work with companies to improve the consumer experience, can be found here.
                                                                Complaint        Customer         Emotional
                   Sector    UKCSI score       Experience                                                             Ethics
                                                                 handling          Ethos          Connection
UKCSI (13 sectors) average       77.1             78.3             59.2             76.6             76.1             75.0
Banks & Building Societies       79.7             81.2             61.6             78.7             78.4             76.9
       Telecoms & Media          74.7             76.0             58.3             74.0             72.7             72.1
                   Energy        71.3             72.9             55.0             70.3             68.5             68.2
                   Water         73.4             74.8             64.6             72.6             71.8             71.0
Performance scorecard
Telecoms
v vMobile providers
Overall
average
significantly higher or lower than
Satisfaction1 93% N/A 93% 96% 92% 90% 92% 91% 93% previous year at the 99% confidence
level for market research results
NPS1 30 N/A 29 53 28 44 22 37 26 significantly higher or lower than the
overall sector average at the 95%
X%
confidence level for market research
Complaints to Ofcom results
per 100k subscribers2
17 29 10 N/A 12 3 14 41 32
significantly higher or lower than the
overall sector average at the 95%
Satisfaction with value for X%
confidence level for market research
money3
87% N/A 85% 97% 85% 92% 88% N/A 82% results
1. Source: Ofcom Customer Satisfaction Tracker 2019. (see notes A/B/F/G/H/I in Annex 1 for more details). Fieldwork: 3 January – 6 February 2019. Notes; the overall average relates only to the providers included
in the analysis (inclusion criteria: providers with a 4% or more market share). No data for BT Mobile due to it not meeting the inclusion criteria for this study.
2. Source: Ofcom CCT data. Notes: All figures are rounded to the nearest whole number; the overall average relates only to the providers included in the analysis. Annualised for 2018. Visit Ofcom’s website to see
the latest quarterly telecoms complaints data.
3. Source: Ofcom Customer Satisfaction Tracker 2019. (see note A in Annex 1 for more details). Fieldwork: 3 January – 6 February 2019. Notes; the industry average relates only to the providers included in the
analysis. Satisfaction with value for money data only asked among those with a standalone service, so does not include those who purchase their mobile service as part of a bundle. No data for satisfaction with
value for money for Virgin Mobile due to insufficient base size.
v vBroadband providers Overall
average
Satisfaction1 83% 80% 87% N/A 86% N/A 83% 79% 85%
NPS1 12 5 9 N/A 25 N/A 13 -7 19
Complaints to Ofcom
per 100k subscribers2
58 79 36 N/A 101 N/A 20 96 51
significantly higher or lower than
Landline providers previous year at the 99% confidence
level for market research results
significantly higher or lower than the
Satisfaction1 86% 88% 90% N/A 89% N/A 86% 81% 83% X%
overall sector average at the 95%
confidence level for market research
results
NPS1 16 17 9 N/A 19 N/A 17 4 18 significantly higher or lower than the
overall sector average at the 95%
X%
confidence level for market research
Complaints to Ofcom
per 100k subscribers2
43 48 23 N/A 76 44 18 70 45 results
Ofcom monitors and reports separately on the extent to which broadband providers differentiate their prices for different groups of customers. The latest broadband pricing data we have can be found at:
Pricing trends in communication services: 2019 and Helping consumers get better deals: A review of pricing practices in fixed broadband.
1. Source: Ofcom Customer Satisfaction Tracker 2019. (see notes A/B/F/G/H/I in Annex 1 for more details). Fieldwork: 3 January – 6 February 2019. Note; the overall average relates only to the providers included in the
analysis (inclusion criteria: providers with a 4% more market share). No data for KCOM or Post Office due to not meeting the inclusion criteria for this study.
2. Source: Ofcom CCT data. Notes: All figures are rounded to the nearest whole number; the overall average relates only to the providers included in the analysis. Annualised for 2018. Visit Ofcom’s website to see the
latest quarterly telecoms complaints data. Note: Satisfaction with value for money data is not available for landline and broadband because the question was only asked among those with a standalone service.
v vPerformance scorecard
Energy
vCustomer satisfaction and likelihood to recommend
Overall
Six largest
Average (Great Medium suppliers Small suppliers
suppliers
Britain)
Customer satisfaction1
% who are satisfied with their supplier 74% 73% 78% 72%
Likelihood to recommend and Net Promoter Score2
% who are Promoters 28% 22% 40% 29%
% who are Passive 38% 40% 37% 36%
% who are Detractors 34% 38% 23% 35%
Net Promoter Score
-6 -15 17 -6
(Promoters minus Detractors)
1. % satisfied with their supplier overall is the proportion of domestic energy consumers who are satisfied or very satisfied with their energy supplier overall. This data comes from the quarterly ‘Consumer Perceptions of the Energy
Market Survey’ commissioned by Ofgem in conjunction with Citizens Advice. Data was collected in Q3 2019. The report detailing the survey method and sample sizes can be located by following the link above.
2. 2. Net Promoter Score is calculated as the proportion of domestic energy consumers who are promoters of their energy supplier minus those who are detractors. Consumers are asked: On a scale of 0 to 10, how likely are you to
recommended your energy company to a friend of colleague? Responses are grouped as follows: Promoters (score 9-10); Passives (score 7-8); Detractors (score 0-6). Data comes from Ofgem’s annual Consumer Engagement Survey and
was collected in Q3 2019. The report detailing the survey method and sample sizes can be located by following the link above..
3. How are suppliers grouped?
There are around 60 licensed suppliers that are active in the retail energy market. We group them as follows:
• Six largest suppliers: British Gas, E.ON, EDF Energy, npower, Scottish Power, SSE
• Medium suppliers: Avro Energy, Bulb, Co-operative Energy, Octopus Energy, OVO Energy, Shell Energy, Utility Warehouse, Utilita
• Small suppliers: all other suppliers
As of July 2019, the large six suppliers together accounted for around 72% of the market, the medium suppliers together accounted for 21% of the market and small suppliers accounted for 8% of the electricity market. You can access
supplier market share data on the Ofgem data portal
vEnergy prices Q3 2019
For a typical dual fuel customer paying by direct debit.
The relevant default tariff cap during this period was £ 1254. Visit Ofgem’s website to learn more about the default tariff price cap.
The cheapest in market was £855
Scottish
Energy provider British Gas E.ON EDF npower SSE
Power
Average annual Standard Variable Tariff 3 £1254 £1254 £1254 £1254 £1254 £1253
Average annual Cheapest Tariff 4 £1198 £1008 £955 £977 £1010 £1093
Co-operative Octopus Utility
Energy provider Avro Energy Bulb Ovo Energy Shell Energy
Energy Energy Warehouse
Average annual Standard Variable Tariff 3 £1057 £1000 £1253 £1029 £1249 £1254 £1224
Average annual Cheapest Tariff 4 £891 £1000 £1003 £987 £1099 £1065 £1023
3. A Standard Variable Tariff (SVT) is a supply contract with an indefinite length that does not have a fixed-term applying to the terms and conditions. It’s an energy supplier’s basic offer. If a customer does not choose a specific energy plan,
for example after their fixed tariff ends, they are moved to an SVT until they choose a new one. A customer can also make an active choice to select an SVT.
Tariffs are calculated for a typical dual fuel customer paying by direct debit. This is a customer who takes gas and electricity from the same supplier and consumes 12,000kWh/year for gas and 3,100kWh/year for electricity.
4. Ofgem uses weekly prices across the relevant quarter to calculate the average SVT price and the average cheapest tariff price for each supplier, as well as the average market cheapest tariff price. When calculating the cheapest tariff at
both individual supplier and market level, Ofgem excludes tariffs restricted to certain regions. This is to give a representative picture of tariffs generally available to all customers across Great Britain. When calculating the cheapest tariff at
individual supplier level, only tariffs available to existing customers (also known as ‘retention' tariffs) are included. Tariffs only available to new customers (also known as ‘acquisition’ tariffs) are excluded.
This information is available and regularly updated on Ofgem's data portal.
vCustomer complaints Q3 2019
Large and
medium
Scottish
suppliers Energy provider British Gas E.ON EDF npower
Power
SSE
Number of complaints received
per 100K gas and electricity 1228 2711 2287 2160 1894 2470
accounts
Co-operative Octopus Utility
Energy provider Avro Energy Bulb
Energy Energy
Ovo Energy Shell Energy Utilita
Warehouse
Number of complaints received
per 100K gas and electricity 105 383 1086 266 1467 1871 576 1179
accounts
Complaints data refers to complaints directly received by suppliers. This information is available and regularly updated on Ofgem's data portal.
vCustomer complaints Q3 2019
Selection
Energy provider Better Energy Bristol Energy Daligas E Entice Energy Enstroga
of small
suppliers Number of complaints received per
10 192 39 64 272 201
10K gas and electricity accounts
Green Star
Energy provider ESB Energy Ecotricity Engie Foxglove Flow Energy
Energy
Good Energy
Number of complaints received per
37 79 118 64 749 495 80
10K gas and electricity accounts
Green Energy Gulf Gas &
Energy provider GnERGY
UK Power
iSupply Nabuh Energy Orbit Energy PFP
Number of complaints received per
11 6 66 73 1338 45 171
10K gas and electricity accounts
Together
Energy provider Robin Hood So Energy
Energy
Tonik Utility Point Zog Energy Zebra Power
Number of complaints received per
119 10 396 62 19 6 5
10K gas and electricity accounts
* Note as many small suppliers have fewer than 100,000 (one hundred thousand) customers, complaints data is reported as number of complaints per 10,000 (ten thousand) customers.
Complaints data refers to complaints directly received by suppliers. This information is available and regularly updated on Ofgem's data portal.
vPerformance scorecard
Water and sewage
v vLikelihood to Recommend
Customers were asked how likely they would be to recommend their water company? (0-10 scale)
Percentage who scored their provider with 9 or 10 rating’ shown
Latest Results - July 2019
Essex &
Water Company Affinity Water Anglian Bournemouth Bristol Cambridge Dwr Cymru
Suffolk
Likelihood to Recommend 32% 40% 45% 43% 47% 55% 47%
Water Company Hafren South
Hartlepool Northumbrian Portsmouth Severn Trent South East
Dyfrdwy Staffordshire
Likelihood to Recommend 45% 58% 53% 47% 39% 34% 36%
Sutton & East United
Water Company South West Southern Thames Wessex Yorkshire
Surrey Utilities
Likelihood to Recommend 29% 28% 34% 39% 37% 38% 53%
v vSatisfaction: Water (W) & Sewerage (S)
Customers were asked ‘when thinking about satisfaction with water services and satisfaction with sewerage services,
how satisfied or dissatisfied are with your service?’ (0-5 scale) -Percentage who scored their provider with a 4 or 5rating’ shown
Affinity Essex &
Water Company Anglian Bournemouth Bristol Cambridge Dwr Cymru
Water Suffolk
Satisfaction with Service: Water 86% 88% 95% 97% 96% 94% 91%
Satisfaction with Service: Sewage 87% 81% 91% 91% 88% 90% 86%
Hafren South
Water Company Hartlepool Northumbrian Portsmouth Severn Trent South East
Dyfrdwy Staffordshire
Satisfaction with Service: Water 93% 96% 92% 91% 91% 93% 93%
Satisfaction with Service: Sewage 90% 93% 90% 80% 88% 82% 87%
Sutton & United
Water Company South West Southern Thames Wessex Yorkshire
East Surrey Utilities
Satisfaction with Service: Water 90% 88% 91% 83% 90% 91% 95%
Satisfaction with Service: Sewage 77% 86% 78% 76% 87% 87% 88%
v vNet Promoter Score (NPS)
Respondents are grouped as follows:-Promoters (score 9-10) are loyal enthusiasts. -Passives (score 7-8) are
satisfied but unenthusiastic customers. -Detractors (score 0-6) are unhappy customers
Latest Results - July 2019
Essex &
Water Company Affinity Water Anglian Bournemouth Bristol Cambridge Dwr Cymru
Suffolk
Net Promoter Score 0 18 27 24 29 44 25
Hafren South
Water Company Hartlepool Northumbrian Portsmouth Severn Trent South East
Dyfrdwy Staffordshire
Net Promoter Score 25 37 38 24 20 3 13
Sutton & East United
Water Company South West Southern Thames Wessex Yorkshire
Surrey Utilities
Net Promoter Score -10 -7 10 6 16 18 38
The NPS is calculated by subtracting the % of Detractors from the % of Promoters
v vValue For Money (VFM): Water (W) & Sewerage (S)
Customers were asked ‘when thinking about value for money, how satisfied or dissatisfied are you with the VFM of your service?’
(0-5 scale) - Percentage who scored their provider with a 4 or 5 rating’ shown
Essex &
Water Company Affinity Water Anglian Bournemouth Bristol Cambridge Dwr Cymru
Suffolk
Value For Money: Water 65% 72% 85% 75% 68% 82% 71%
Value For Money: Sewage 71% 74% 84% 76% 68% 83% 66%
Hafren South
Water Company Hartlepool Northumbrian Portsmouth Severn Trent South East
Dyfrdwy Staffordshire
Value For Money: Water 76% 84% 75% 77% 78% 69% 72%
Value For Money: Sewage 76% 82% 78% 69% 79% 73% 76%
Sutton & East United
Water Company South West Southern Thames Wessex Yorkshire
Surrey Utilities
Value For Money: Water 56% 62% 67% 65% 71% 75% 77%
Value For Money: Sewage 57% 63% 64% 70% 80% 79% 79%
v vComplaints – Written, per 10,000 Properties
Latest Results - September 2019
Essex &
Water Company Affinity Water Anglian Bournemouth Bristol Cambridge Dwr Cymru
Suffolk
Complaints – Written
14.9 21.8 10.7 26.2 15.4 18.6 36.2
per 10,000 Properties
Hafren South
Water Company Hartlepool Northumbrian Portsmouth Severn Trent South East
Dyfrdwy Staffordshire
Complaints – Written
46.6 20.8 34.1 10.3 26.9 18.9 9
per 10,000 Properties
Sutton & East United
Water Company South West Southern Thames Wessex Yorkshire
Surrey Utilities
Complaints – Written
23 22.8 11.9 37.1 21.7 15.3 15.8
per 10,000 Properties
Severn Trent acquired Dee Valley in July 2018, changing the name to Hafren Dyfrdwy. This resulted in a change to both Severn Trent’s and Hafren Dyfrdwy’s
regions and changed the connected property numbers, therefore the previous year’s comparisons should be treated with caution
v vPerformance scorecard
Personal Current Accounts
vCurrent Account Service Quality
Based on the 16 largest personal current account providers in Great Britain
Overall Service Quality
Customers were asked how likely they would be to recommend their personal current account provider to friends and family1.
Latest results published in August 2019
Bank of Clydesdale
Bank/Building Society Barclays first direct Halifax HSBC UK Lloyds Metro Bank
Scotland Bank
Overall Service Quality 59% 66% 56% 82% 58% 62% 64% 82%
Royal Bank The Co-operative Yorkshire
Bank/Building Society Nationwide NatWest Santander Tesco Bank TSB
of Scotland Bank Bank
Overall Service Quality 74% 61% 46% 61% 55% 55% 56% 59%
These results show the proportion of customers of each provider who said they were ‘extremely likely’ or ‘very likely’ to recommend each service1
Access to the full Ipsos Mori Banking metrics surveys published every six months is available here
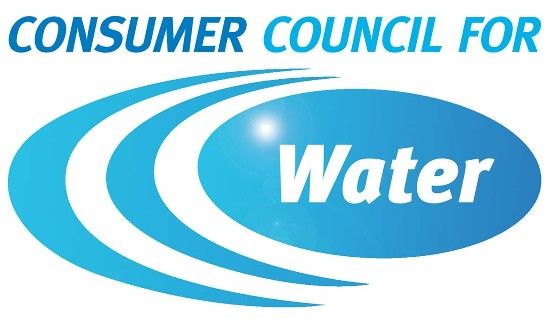
vCurrent Account Service Quality
Based on the 10 firms offering personal current accounts with most complaints in H1 2019*
Firms offering personal current accounts with most Banking and credit card complaints (per 1,000 complaints) H1 2019
*The data we collect includes complaints on credit cards, current accounts, packaged accounts, savings, unregulated loans and overdrafts
and other banking. For the purpose of accurately displaying data more specific to personal current accounts, firms who do not offer personal
current accounts have been excluded.
40.0
35.7
35.0 Complaints on Banking and credit cards (per 1000 Average complaints per 1,000 banking and credit card accounts, all firms
30.0
25.0
20.0
15.0
10.0 8.5 8.4
6.1 6.0 5.5 5.5 5.4 5.2 4.9 4.8
5.0
0.0
Barclays Bank Plc HSBC UK Bank Bank of Ireland TSB Bank plc Barclays Bank UK Investec Bank Coutts & Al Rayan Bank Marks & Spencer Royal Bank of National
Plc (UK) Plc PLC PLC Company PLC Financial Scotland Plc, The Westminster
Services Plc Bank Plc
*Barclays Bank PLC only offers PCAs to high net worth individuals as part of a private banking service, therefore the complaints (as with the other firms)
may be from credit cards, packaged accounts, savings, unregulated loans and overdrafts and other banking. Barclays Bank UK PLC is the ringfenced entity
in the Barclays group that offers mainstream consumer PCAs, and therefore is the best for comparison when looking at PCA complaints.
A link to the latest FCA complaints data published on 17th October can be found here
The figures are complaint numbers opened during the period January 1st 2019 - June 30th 2019 (H1)
vYou can also read