Lead & Copper Rule Midwest Assistance Program - US EPA R8 Drinking Water Program Natalie Cannon
←
→
Page content transcription
If your browser does not render page correctly, please read the page content below
Lead & Copper Rule
 Midwest Assistance Program

  US EPA R8 Drinking Water Program
           Natalie Cannon
             April 2019
                                     1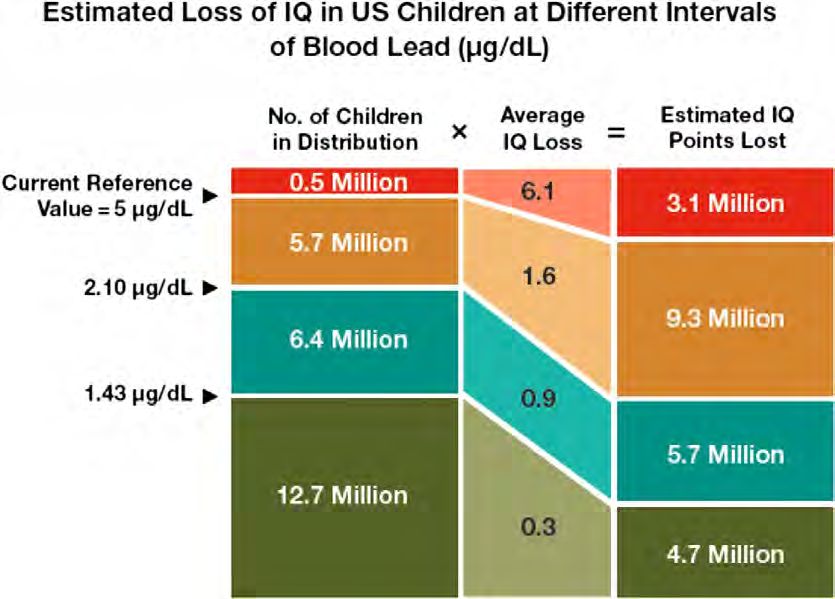
Presentation Talking Points
•   Lead and Copper Rule (LCR) Overview
•   Health Effects
•   Monitoring & Reporting
•   Tap Sampling Protocol & Sampling Plan
•   Lead Consumer Notice
•   90th Percentiles
•   Action Level Exceedance (ALE)
•   Corrosion Control                        2
Presentation Talking Points

• Lead in Schools
• Open Discussion

                                        3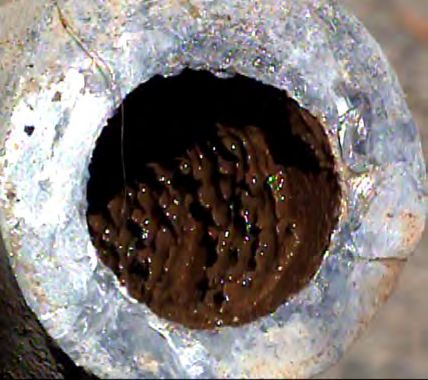
Why Lead?
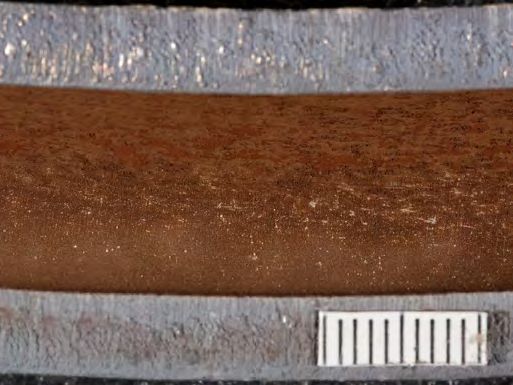
Installed After the Civil War 150 Years Old in Cincinnati:
                   Any Signs of Failure?

Compliments of Mike Schock, EPA Office of Research & Development (ORD)
                                                                         4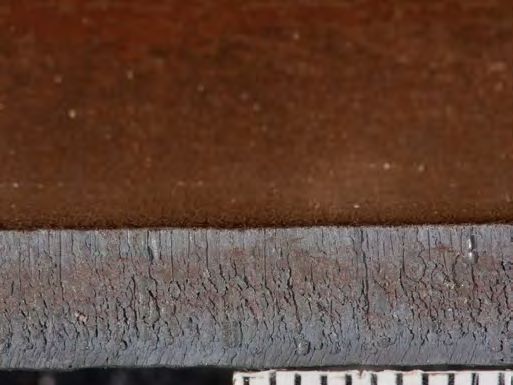
Lead and Copper Rule Overview

• The Lead and Copper Rule (LCR) was originally published in 1991
• The Revised LCR is under Development
• Applies to Community (CWS) & Non-transient Non-community (NTNC)
  Public Water Systems (PWS)
• Transient Water Systems are Not Required to Comply with LCR

                                                                    5
Lead and Copper Rule Overview
• The LCR is based on Treatment Techniques, not Health Limits
• The Rule sets Action Levels (AL) rather than Maximum Contaminant
Levels (MCL):
Lead (Pb) = 0.015 mg/L
Copper (Cu) = 1.3 mg/L
There is NO Safe Level for Lead
6http://pediatrics.aappublications.org/content/early/2016/06/16/peds.2016-1493.figures-only
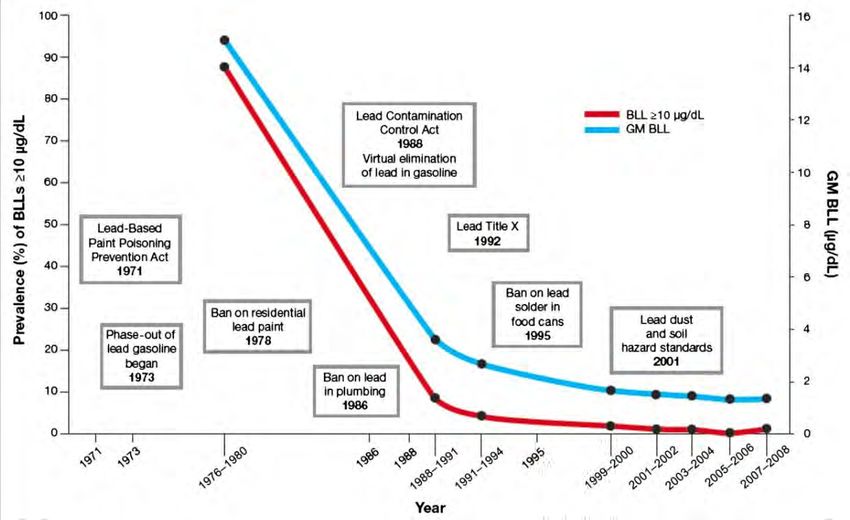
Timeline of lead poisoning prevention policies and blood lead levels in children
aged 1–5 years, by year—NHANES, United States, 1971–2008. BLL, blood lead
level; GM BLL, geometric mean blood lead level. Adapted from Brown et al.
7Health Effects of Lead
• Children - cause impaired mental
development, behavioral disorders,
lower IQ, hyperactivity
• Adults – increase blood pressure
risk, mental fog
Lead is odorless and tasteless
http://pediatrics.aappublications.org/content/early/
2016/06/16/peds.2016-1493.figures-only
8Health Effects of Copper
Children – Stomach Distress
Adults – Chronic Exposure can cause Liver Disease
Water systems don’t typically hear complaints
until the copper levels are more than double
the Action Level so exposure so the chronic
effects of copper can be silent.
910
Monitoring & Reporting

• Standard (6-month) – New Systems, Systems that Exceed the AL, Systems
  that FTM 2x
• Reduced Monitoring – Annual or Triennial

                                                                     11
Monitoring & Reporting
Standard (6-month) Monitoring Periods
• Sample between January 1 and June 30; July 1 and December 31
• Two rounds of consecutive standard monitoring with results below the
Action Levels may qualify your System for reduced monitoring
Reduced Monitoring – Annual or Triennial Monitoring Periods
• Sample between June 1 and September 30
12A message from EPA Headquarters
WSG 200, October 13, 2016
Signed by Peter Grevatt – Director OGWDW
EPA Regions should act in their oversight capacity, to clearly communicate the
expectation that primacy agencies will critically consider relevant aspects of a
water system's LCR program including corrosion control treatment and
historical performance before granting triennial monitoring. In addition, where
the primacy agency finds that a public water system is lacking in technical,
managerial, and financial capacity, the primacy agency could decide to keep the
system on an annual LCR monitoring schedule.
Reduced Monitoring is a Privilege and can be Redacted
13Monitoring & Reporting Requirements Form
• Summary of Sampling
Requirements Emailed to
PWS in February
• Drinking Water Online
• References the LCR TSSP
• Lead Consumer Notice &
Certification of Consumer
Notice for each PWS
14Monitoring & Reporting
Beat the rush!!
Collect samples early in the
Monitoring Period
Use an EPA Certified Lab
Chain of Custody Forms
POP QUIZ: How long must a PWS keep physical copies of LCR data?
15Monitoring & Reporting
Short Deadlines so Sample EARLY – Do Not Wait!!
Avoid those pesky reminder emails from me!
Avoid risking FTMs due to broken bottles in transit to the lab!
Avoid rushing around to find sample locations when the homeowner
forgets to put the samples bottles outside!
Avoid getting a notice from the lab that the sample bottle was not filled
to enough and the sample is invalid!
16Where to Collect Samples
• Distribution System
• Cold-Water Taps that are Regularly
Used for Consumption
• Kitchen Faucet or Bathroom Faucet
• Employee Break Room
• School Cafeteria
17Where NOT to Collect Samples
https://www.google.com/search?q=picture+of+lead+hose+bib+on+a+house&rls=com.microsoft:en-US:IE-
Address&tbm=isch&tbo=u&source=univ&sa=X&ved=2ahUKEwjyz9_R6_7dAhWthOAKHXRLClYQ7Al6BAgFECE&biw=1024&bih=666&dpr=1.25
18When NOT to Collect Samples
19LCR Tap Sample Site Plan (TSSP)
• Materials Evaluations 141.86 Required in 1991
• EPA Requires that all Systems Submit a LCR TSSP
20LCR Tap Sample Site Plan (TSSP)
Water systems must identify the highest priority (Tier) sites to sample.
Community public water systems must sample at all Tier 1 sites if they have
enough Tier 1 sites to choose from.
Tier #1 sites: Single family structures that contains copper pipes with
lead solder installed between 1983 and 1988, or contain lead pipes
and/or served by a lead service line (LSL). If the PWS has LSLs, then it
must collect 50% of the samples from the LSL. If there are not enough
LSLs for 50%, the PWS must sample at all sites with LSLs.
21What if the PWS does not have Tier 1 Sites?
If the PWS does not have enough Tier 1 sites to choose from, then it must
collect LC samples from Tier 2 sites. If there are not enough Tier 1 and Tier
2 sites, then Tier 3 sites must be used:
For Community PWSs:
Tier #2 sites: Buildings (i.e. apartment buildings) that contain the
above materials
Tier #3 sites: Single family structures that contain copper pipes
with lead solder installed before 1983
22Region 8 Tier Structure
If you are a CWS If you are a NTNCWS
Tier 1 sampling sites are single family structures: Tier 1 sampling sites consist of buildings:
• With copper pipes with lead solder • with copper pipes with lead solder
•
installed between 1983 and 1988*; or
contain lead pipes; or •
installed between 1983 and 1988*; or
contain lead pipes; or
Email me or check online
• are served by a lead service line. • are served by a lead service line. for a Cheat Sheet.
Tier 2 sampling sites consist of buildings Tier 2 sampling sites consist of buildings with
(i.e. apartment buildings, schools, hospitals): copper pipes with lead solder installed before
• with copper pipes with lead solder 1983.
installed between 1983 and 1988, or
• contain lead pipes; and/or Tier “Other”:
• served by a lead service line.
• All other structures.
Tier 3 sampling sites are single family structures
with copper pipes having lead solder installed
before 1983.
Tier “Other”:
• All other structures.
23Identifying Plumbing
County Assessor’s Office
Plumbing Codes
Distribution Maps and Drawings
Inspection and Maintenance Records
Meter Installation Records
Building Permits
Engineering Records (As Builts)
2425
Scratch and Swab Test

Courtesy of Denver Water               26
27
Can I Change Sample Sites?
• Great question! Yes
• Submit Revised TSSP to EPA R8
• What are some examples of why you would change your sampling locations?
Homeowner abandons their home
Homeowner decides not to participate anymore
You find a lead service line that you were unaware of
28Operators Must Distribute the Correct
Sample Collection Protocol
Minimum of 6 hours of stagnant water in the pipes prior to sample collection. DO NOT
intentionally flush the water line before the start of the 6 hour period.
Collect a 1-L sample in a wide-mouth bottle from a kitchen or bathroom cold-water faucet
that has been used for consumption in the past few weeks
If the home has a POE, like a water softener, then select a different sampling site
If the home has a POU, like an RO unit under the sink, then select a tap that is not
connected to it
DO NOT remove the aerator prior to sampling
Note any plumbing repairs or replacements on your sample label
29The Sample Collection Protocol is Online
https://www.epa.gov/region8-waterops/reporting-forms-and-instructions-reporting-forms#lcr
“Directions for Homeowner Tap Sample Collection Procedures”
3031
Chain of Custody (COC)

                         32
Monitoring & Reporting
33LCR Sample Invalidation
CFR 141.86(f): A sample invalidated under this paragraph does not count toward determining
lead or copper 90th percentile levels under §141.80(c)(3) or toward meeting the minimum
monitoring requirements of paragraph (c) of this section.
1. The laboratory establishes that improper sample analysis caused erroneous
results.
2. The State determines that the sample was taken from a site that did not meet the
site selection criteria of this section.
3. The sample container was damaged in transit.
4. There is substantial reason to believe that the sample was subject to tampering.
34LCR Sample Invalidation
The State determines that the sample was taken from a site that did not meet
the site selection criteria of this section.
Step 1: Operator Calls LCR Rule Manager to Discuss Situation
Step 2: LCR RM Sends Form to Operator
Step 3: Operator Submits Form to Rule Manager
Step 4: Rule Manager Approves or Disapproves Request
35Let’s Review
1. LCR Sample Site Selection Completed
2. LCR TSSP Submitted to EPA
3. Sample Bottles Received from Lab
4. Sample Collection Protocol Reviewed with Homeowner
5. Samples Collected Early in the Monitoring Period
6. Samples Delivered to Lab with Proper COC
7. Lab Report Submitted to EPA at R8DWU@epa.gov
NOW WHAT? There’s more?!
36Calculate Your 90th Percentile
If you are required to collect less than five
samples (i.e. 5 samples):
Step 1: Place lead or copper results in ascending
order.
Step 2: Take the average of the 4th and 5th
highest sample. This is your 90th percentile level.
Step 3: Compare the 90th percentile level against
the lead or copper action level. If your 90th
percentile value is higher than 0.015 mg/L, you
have an exceedance.
37Calculate Your 90th Percentile If you are required to collect more than five samples (i.e. 10 samples): Step 1: Place results in order from lowest to highest value. Step 2: Assign each sample a number 1 - 10. Step 3: Multiply the total number of samples by 0.9. Step 4: Compare the 90th percentile level to the action level. If your 90th percentile value is higher than 0.015 mg/L, you have an exceedance. 38
Calculate Your 90th Percentile

                                 39
Simply enter your data
and Voila!
Thank you Charles
40Lead Consumer Notice
https://www.epa.gov/region8-waterops/reporting-forms-and-instructions-reporting-forms#lcr
Once you receive the results from the lab, you have 30 days to notify the home
owner of their lead results. Send 1 example notice along with a certification form
to EPA r8dwu@epa.gov. Use the forms on Drinking Water Online!
41Exceeding an Action Level for Lead and Copper
If a PWS exceeds the Action Level for Lead and/or Copper, it must perform certain
actions that lead towards corrosion control:
1. Monitoring of LC increases to once every 6-months and sampling size doubles
2. Distribution of public education materials (lead only)
3. Monitoring of LC at the “source” (EPTDS)
4. Collection of water quality parameters at the source
5. Collection of water quality parameters at taps
6. Submit a recommendation for source water treatment
7. Submit a recommendation for optimal corrosion control
42ALE Deadlines
Public Education (PE) for Lead is due within 60 days of the end of the MP
Water Quality Parameters (WQP) due within 6 months of beginning of the MP
Source Water Monitoring due within 6 months of end of MP
Source Water Treatment Recommendation (SWTR) due within 6 months of end of MP
Corrosion Control Treatment (CCT) Recommendation due within 6 months of end of
MP
Source Water Treatment Recommendation due within 6 months of end of MP
43Sample EARLY – Do Not Wait!!
Public Education (PE) is due within 60 days of the end of the Monitoring Period.
i.e. PWS on annual schedule exceeds AL, monitoring period is
June 1 – September 30, PE is due November 30th.
Water Quality Parameters (WQP) are to be collected within 6 months of the
beginning of the Monitoring Period.
i.e. PWS on 6-month monitoring, exceeds AL, monitoring period is
January 1 – June 30, WQP are due June 30th.
44Corrosion Control
Corrosivity of Water MAY be Impacted by:
• pH & Alkalinity
• Other WQPs such as Dissolved Oxygen
(DO) & Calcium
• Point of Use Devices (i.e. filters)
• Point of Entry Devices (i.e. water softeners)
45Corrosion Control
• pH & Alkalinity Adjustment
• Typically orthophosphate or
sodium silicate
• Once installed, must be
continuously operated
• CANNOT be discontinued
without EPA approval
• Initial and ongoing water quality
monitoring and reporting
46Corrosion Control
If Lead and Copper Levels Persist:
• Optimize treatment (pilot tests)
• Replace lead service lines
(7% per year)
PWS Works Closely with the LCR Rule
Manager to Ensure All Requirements
are Being Met Courtesy of Denver Water 47Corrosion Control
Water is a Universal Solvent
Not an Exact Science
Poor Water Quality
Poor Hygiene in the DS
Competing Metals, i.e. Fe & Mn
Biofilms in the DS
Operational Controls
48Corrosion Control
New Copper Plumbing May Elevate Copper Levels
Often with Copper, Corrosion Control will Happen on its Own
49Corrosion Control
Most Often with Lead, Corrosion Control is Orthophosphate
i.e. Zinc Orthophosphate, Phosphoric Acid
Lead Scales form Interior Lining of Pipe
pH & Alkalinity – Reduce Solubility of Lead
Typically greater than 7.6
50Corrosion Control
Obtain recommendations from chemical suppliers
Check with other water plants
Don’t experiment on the distribution system, pilot test your water first
Consider advantages and disadvantages of storing, handling, and feeding
various chemicals
Corrosion control chemicals can impact compliance with other rules and have
negative downstream side effects
51An ALE is NOT a Violation…
But there are plenty of ways to get hit with
a LCR Violation
52LCR Violations
Monitoring & Reporting
Violations (14)
• Failure to Monitor (FTM)
• Failure to Perform Lead
Consumer Notice (LCCN)
53LCR Violations
Treatment Technique Violations (10)
• Failure to Notify EPA of Changes to PWS
• Failure to Submit Documentation of Required Activities
After ALE
54LCR Violations
LCR Violations FY 2017 WQP Entry
LCR TT Viols, FY 2017
Point/Tap
TT, 739, Treatment MPL Non-
5% Technique Compliance,
Non- 20, 3%
Compliance,
19, 3%
Public
Education,
211, 28%
OCCT/SOWT
OCCT/SOWT
Treatment
Study/Recommend
Installation/De
ation, 445, 60%
monstration,
44, 6%
55
MR, 14742, 95%Water System Changes
If your PWS is considering a change in treatment, source(s), or population; you must
submit a description of the proposed changes to the EPA. The EPA must approve the
addition of a new source or change in treatment before it is implemented.
• Addition of a new treatment process.
• Modification of an existing treatment process, including:
i.e. Switching coagulants, secondary disinfectants, or corrosion inhibitors
i.e. Changes to dose of existing chemicals or other long-term changes to finished
water.
56Change to PWS form
Use the form located on Drinking Water Online:
https://www.epa.gov/region8-waterops/reporting-forms-and-instructions-reporting-forms#chg
57Violations Require Public Notice
58• Public Notice for LCR:
• Currently considered “Chronic”
Contaminants
• Tier 3 Notice
• PN Template Included in
Violation Letter from EPA
59Acute vs. Chronic
6061
Sanitary Surveys
• Where is your LCR TSSP?
• Questions for Consecutive Systems that Receive Water Treated with Corrosion
  Control Chemicals
• New Section on Corrosion Control

                                                                                62
More Key Points to Remember:
• Perform Lead Consumer Notice:
• LCCN Form to Homeowners + LCCN Form & Certification to EPA
• Calculate your 90th Percentile
• If you exceed the Action Level …
You will receive a letter from EPA
63Drinking Water Online
https://www.epa.gov/region8-waterops
64Lead in Schools • Children in schools and child care centers may be exposed through water they drink or food that has been prepared with contaminated water. • Formula fed infants can receive up to 60 percent of their exposure to lead from lead in drinking water. • Lead does not penetrate the skin (i.e. bathing, hand washing). • Boiling water will not get rid of lead. 65
Typical School Building
                          66
Lead in Schools
• 3Ts = Training, Testing, and Telling
• Voluntary Lead Sampling Program
for Schools
• EPA Letter to Bureau of Indian
Education
• Schools May Team up with PWSs
https://www.epa.gov/dwreginfo/drinking-water-schools-and-childcare-facilities
672017 School Webinar Series:
Denver Water and Denver Public Schools
Massachusetts Dept. of Envt. Quality
New York Department of Health
https://www.epa.gov/dwreginfo/reducing-lead-drinking-water-
schools-and-child-care-facilities-case-studies-webinar-series
68The Revised Lead and Copper Rule will be
Open for Public Comment again!
• 2013 Draft Rule – EPA Regions did not ‘concur’.
• EPA engaged National Drinking Water Advisory Council (NDWAC)
• When EPA creates another draft Rule, you will have a chance to comment
on it.
• Your comments will greatly improve the Rule and I encourage you to have
your voice heard!
69Quiz Time!
1. The LCR Applies to Which Water Systems?
Community & Non-transient Non-community Public Water Systems
2. True or False: The MCL for copper is 1.6 mg/L
False! MCLs do not apply to the LCR.
The Action Level for copper is 1.3 mg/L …AL for Lead?
3. LCR Public Notification requires Tier X?
70Questions?
Natalie Cannon
cannon.natalie@epa.gov
(303) 312-6625
71You can also read


