ADSL Availability Report - Kenneth Tsang - accan
←
→
Page content transcription
If your browser does not render page correctly, please read the page content below
ADSL Availability
Report

Kenneth Tsang
jxeeno pty ltd
Contents
Background ...................................................................................................................................... 3
Methodology .................................................................................................................................... 4
   The base unit: a neighbourhood ................................................................................................... 4
   Approximate Premises Count ....................................................................................................... 4
   DSLAM Location .......................................................................................................................... 4
   Under-served Definition ................................................................................................................ 5
   Telstra ADSL/ADSL2+ Port Data.................................................................................................. 5
   NBN three-year construction schedule ......................................................................................... 5
   Other considerations .................................................................................................................... 6
      Pair gain systems ..................................................................................................................... 6
Findings ........................................................................................................................................... 7
   Short Term Outlook ...................................................................................................................... 9
      Too far from exchange .............................................................................................................. 9
      No/Low remaining ADSL/ADSL2+ ports ................................................................................... 9
      Exchange not ADSL enabled .................................................................................................. 11
   Medium Term Outlook ................................................................................................................ 12
      Too far from exchange ............................................................................................................ 12
      No/Low remaining ADSL/ADSL2+ ports ................................................................................. 12
   Long Term Outlook ..................................................................................................................... 12
Conclusions and observations ....................................................................................................... 14
   ADSL availability ........................................................................................................................ 14
      Addressing neighbourhoods too far from the exchange ......................................................... 14
      Addressing neighbourhoods with low ports............................................................................. 14
   Reporting of network availability ................................................................................................. 15
      Telstra Wholesale ADSL ......................................................................................................... 15
      Other ADSL providers ............................................................................................................. 16
      National Broadband Network .................................................................................................. 16
      Other networks ....................................................................................................................... 16
Appendix ........................................................................................................................................ 17
   Appendix A: Tables .................................................................................................................... 17
      Short Term Outlook: Port shortage ......................................................................................... 17
   Appendix B: Datasets used ........................................................................................................ 19
References..................................................................................................................................... 20

                                                                                                                                                    2
Background
In 2016, the majority of broadband services in Australia are available through ADSL technology
delivered over the copper network by Telstra and other telecommunications providers.
Consumers are often unaware of the complex service qualification factors such as port availability
and line distance from exchange that go on behind the scene when a service is ordered. When a
consumer is told their premises cannot be served, it is not always clear what steps they might be
able to take to remedy the situation.
The Telecommunications Industry Ombudsman (TIO 2015) recognised in its Regional
Telecommunications Review submission that it receives a higher number of enquiries about the
unavailability or performance limitations of landline and internet services due to a lack of
infrastructure. This is particularly so for consumers living outside of urban areas, with around 40%
of enquiries logged by regional and remote consumers related to a lack of infrastructure.
The National Broadband Network (NBN) is set to fill these infrastructure gaps. It is designed to be
a wholesale network, eventually reaching 100% of Australian premises at the completion of the
rollout expected in 2020. The NBN will bring broadband to all Australians using a mix of access
technologies, including satellite, fixed wireless and fixed-line technologies. However, at the time of
writing, the NBN is still being rolled out with only around 25% complete.
This analysis, the ADSL Availability Report (AAR), identifies areas which are currently under-
served and uses the NBN 3 year construction plan to model how these under-served areas
change over time. The aim of this study is to highlight areas where infrastructure supply may not
be meeting consumer demand. It is hoped that this data will be used to encourage the
development of alternative interim services and improve consumer information around the
availability, or lack thereof, of services.
This analysis examines the availability of fixed line ADSL. Telstra HFC and mobile broadband
coverage are not examined in determining if an area is served. Other providers may also serve
areas with their own technology which is not included in this analysis.
3Methodology
The base unit: a neighbourhood
Since the majority of Australia currently access broadband through the Telstra copper network, the
analysis is conducted at a Telstra Distribution Area (DA) level. Typically, a Telstra Distribution
Area represents the group of premises serviced by a common Telstra neighbourhood pillar.
On average, a single pillar services a cluster of around 150 premises. However, this is only an
indicative average. There are instances where Telstra Distribution Areas have several thousand
premises. There are also some smaller, regional exchanges which do not have any distribution
areas.
To help break down some of these areas into a more granular level, some Telstra Distribution
Areas have been split into smaller areas based on the work done by the Department of
Communications (Department of Communications 2013).
For the purposes of this analysis, this base unit is called a “neighbourhood”.
Approximate Premises Count
An approximate number of premises in each neighbourhood was derived by overlaying the
February 2016 release of the PSMA Geocoded National Address File (G-NAF) database (DPMC
2015).
The approximate premises count is omitted from parts of this report, particularly in cases where
including the number will cause confusion. For example, if an exchange has no remaining ADSL
ports, only new connections are affected by this limitation. Premises which are already connected
to ADSL are not affected. It would not be appropriate to describe all premises within that
exchange as under-served.
For the purpose of this analysis, neighbourhoods with less than 5 premises were excluded in this
final report.
DSLAM Location
DSLAM, or Digital Subscriber Line Access Multiplexer, is equipment used to transmit and receive
ADSL/ADSL2+ signals along the copper pairs.
DSLAM equipment is typically located at Telstra exchanges and should be capable of delivering
ADSL/ADSL2+ services to any premises within the exchange area (provided they pass the service
qualification checks).
However, at the time of writing, Telstra also operates DSLAMs at 5,408 CAN sites (Copper Access
Network sites) in the field in addition to the DSLAM equipment housed in 2,962 exchanges around
Australia. These CAN site DSLAMs are installed in cabinets near neighbourhood pillars and can
only service specific neighbourhoods.
Telstra Wholesale publishes a list of Telstra Distribution Areas (neighbourhoods, for the purpose
of this analysis) associated with each CAN site (Telstra 2016a).
4When examining port capacity for each neighbourhood, this analysis takes into account the ADSL
port capacity at the exchange and at any CAN sites which are connected to the neighbourhood.
Under-served Definition
For the purposes of this analysis, an area is considered under-served if any of the following
conditions are met:
the Telstra DA is not connected to an ADSL-enabled exchange or CAN site (Telstra 2016b)
the Telstra DA is connected to an ADSL-enabled exchange or CAN with no or less than 5
ADSL/ADSL2+ ports remaining
the Telstra DA is too far from the exchange to order an ADSL/ADSL2+ service above 4
Mbps. This was calculated by matching the Telstra distribution area data from Pitney
Bowes with the median speed data for each distribution area from the MyBroadband "data
cube" spreadsheet on the Department's website. The 4 Mbps filter was then applied onto it
to exclude areas we considered to be "too far from the exchange".
The minimum 4 Mbps figure was arrived at by considering the Telstra service quality check, the
minimum quality the line must meet for Telstra to offer service to a household, where attenuation
on the line must be less than 56dB (Telstra 2015). On a typical copper line, a line with 56dB loss
can attain a line rate of around 4 Mbps on both ADSL and ADSL2+ (Internode 2007).
Telstra ADSL/ADSL2+ Port Data
The analysis considers the availability of ADSL/ADSL2+ ports in each exchange or CAN site. This
information is published by Telstra and is available on the Telstra Wholesale website. However,
this data only shows the number of ports remaining and does not indicate how many ports in total
are at the exchange or a CAN site.
It should also be noted that port availability data can change over time as customers take-up
services, cancel services or if Telstra increases port capacity.
The analysis uses port data as at 21st June 2016, published 24th June 2016.
The data excludes port availability information on non-Telstra DSLAMs such as those installed by
Optus and TPG in certain exchanges. Although, in regional, rural and remote areas Telstra is
virtually the only provider of DSLAM coverage (ACCC 2015).
NBN three-year construction schedule
This analysis takes into account the effect of the NBN rollout on the under-served classification.
The three-year schedule, found on the NBN Co website, lists indicative suburbs as well as an
estimated start date (nbn 2015b). An approximate network footprint can be derived from this. The
under-served status of each Telstra DA is then calculated for every half-year by including the
estimated start date and assuming an average build time of 12 months rounded to the nearest half
year.
There are limitations to the accuracy of this information. The footprint of the rollout is only
approximate, based on the indicative list of suburbs provided by NBN Co. The footprint is
conformed to broadly align with existing Telstra exchange service areas and is further refined in
outer-metropolitan fringes by considering the land use classification from 2011 ABS Mesh Blocks
(ABS 2011).
5The analysis also assumes the entire Fixed-line service area listed on the three-year construction
plan is completed within 12 months based on the NBN average build time (nbn 2014). However,
NBN Co may separate the rollout into several blocks based on technology.
NBN’s Long Term Satellite (LTS) was also made available consumers in April 2016. Since NBN
has not released a detailed satellite footprint, these neighbourhoods are flagged as partially
served if at least one premises in the neighbourhood is eligible for the satellite service.
Other considerations
Pair gain systems
This analysis does not consider the impact of small/medium pair gain devices in the copper
network since the location of these pair gain systems are not publicly available. Pair gain systems
is a way of carrying (multiplexing) multiple phone lines over a single copper wire. These systems
will ensure that phone services can be delivered to new developments, however, may prevent
ADSL/ADSL2+ broadband services from being delivered.
Larger and more modern pair gain systems with in-built ADSL/ADSL2+ functionality such as a
Remote Integrated Multiplexer (RIM) or a Customer Multiplexer (CMUX) are considered as part of
the CAN site analysis input described in section 1.3 (DSLAM Location).
6Findings
The findings section is broken into three outlook sections:
1. short term (to June 2017),
2. medium term (to December 2018), and
3. long term (to June 2020).
Over time, the number of under-served or partially under-served neighbourhoods is expected to
decline as the rollout of the NBN continues.
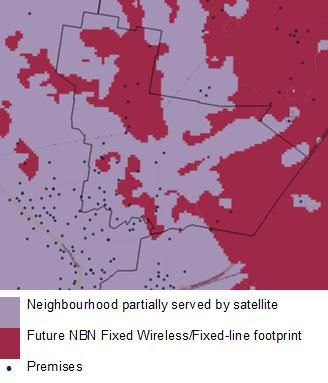
Figure 1: Graph of satellite footprint overlap with exchange areas
Due to the lack of a published NBN satellite footprint, neighbourhoods with at least one premises
eligible for NBN’s long term satellite (LTS) are flagged and accounted separately in the Short
Term.
These partially served areas may contain premises which are ineligible for the LTS service
because they are planned to be in an NBN Fixed Wireless and Fixed-line footprint. Typically,
these are located at the outskirts of towns or suburbs in outer-metropolitan or regional areas. The
map on the right shows an example of this partially served classification.
The neighbourhoods shown are considered partially served by satellite. The red shaded area
indicates the expected future NBN Fixed Wireless or Fixed-line footprint. Premises outside of the
red shaded footprint are currently eligible for the NBN LTS service, whereas premises within the
shaded red area are currently ineligible for an NBN LTS service since they are expected to be
served by another NBN technology in the future.
Over the medium term, the NBN Fixed Wireless network is scheduled for completion (nbn 2015a)
The remaining fixed-line 3 year construction plan is accounted for in the model. As a result, it is
assumed from December 2018 onwards, all premises in neighbourhoods previously classified as
“partially served by satellite” are served by at least one form of NBN access technology or are
considered as part of the construction plan.
7Figure 2: Number of neighbourhoods by reason and time period
Number of under-served neighbourhoods over time
by under-served classification reason
10
Thousands
9
8
7
6
5
4
3
2
1
0
Short Term Medium Term Long Term
(June 2017) (Dec 2018) (June 2020)
Too far from exchange 2,887 1,142 420
No/low ADSL/ADSL2+ ports 1,743 674 207
Exchange not ADSL-enabled 32
Partially served by satellite^ 4,542
^ Some premises within these “Partially served by NBN satellite” neighbourhoods are ineligible for NBN’s satellite service because
they are planned for NBN’s fixed-line or fixed-wireless network in the future.
8Short Term Outlook
The analysis has identified approximately 4,662 neighbourhoods in Australia as under-served at
the end of June 2017 (H1-2017).
An additional 4,542 neighbourhoods are partially serviced by the NBN Long Term Satellite (LTS)
service, as some premises in the area are ineligible for the satellite service and would therefore be
considered under-served.
Within these 4,542 neighbourhoods, there may be premises which are currently ineligible for
NBN’s satellite service as they are planned for NBN’s fixed-line or fixed-wireless network. These
planned premises are unable to obtain either an ADSL or NBN service and are therefore
considered under-served.
Figure 3: Short term findings
Reason for being Total number of Of which partially Of which will be served
considered Under-served neightbourhoods served by NBN by future NBN Fixed-
satellite line or fixed wireless
services
Too far from exchange 4516 1629 2887
Exchange not ADSL 2576 2544 32
enabled
No/Low ADSL/ADSL2+ 2112 369 1743
ports
Total 9204 4542 4662
Too far from exchange
The majority of neighbourhoods are classed as under-served due to their distance from the
exchange. This is particularly prevalent in outer metropolitan and rural areas due to the lower
population density.
While these neighbourhoods await the rollout of the NBN, Telstra continually augments its ADSL
network by servicing neighbourhoods further away from the exchange with DSLAMs at newly
established CAN sites. At the time of writing, Telstra Wholesale has listed 193 proposed CAN
sites serving 287 neighbourhoods in its Proposed ADSL Enabled – CAN spreadsheet (21st June
2016). These are expected to become active between July 2016 and January 2017. Such an
upgrade would see the DSLAM equipment moved closer to the neighbourhood, hence, increasing
the attainable line speed.
No/Low remaining ADSL/ADSL2+ ports
Neighbourhoods which are serviced by exchanges with less than 5 ADSL/ADSL2+ ports
remaining are classified as under-served, however, only those currently without a service who
wish to take one up will be impacted by this shortfall.
The analysis has identified a total of 2,112 neighbourhoods spread out across 169 exchange
areas as having a low number of remaining ports.
Comparing this against Telstra Wholesale’s Planned ADSL Capacity Increases – Exchanges and
Planned ADSL Capacity Increases – CAN spreadsheets (21st June 2016), there are planned port
capacity increases for 149 exchanges and 217 CAN sites between July 2016 and July 2017.While increasing capacity at a particular CAN site does not directly increase port capacity at an
exchange level, it can be expected that customers currently connected to the exchange DSLAM
can be moved to the DSLAM at the CAN site – thus augmenting the number of ports available to
the broader exchange area.
Taking this into account, the scheduled port capacity relief at 149 exchanges and 217 CAN sites is
expected to increase port capacity at 873 of the 2,112 identified neighbourhoods (41%) by June
2017.
A table of exchanges scheduled to be relieved can be found in the table section (4.1) at the end of
the report.
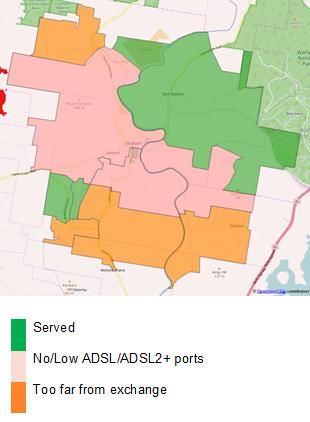
Example: Seaham, NSW
Figure 4: Example map of Seaham, NSW
The Seaham exchange is an example of an outer metropolitan area which affected by both low
port availability and having neighbourhoods too far from the exchange to receive an
ADSL/ADSL2+ service.
Seaham has 0 ports remaining at the exchange. The three central neighbourhoods serviced by
the exchange DSLAMs are considered underserved with no/low ports.
However, the neighbourhood covering East Seaham and the two western neighbourhoods of
Seaham are served by a CAN site with 5 or more ports remaining in each. They are therefore
considered served.
The remaining neighbourhoods in the northern and southern ends of Seaham are considered
underserved as they are too far from the exchange to receive an ADSL service, as explained in
section 1.4.
10Exchange not ADSL enabled
The analysis has found that the majority of neighbourhoods which are not currently ADSL enabled
will now be partially serviced by the NBN Long Term Satellite (LTS). As explained previously,
some premises within these neighbourhoods may be ineligible for the satellite service as they are
planned for a fixed-line or fixed wireless NBN connection. In the short term, this infrastructure
shortfall will likely not be remedied.
Telstra does not intend to expand its ADSL network significantly in the near future. According to
Telstra Wholesale’s Proposed ADSL Exchange Service Areas spreadsheet (20th June 2016), there
are only two exchanges in the forward plan for receiving new ADSL services.
These are in the exchange areas of Haddon and Georgina (Southern Queensland) with expected
completion dates of December 2016 and June 2017 respectively. Both of these exchange areas
also currently appear to be eligible for the NBN LTS service.
Based on current modelling, the remaining 32 neighbourhoods which are not partially serviced by
satellite will likely be serviced by NBN’s fixed wireless network in the future.
11Medium Term Outlook
The analysis has found that the number of neighbourhoods under-served in medium term outlook
falls significantly from 4,662 in H1-2017 to 1,816 at the end of December 2018.
This is due in part to the completion of the NBN Fixed Wireless network at the end of 2018 (nbn
2015a). Given the remaining fixed-line rollout is accounted for in the analysis model, the
neighbourhoods originally considered “Partially served by NBN satellite” in the Short Term Outlook
are now considered served. Likewise, the remaining 32 neighbourhoods considered under-served
due to the exchange not being ADSL enabled from H1-2017 are assumed to be serviced by NBN’s
fixed-wireless network
Figure 5: Medium term findings
Under-served Reason Number of neighbourhoods affected
(H2-2018)
Too far from exchange 1,142
Exchange not ADSL enabled 0
No/Low ADSL/ADSL2+ ports 674
Total (under-served) 1,816
Too far from exchange
The number of neighbourhoods under-served for being too far from the exchange drops from
2,887 in H1-2017 to 1,142 in H2-2018. This is attributable to the extended reach of the National
Broadband Network as the rollout progresses.
No/Low remaining ADSL/ADSL2+ ports
The drop in the number of low remaining ADSL ports is attributed to the ramp up of the NBN
rollout and the planned port capacity increases from Telstra. However, this is based on current
port availability data and does not take into account ADSL take up in the medium term. The actual
figure is dependent on Telstra’s ability to keep up with ADSL demand.
If Telstra remains proactive in increasing port capacity at exchanges, the number of
neighbourhoods affected may be stable or fall over time. If in the contrary, Telstra neglects to
keep up with port demand, the number of neighbourhoods affected will likely increase.
Long Term Outlook
Figure 6: Long term findings
Under-served Reason Number of neighbourhoods affected
(H1-2020)
Too far from exchange 420
12Under-served Reason Number of neighbourhoods affected
(H1-2020)
Exchange not ADSL enabled 0
No/Low ADSL/ADSL2+ ports 207
Total (under-served) 627
By June 2020, the rollout of the National Broadband Network is expected to near its completion.
The analysis finds the number of under-served neighbourhoods will fall from 1,816 in December
2018 to 627 in June 2020.
The remaining areas are in exchange areas where NBN has scheduled rollout completion to be
between June 2020 and December 2020.
Figure 7: Exchanges in NBN rollout in 2020
Exchange Name State
Mount Hawthorn WA
Monash ACT
Crace (Giralang area) ACT
Maylands WA
Morley (Dianella, Noranda) WA
There are also some areas where rollout plans are currently unknown. For example, the town
centre of Vacy (NSW) is currently ineligible for NBN’s Long Term Satellite service and appears to
be a likely candidate for NBN’s Fixed Wireless network. However, it was not listed in the NBN
three-year construction plan.
Due to the limitation of data availability, areas such as Vacy are considered under-served in H1-
2020. However, it is expected that the next release of the NBN three-year construction plan will
include an expected build commencement date throughout Australia.
13Conclusions and observations
ADSL availability
The analysis has identified areas which will remain under-served for an extended duration of time
due to the lack of available fixed line services. Neighbourhoods not currently in the NBN rollout
plan or three-year construction schedule would benefit from alternative network infrastructure
being made available in the medium to long term.
Addressing neighbourhoods too far from the exchange
Telecommunications companies could increase the provisioning of mobile broadband or fixed
wireless technologies in these areas to complement the availability of fixed-line services in the
future.
For example, Vivid Wireless (an Optus subsidiary) is offering “unlimited 4G” plans selected
metropolitan areas using its 2300 MHz LTE network. Technology used by Lightning Broadband
and Uniti Wireless can also deliver fixed-wireless style services through the open Wi-Fi spectrum.
Addressing neighbourhoods with low ports
With the progressive rollout of the National Broadband Network, DSLAM equipment is expected to
be freed as the existing ADSL network is decommissioned in exchange areas where NBN has
been switched on.
Telstra and other service providers could investigate repurposing this decommissioned DSLAM
equipment in neighbourhoods with low port to meet the demands in other areas.
14Reporting of network availability
One of the challenges of this analysis is identifying what network providers and technologies are
available in each area.
Telstra Wholesale ADSL
Telstra Wholesale regularly updates detailed information on its ADSL services to the public on its
website. Amongst many other things, the company publishes a list of ADSL enabled exchanges,
the number of ports at each exchange or CAN site, a list of proposed exchange upgrades and
capacity increases.
However, the analysis has also found that some port capacity increases are not reported in
Telstra’s Planned ADSL Capacity Increases – Exchanges spreadsheet.
For example, exchanges such as Engadine (NSW), Coogee (NSW), Ryde (NSW), Wembley (WA),
Miller (NSW) and Newtown (NSW) all recently saw increases of over 1,000 in port availability
between 10th May 2016 to 21st June 2016. However, none of the exchanges are listed in the
capacity increases spreadsheet.
Figure 8: Telstra Wholesale ADSL capacity increases
Number of free ports Number of free ports Net increase in
State Exchange Name (as at 10th May 2016) (as at 21st June 2016) ADSL/ADSL2+ ports
NSW ENGADINE 1 3,223 3,222
NSW COOGEE 44 2,220 2,176
NSW RYDE 85 2,239 2,154
WA WEMBLEY 4 1,985 1,981
NSW MILLER 231 2,046 1,815
NSW NEWTOWN 175 1,710 1,535
The relieving of port availability in areas especially in Engadine, Coogee, Ryde and Wembley
indicates that Telstra is still committed to addressing ADSL/ADSL2+ port shortages in areas where
NBN is not expected to rollout in the near future.
15Other ADSL providers
Public visibility of other ADSL providers with own DSLAM equipment in exchanges including
Optus, TPG Group and M2 Group could be improved.
ADSL2Exchanges.com.au does provide a crowdsourced list of providers, however, the information
does not appear to be updated frequently.
Consumers would benefit from knowing which network providers have a presence in each
exchange and whether there are ports are remaining. This could be published in spreadsheet
format similar to that of Telstra Wholesale.
Noting that there may be commercial sensitivities, having a centralised search tool for consumers
to determine which providers have excess ADSL services capacity with timely updates would
assist consumers in choosing broadband providers and plans. This could come as a form of a
third-party data aggregator, provided that other ADSL providers will publicly publish this availability
information.
However, the need for such a tool is expected to diminish over the next 4-5 years as the NBN is
expected to supersede the ADSL network by the end of 2020.
National Broadband Network
nbn publishes information about its current network footprint and areas that are currently under
construction on its interactive rollout map. It also publishes a list of indicative suburbs or localities
covered under its three-year construction schedule.
While all of the NBN access technologies are considered served as part of this analysis, the
variability in “up to” speeds being delivered over Fibre to the Node, Fibre to the Basement and
Fixed Wireless access technologies means that consumers will benefit from getting a speed
estimate on its interactive rollout map.
This will allow consumers to make more informed decisions when deciding on an internet plan and
may also assist consumers to make better rental or property purchase decisions based on
broadband availability.
Consumers who live in areas where NBN construction is underway would also benefit from
knowing an estimated rollout completion date for their area.
Other networks
Visibility of the availability of other infrastructure providers independent of Telstra’s copper network
is poor. This makes it difficult for consumers to make rental or property purchase decisions based
on broadband availability.
For example, it is difficult to ascertain which buildings are in the network footprint of TPG’s Fibre to
the Basement network without performing a service qualification for each building on TPG’s
website.
Similarly, information on the footprint of Telstra and Optus’ HFC networks is severely limited.
However, as the NBN subsumes most of these networks as the HFC rollout progresses, the
problem will be alleviated.
16Appendix
Appendix A: Tables
Short Term Outlook: Port shortage
Planned port capacity increases – exchange level
The following table lists the exchanges with neighbourhoods identified to be in shortage of
ADSL/ADSL2+ ports and are planned for exchange-level port capacity increases (Telstra 2016c).
Figure 9: Low port exchanges with planned increases
Exchange Name State Planned upgrade date
ALBANY WA Sep 2016
BIRREGURRA VIC Sep 2016
COLLARENEBRI NSW Sep 2016
DEEPWATER NSW Oct 2016
ECHUCA VIC Oct 2016
FORRESTDALE WA Oct 2016
HENLEY BEACH SA Sep 2016
HAZELBROOK NSW Jan 2017
JUNDAH QLD Sep 2016
KANIVA VIC Oct 2016
KEPPEL SANDS QLD Nov 2016
KULIN WA Nov 2016
LETHBRIDGE VIC Oct 2016
LAKE CATHIE NSW Oct 2016
MUNDIJONG WA Oct 2016
MOUNT WILSON NSW Aug 2016
MOUNT WHITE NSW Dec 2016
PAYNESVILLE VIC Oct 2016
PERTH TAS Oct 2016
RICHMOND VIC Dec 2016
ROSEBUD VIC Sep 2016
SPRINGWOOD NSW Oct 2016
TWEED HEADS NSW Oct 2016
TRUNDLE NSW Nov 2016
TRENTHAM VIC Sep 2016
Planned port capacity increases – CAN site level
The following table lists the exchanges with neighbourhoods identified to be in shortage of
ADSL/ADSL2+ ports and are planned for CAN site-level port capacity increases.
This is expected to increase the number of ports available at the exchange as customers are
migrated to the DSLAM at the CAN site (Telstra 2016d).
17Figure 10: Low port exchanges with planned CAN increases
Exchange Name State Planned upgrade date
BEECHBORO WA Oct 2016
BANORA POINT NSW Sep 2016
CESSNOCK NSW Dec 2016
HEIDELBERG VIC Sep 2016
HENLEY BEACH SA Oct 2016
INGLESIDE QLD Dec 2016
LAKE CATHIE NSW Dec 2016
LOWOOD QLD Oct 2016
LITTLE GROVE WA Dec 2016
MUNDIJONG WA Aug 2016
ROSEBUD VIC Nov 2016
TAMBORINE MOUNTAIN QLD Sep 2016
18Appendix B: Datasets used
Figure 11: Data sets used in Analysis
Dataset Last updated by dataset provider
ExchangeInfo dataset Feb 2016
Geocoded National Address File (G-NAF) Feb 2016
Telstra Wholesale ADSL Reports June 2016
ADSL Enabled ESA's
Available ADSL Capacity – Exchanges
Available ADSL Capacity – CAN
Proposed ADSL Enabled Exchanges
Planned ADSL Capacity Increases - CAN
Planned ADSL Capacity Increases - Exchanges
MyBroadband Analysis December 2013
NBN 3 year construction plan October 2015
NBN rollout plan (in build / active) June 2016
ABS 2011 Mesh Blocks July 2011
19References
Australian Bureau of Statistics (2011) Australian Statistical Geography Standard. ‘ABS Mesh
Blocks’, ABS Mesh Blocks.
ACCC (2015) ‘ACCC telecommunications reports 2013-14’, p.21
Department of Communications and Arts(2013) Mybroadband data set.
Department of Prime Minister and Cabinet (2015) ‘PSMA Geocoded National Address File (G-
NAF)’, GNAF data.
Internode (2007) ‘Easy Broadband ADSL2+.
nbn co ltd (2015a) ‘nbn Corporate Plan 2016’, p16
nbn co ltd (2015b) ‘Three-year construction plan’.
Nbn co ltd (2014) New technology speeds up NBN rollout media release.
Telstra Wholesale (2015) ‘Service qualification’.
Telstra Wholesale (2016a) ‘Available ADSL Capacity – CAN’.
Telstra Wholesale (2016b) ‘ADSL Enabled ESA's’, available at:
Telstra Wholesale (2016c) ‘Planned ADSL Capacity Increases – Exchanges (21st June 2016)’
Telstra Wholesale (2016d) ‘Planned ADSL Capacity Increases – CAN (21st June 2016)’
Telecommunications Industry Ombudsman (2015) Submission to the 2015 Regional
Telecommunications Review, TIO submission.
20You can also read