Burn Area Detection Using Landsat 8 OLI TIRS - IOPscience
←
→
Page content transcription
If your browser does not render page correctly, please read the page content below
IOP Conference Series: Earth and Environmental Science

PAPER • OPEN ACCESS

Burn Area Detection Using Landsat 8 OLI TIRS
To cite this article: Satria Indratmoko and Nurrokhmah Rizqihandari 2019 IOP Conf. Ser.: Earth Environ. Sci. 338 012035

View the article online for updates and enhancements.

                               This content was downloaded from IP address 176.9.8.24 on 16/05/2020 at 17:26
Southeast Asian Geography Association (SEAGA) 13th Conference                                                  IOP Publishing
  IOP Conf. Series: Earth and Environmental Science 338 (2019) 012035                        doi:10.1088/1755-1315/338/1/012035

Burn Area Detection Using Landsat 8 OLI TIRS
                  Satria Indratmoko and Nurrokhmah Rizqihandari
                  Departement of Geography, Faculty of Mathematic and Natural Science Universitas Indonesia
                  Depok, Indonesia

                  Email: satria.indratmoko@ui.ac.id; rizqihandari@gmail.com

                   ABSTRACT- Fires associated with land use conversion activities such as agricultural expansion, palm
                   and pulp plantations, peat land alteration, and industrial deforestation are significant in Indonesia (Jerrod
                   & Alex, 2015). Fires season in 2015 is one of the worst incident in Indonesia since 1997, it made
                   Indonesia at the second position as an emitter country, at least 22 days in September 2015, and generated
                   more than the daily average emission of U.S. economic activity. A study from the National Developmen
                   Planning Agency (Bappenas) and Asian Development Bank (ADB) estimated that the amount of land
                   affected by fires reaches 9.75 million hectares. It caused losses reached US$.4.861 or equivalent to
                   IDR711 trillion or even more based on disruption of economic activities, transportation problems, and
                                                                                                                               t
                   health problems. Head of Data Information and Public Relations of National Disaster Managemen
                   Agency (BNPB), Sutopo Purwo Nugroho, said the economic impact of smog disasters occurring in
                   several provinces in Indonesia in 2015 could exceed 20 trillion per province. The most widespread forest
                   fire area occurred in South Sumatra Province. BNPB released that during 2015 in South Sumatera
                                                                                                                               t
                   Province has 35.008 hotspots and the burnt area is 641.964 Ha. The most affected area is in Ogan
                   Komering Ilir Regency. Landsat 8 OLI TIRS has a 30-meter spatial resolution for each band except TIRS
                   band and panchromatic band (USGS, 2016). TIRS band has a 100-meter spatial resolution but are
                   resampled to 30-meter that can be used to identify burned scars area. By using SWIR bands (TM bands
                   5 and 7 in Landsat 5 and 7 systems) as a NBR (Normalized burn ratio) composite, can be used to detecting
                   and mapping burnt area. TIRS algorithm which was used to detect fire will be seen red and SWIR which
                   was used to detect water stress in vegetation and burned vegetation will be seen green, both of them will
                   become darker when burn happened. This method modifying dNBR (pre-NBR – post-NBR) composite,
                   which only can be used in oil palm plantations area that has same commodities, so can be used in various
                   type of landuse especially the area that has plantation adjoin with forest area.

1. Introduction
Fires associated with land use conversion activities such as agricultural expansion, palm and pulp
plantations, peat land alteration, and industrial deforestation are significant in the country of Indonesia [1].
Fires season in 2015 is one of the worst happened in Indonesia since 1997, it made Indonesia at the second
position as an emitter country, at least 22 days in September 2015, and generated more than the daily average
emission from U.S. economic activity. A study from the National Development Planning Agency
(Bappenas) and Asian Development Bank (ADB) estimated that the amount of land affected by fires reached
9.75 million hectares. It caused losses reached US$.4.861 or equivalent to Rp.711 trillion or even more based
on disruption of economic activities, transportation problems, and health problems [2]. Head of Data
Information and Public Relations of National Disaster Management Agency (BNPB), Sutopo Purwo
Nugroho, said the economic impact of smog disasters occurring in several provinces in Indonesia in 2015
could exceed 20 trillion per province.
         The most widespread forest fire area occurred in South Sumatra Province. BNPB released that
during 2015 in South Sumatera Province has 35.008 hotspots and the burnt area is 641.964 Ha. The most
affected area is in Ogan Komering Ilir Regency. BNPB also reported that almost 99% forest fire occurred

                Content from this work may be used under the terms of the Creative Commons Attribution 3.0 licence. Any further distribution
                of this work must maintain attribution to the author(s) and the title of the work, journal citation and DOI.
  Published under licence by IOP Publishing Ltd                          1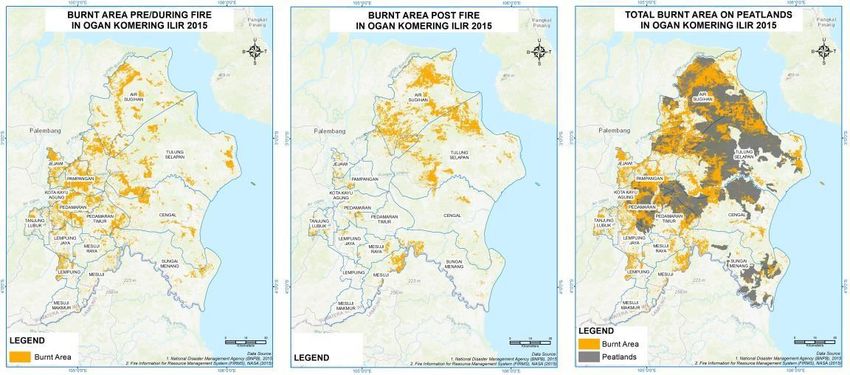
Southeast Asian Geography Association (SEAGA) 13th Conference IOP Publishing
IOP Conf. Series: Earth and Environmental Science 338 (2019) 012035 doi:10.1088/1755-1315/338/1/012035
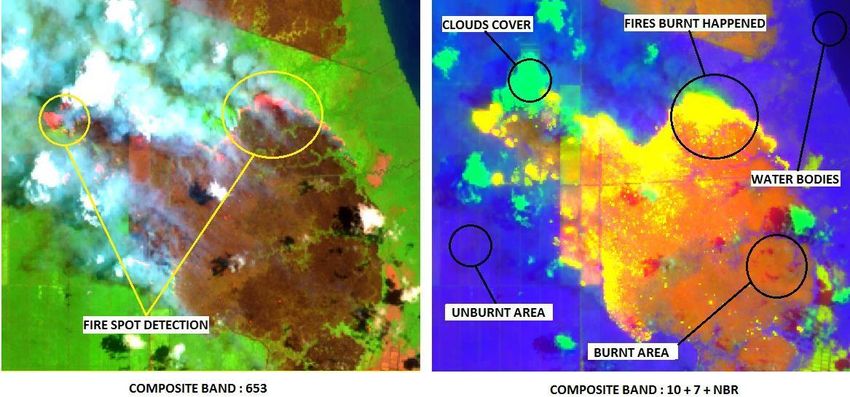
due to deliberately burned by human [3]. The dry weather conditions and the characteristics of the peat soil
areas add to the severity of the affected areas [4].
Figure 1. Hotspots & Peatlands Distribution in South Sumatera 2015
The extent of the impact of the fires, made public have right to get the accurate location of the prone
area, so public can make a mechanism to cope with disaster and manage the community to prevent the bigger
impact. Unfortunately, public in Indonesia doesn’t have any access into the update burned scars map,
especially in vector format. Whereas, the update data is a crucial part to deciding the thread’s exact respond.
A company can monitor the restoration of burned areas, control land use conversion, and decide special
treatment, and design a contingency plan in their concession areas. Government can design an efficient
disaster management program. And the most important, public can monitoring the entire activities and
incidents in the prone area.
Landsat 8 OLI TIRS has a 30-meter spatial resolution for each band except TIRS band and
panchromatic band [5]. TIRS band has a 100-meter spatial resolution but are resampled to 30-meter that can
be used to identify burned scars area. There are 9 Landsat scenes covering in South Sumatera Province, those
4 scaenes are overlapping with Fire Hotspot Data 2015 in Ogan Komering Ilir Regency. By using image
processing software, with composite bands analysis and Normalized Burn Ratio (NBR) methods, raster
format of burned composite can be construct as portray as burned area in Indonesia. With GIS software those
raster data can be convert into vector format that can be displayed in WebGIS platform as an open data e.g.
in Green Peace Indonesia WebGIS or another institutions either Government Organization or Non-
Government Organization which have webGIS platform. Along with various maps from The Ministry of
Environment and Forestry that shown in Greenpeace Indonesia WebGIS, some analysis can be made to help
forest monitoring, such as selective logging activities (HPH), pulp & paper activities (HTI), palm oil
companies, coal mining companies activities in their concession. Especially, to support Zero Deforestation
in Indonesia.
1.1 The Study Area
One of the largest peat swamp areas in Sumatra is in South Sumatera Province which has covering
area approximately 1.42 million hectares. A total of 54.12% of the area is located in Ogan Komering Ilir
Regency [6]. Figure 2 showed that mostly the hotspot are above peatlands.
2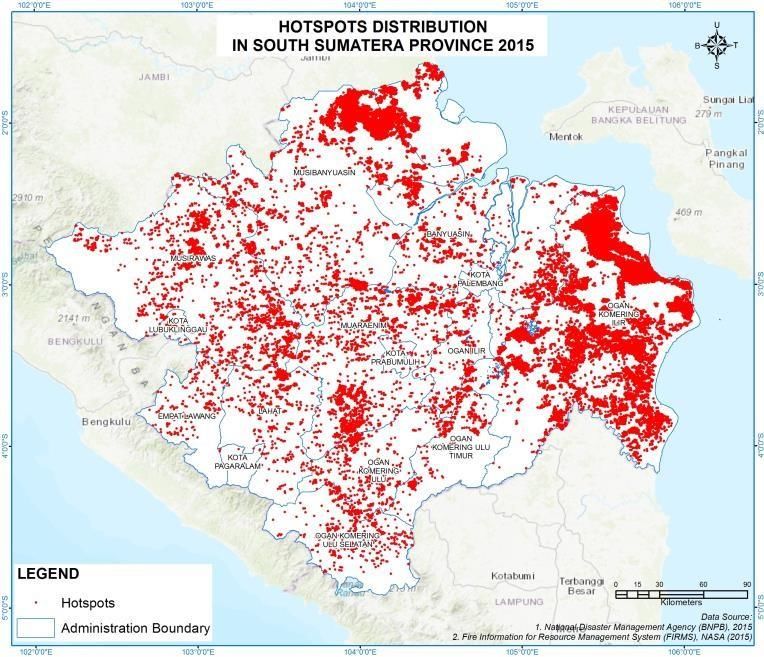
Southeast Asian Geography Association (SEAGA) 13th Conference                              IOP Publishing
  IOP Conf. Series: Earth and Environmental Science 338 (2019) 012035    doi:10.1088/1755-1315/338/1/012035

                Figure 2. Hotspots & Peatlands Distribution in South Sumatera 2015

This regency has a population of 798.482 people [7] who is the second largest population in South Sumatera
Province. More than 95 of this regency is lowland area and bypassed two major rivers namely Musi River
and Mesuji River.

2. Methodology
In the past studies, mapping of detecting burn scars was done by using MODIS Imagery [8]. The empirical
technique for remote sensing of burn scars using a single dataset of MODIS NIR channels centered near
1.24 and 2.13 μm. These channels are sensitive to changes in the surface properties induced by the fire and
are not obscured by smoke. Therefore, they allow remote sensing of burn scars in the presence of smoke. The
problem is MODIS has a low spatial resolution (250 - 1000 m). It cannot detect the small area of forest,
plantation and peatland fires and only detect the big area of burned scar. ArcGIS 10.4.1 were used to process
image satellite and vector data to produce burnt scars area.
         Therefore, this research was begin with collecting data Landsat 8 OLI (Operational Land Imager)
TIRS (Thermal Infrared Sensor) imagery which has better spatial resolution than MODIS (30m vs 250m).
However, MODIS has a better temporal resolution compared to Landsat TM (daily vs 16 day repeat cycle).
Landsat 8 OLI TIRS is not acceptable for monitoring, however, with the spatial resolution makes it a very
good data set to detect and analyze the damage after the fire. Further, the data were processed to assess burn
scars by composite band analysis and Normalized Burn Ratio (NBR) method.

2.1 Data Collection
In achieving the goal of this research, secondary data are used in assessing the burn scar. Secondary data
was needed in this research are Landsat 8 OLI TIRS form United States Geological Survey (USGS) USA,
hotspots from Fire Information for Resource Management System (FIRMS) National Aeronautics and Space
Administration (NASA) USA, Peatlands map from Ministry of Agriculture Indonesia and basic spatial data
from Geospatial Information Agency (BIG).
       According to ASEAN Specialized Meteorological Center about transboundary haze in Sumatera and
Kalimantan showed fire start reported in May in Sumatera and in July in Kalimantan. Both areas are high in
August and September, and start declined in October. Fluctuated data shown on Global Forest Watch Fires
report. Fires start raised in May 2015 slowed down in September 2015, but grew back in October and
November, then started to diming in December 2015.
        From those data, this research took two periods of data collection, which are pre fire/during fire data
in March – May 2015 and post fire in November 2015 – January 2016.
                                                        3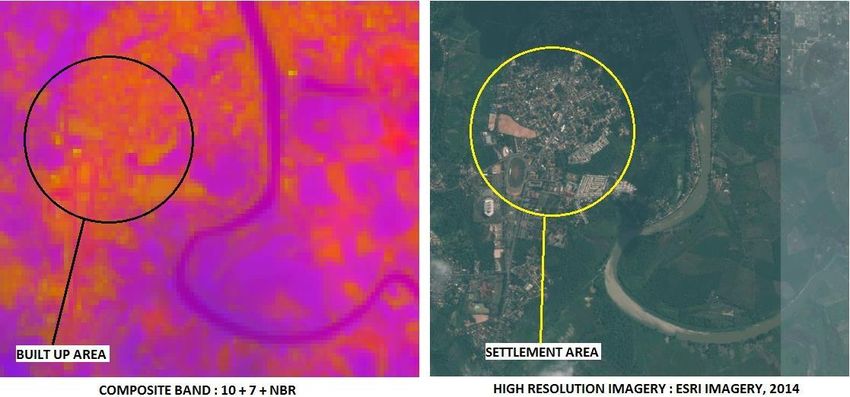
Southeast Asian Geography Association (SEAGA) 13th Conference IOP Publishing
IOP Conf. Series: Earth and Environmental Science 338 (2019) 012035 doi:10.1088/1755-1315/338/1/012035
Figure 3. Total Hotspots in Sumatera and Kalimantan 2015
Source: http://asmc.asean.org/asmc-haze-hotspot-monthly#Hotspot
2.2 Identified Burnt Scars Using Band Composite
The Shortwave Infrared (SWIR) bands (TM bands 5 and 7 in Landsat 5 and 7 systems) are very
useful for detecting and mapping burnt areas because it can penetrate heavy smoke and the areas with active
flames happened. Combining Landsat-8 TIRS (brightness temp) and Landsat-8 OLI can detect fire burnt
area.
To create NBR (Normalize Burn Ratio) that highlighted burnt area, we were using this formula: [9]
NBR = ((NIR-SWIR))/((NIR+SWIR))
When:
NIR (Near Infra-Red) as a Band 5
SWIR (Short Wave Infra-Red) as a Band 7
The Operational Land Imager (OLI) and Thermal Infrared Sensor (TIRS) are instruments onboard
the Landsat 8 satellite. Those two instrument can be combine to identify burnt area. OLI instrument can
Emphasized burnt area by compositing false- color (red-green-blue) band algorithms. TIRS (Thermal Infra-
Red Sensor) for Band 10 to replace red composite, SWIR (Short Wave Infra-red) for Band 7 to replace green
composite, and NBR (Normalized Burn Ratio) to replace blue composite. TIRS which was used to detect
fire will be seen red and SWIR which was used to detect water stress in vegetation and burned vegetation will
be seen green, both of them will become darker when burn happened. Otherwise, NBR which was used to
detecting vegetation index will be seen lighter when it’s burned. The combination will show dark
yellow/orange when fire happened.
Below is a workflow diagram of processing data that can be followed to identifying burn scars.
4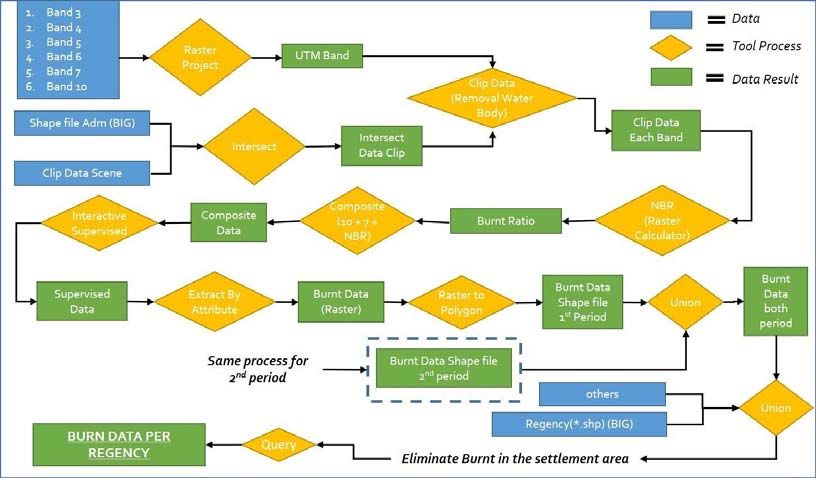
Southeast Asian Geography Association (SEAGA) 13th Conference                                 IOP Publishing
  IOP Conf. Series: Earth and Environmental Science 338 (2019) 012035       doi:10.1088/1755-1315/338/1/012035

                          Figure 4. Work flow burnt scars area identification

2.3 Supervised Classification
In this type of classification the image analyst "supervises" the pixel categorization process by specifying,
to the computer algorithm, numerical descriptors of the various land cover types present in a scene. To do
this, representative sample sites of known cover type, called training areas, are used to compile a numerical
"interpretation key" that describes the spectral attributes for each feature type of interest [10]. Further, all of
these pixels are not as samples will grouped based on the characteristic of pixel value by applying statistical
calculations.
         Training samples area were taken from the pan sharpened or composite image of the Landsat 8 data
which clearly from cloud. It were created for three classes (burnt, unburnt, and water bodies/cloud). A
maximum likelihood classification algorithm was used to classify the image. Maximum likelihood is one of
the most common classifiers used in remote sensing studies and assumes that the spectral values of training
pixels are normally distributed [11]. The maximum likelihood classification tool considers both the
variances and covariances of the class signatures when assigning each cell to one of the classes represented
in the signature file [12]. Each defined pixel will be grouped based on pixel values that have already been
retrieved by applying statistical calculations [13].
         There are some problem related with Landsat 8 data in 2015:

            Figure 5. USGS’s Notification about Thermal Infrared Sensor that was broken

                                                          5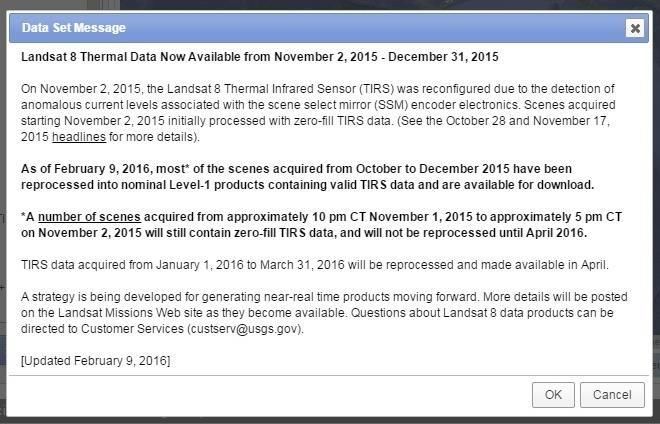
Southeast Asian Geography Association (SEAGA) 13th Conference IOP Publishing
IOP Conf. Series: Earth and Environmental Science 338 (2019) 012035 doi:10.1088/1755-1315/338/1/012035
Default projection each bands is UTM Northern Hemisphere, so if the area (path row) is in the southern
equator, must be re-projected;
TIRS data (Band 10 & 11) for the period of December-March was broken. Re- uploaded again by
USGS on the Early February sequentially;
Thick-cloud contamination is a common problem in Landsat images especially in Tropical Country,
which limits their utilities in various land surface studies cross check with forest fire report are needed
3. Result and Discussion
3.1 Normalized Burn Ratio (NBR)
Based on analysis using the NBR algorithm, showed that the burnt area has a lower NBR value than the
unburnt area. This indicates that burnt area has a lower humidity level than unburnt area. It can be good
represented through NBR value using SWIR band which very sensitive to capture water condition of the
plants [14].
Figure 6. NBR value in the burnt area and unburnt area
3.2 Burn Composite & Fire Spots Detection
Based on image data processing using 10 + 7 + NBR composite, it is found that this composite can
clearly give a good visualization of burnt area or fire spot detection. Figure 7 shows a comparison of images
between burnt area, unburnt area, and on fire area. Land that is on the fire burnt will appear in the image as
a bright yellow color, however, the burnt land will show dark yellow closest to orange color. In composite
band 653 will be clear the difference of those.
Figure 7. Composite bands for fires burnt area detection
However, in built up area will show a similar color with the burned area because this area has a high
radiation value of heat (Figure 8). Built up area consists of roof,
6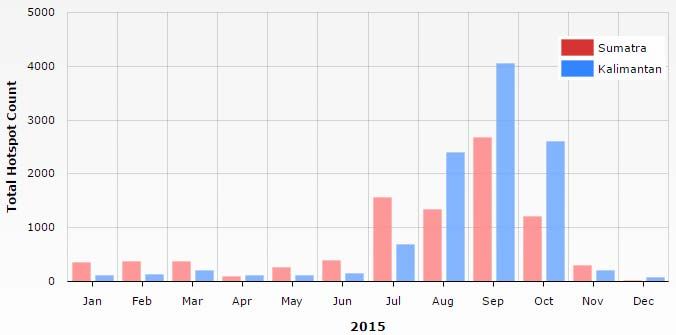
Southeast Asian Geography Association (SEAGA) 13th Conference                             IOP Publishing
  IOP Conf. Series: Earth and Environmental Science 338 (2019) 012035   doi:10.1088/1755-1315/338/1/012035

highways, parking lots and sidewalks. This condition dramatically altered the radiation, thermal convective,
moisture, as well as emissions properties of the surface, leading to higher atmospheric and surface
temperature in urban areas than in surrounding rural areas [15]. This condition will be captured by Thermal
Infrared Sensor (TIRS) on Landsat 8. Therefore, this condition need to combine with landuse data to
eliminate errors during interpretation

                       Figure 8. Similar color of burnt area in built up area

3.3 Burn Area Extraction
        Data extraction using supervised classification method needs to create some training samples area
(Region of Interest) in imagery which furthermore all of samples will grouped based on the characteristic of
pixel value by applying statistical calculations. Training samples area were taken from composite band
image (band 10, band 7, and NBR). Figure 9 shows that total burnt area in Ogan Komering Ilir Regency is
397.087,43 Ha which the burnt area on peatlands is 50,65% area occurred in peatlands area.
                       Table 1. Total burnt area on peatlands & non-peatlands

                                                       7
Southeast Asian Geography Association (SEAGA) 13th Conference IOP Publishing
IOP Conf. Series: Earth and Environmental Science 338 (2019) 012035 doi:10.1088/1755-1315/338/1/012035
Figure 9. Burnt area pre/during, post fire & total fire in Ogan Komering Ilir Regency 2015
4. Conclusion
Band combination of RGB (TIRS, SWIR, NBR) can be used to detect fire burnt area with the good
visualization image. (easy to distinguish burnt & unburnt area)
Landsat resolution is 30 x 30 m can detect the small area forest, plantation & peatland fires.
In the areas are dominated urban (built up area), Band combination of RGB (TIRS, SWIR, NBR)
sometimes the colour same with burnt area, need to combine with land use data.
NBR composite can be used to detect burned area especially on oil palm plantations, because it suits
for burned oil palm plantations (vegetation), but it will hard to be applied for burned open land/soil.
5. References
[1] Jerrod L and Alex S 2015 Mapping Burn Scars In Indonesia. (Palisades, New York.) Retrieved from
https://earthzine.org/2015/07/30/finding-your-inner-hue-mapping-burn- scars-in-indonesia/
[2] Tacconi L 2003 Fires in Indonesia: causes, costs and policy implications. (Centre for International
Forestry Research (CIFOR) - CIFOR Infobrief: Bogor)
[3] Nugroho S P and Yanuarto T 2016 Menjaga Asa Bebas Asap Penanganan Bencana Kebakaran Hutan
dan Lahan. (Suprapto, Ed.) (Pertama). (Jakarta: Information Data Center, National Disaster
Management Agency (BNPB))
[4] Tarigan M L, Nugroho D, Firman B and Kunarso A 2015 Laporan dan Modul Teknis Pemutakhiran Peta
Rawan Kebakaran Hutan dan Lahan di Provinsi Sumatera Selatan Tahun 2015. (South Sumatera)
[5] USGS 2016 Landsat 8 (L8) Data Users Handbook. America (Vol. 8).
https://doi.org/http://www.webcitation.org/6mu9r7riR
[6] Bastoni A S and A E Waluyo 2005 Tipe Vegetasi Lahan Hutan Sumatera Selatan. Palembang. (Palembang:
Balitbang Taman Palembang.)
[7] BPS 2017 Ogan Komering Ilir Regency in Figures 2017 (Ogan Komering Ilir: CV. Mustika Karya)
[8] Li R R, Kaufman Y J, Hao W M, Salmon J M, and Gao B C 2004 A technique for detecting burn scars
using MODIS data. IEEE Transactions on Geoscience and Remote Sensing 42 1300–1308
[9] USGS 2017 Product guide: Landsat Surface Reflectance-DerivedSpectral Indices.
https://doi.org/10.1016/0042-207X(74)93024-3
[10] Lillesand T M, Kiefer R W and Chipman J W 1989 Remote Sensing and Image Interpretation Journal
of Chemical Information and Modeling 53 USA: John Wiley & Sons.
[11] ESRI 2010 How Maximum Likelihood Classification works. Retrieved October 4, 2017, from
http://desktop.arcgis.com/en/arcmap/10.3/tools/spatial-analyst-toolbox/how- maximum-likelihood-
classification-works.htm
[12] ESRI 2010 How Maximum Likelihood Classification works. Retrieved October 4, 2017, from
http://desktop.arcgis.com/en/arcmap/10.3/tools/spatial-analyst-toolbox/how- maximum-likelihood-
classification-works.htm
8Southeast Asian Geography Association (SEAGA) 13th Conference IOP Publishing
IOP Conf. Series: Earth and Environmental Science 338 (2019) 012035 doi:10.1088/1755-1315/338/1/012035
[13] Ardiansyah 2015 Pengolahan Citra Penginderaan Jauh Menggunakan ENVI 5.1 dan ENVI LIDAR
Teori dan Praktek. (South Jakarta: PT. Labsig Inderaja Islim)
[14] Zubaidah A, Vetrita Y, Yulianto F, Ds K A and Rokhis M 2012 Kapasitas Indeks Lahan Terbakar
Normalized Burn Ratio ( Nbr ) dan Normalized Difference Vegetation Index ( Ndvi ) dalam
Mengidentifikasi Bekas Lahan Terbakar Berdasarkan Data SPOT-4. Jurnal Ilmiah Geomatika, 18, 29–
41.
[15] Sun C, Wu Z, Lv Z and Cheng J 2010 Analysis of urbanization effect on land surface temperature, using
sub-pixel technology. 2nd International Conference on Information Engineering and Computer
Science - Proceedings, ICIECS 2010, 1–4.
9You can also read