Google analytics TO mastering - YOUR COMPLETE guide - Umami Marketing
←
→
Page content transcription
If your browser does not render page correctly, please read the page content below

YOUR COMPLETE   guide
TO mastering
  google analytics

What is Google Analytics?											3
Your Step-by-Step Guide to Set-up your Analytics Account					   5
  Creating an Account											6
  Installing the Tracking Code										7
  Setting up Filters, Goals & Linked Accounts							            9
  Setting up and Using Dashboards									13
How to Read and Understand Your Analytics							                17
  Acquisition													18
  Engagement													19
  Outcome													21
Google Analytics vs. HubSpot: How to Leverage both Tools					   22
Summary														28
Learn More													29

3

                 01

     WHAT IS
u    GOOGLE
    ANALYTICS?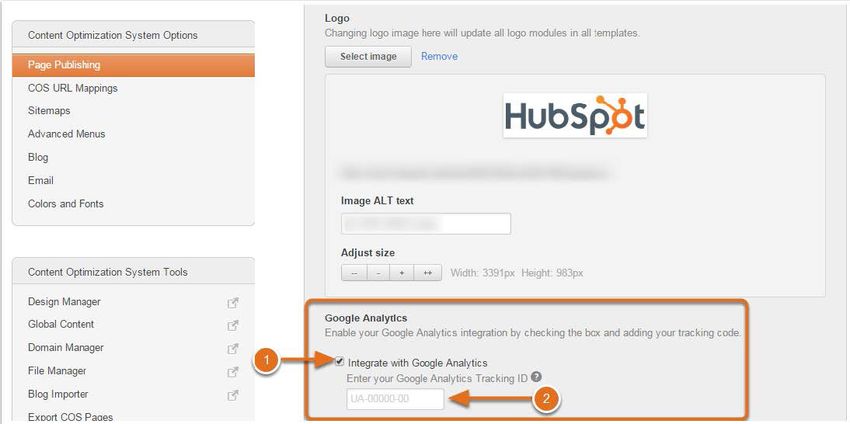
4

Google Analytics is a free tool offered by Google that allows you to track all of your website traffic and data,
and provides detailed statistics on any visitors to your site.

                                                                  Have you experienced a sudden slowdown in
                                                                  website conversions? Perhaps leads through
                                                                  website form submissions all of a sudden
                                                                  grind to a halt? Access to your website
                                                                  analytics can help you understand these
                                                                  issues, and more. You start by installing a
                                                                  small snippet of code on your website, which
                                                                  will then activate the analytics on your site
                                                                  and send it back to your Google Analytics
                                                                  account for further analysis and review.

It's a very powerful resource that gives you insight into how visitors find and use your site, and how to keep
them coming back. Google Analytics will also help you make decisions about the design and layout of your
website, content and service offerings.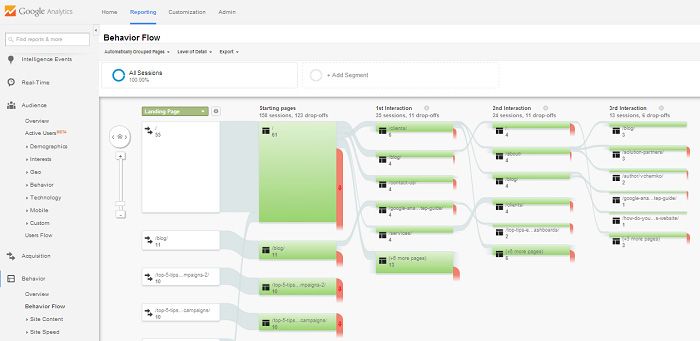
5

                      02
    SO HOW DO YOU
     GET STARTED?
S       CHECK OUT OUR
    STEP-BY-STEP GUIDE TO
    SET-UP YOUR ANALYTICS
           ACCOUNT
6

//01. Creating an Account

Head on over to Google Analytics and set up a new
account by clicking Create an Account (or register
by signing in with an existing Google account). Once
registered or signed in, you'll get to the setup page.
Here are some tips to setting it up:

yy Account Name: This is just to help you keep track
   of your analytics accounts if you register more than
   one under your master account.

yy Website Name: Again, this is just to help you
   differentiate between multiple accounts; you can
   just use your website URL.

yy Website URL, Industry Category, and
   Reporting Time Zone are pretty self-explanatory.

yy Data Sharing Settings: this is completely optional;
   select the options that make sense for you.

Once you've entered all relevant information, click "Get Tracking ID" and agree to the terms of service. Now
we can work on installing the tracking code.
7

//02. Installing the Tracking Code

Installing code?! You?! Don’t worry - this step is actually quite easy.

If you’re using Wordpress
to manage your website,
you’ll just need to install
the Google Analytics for
Wordpress Plugin. Once
installed, go to Settings
and enter the “UA” code.
Make sure you enter your
unique number exactly as
it appears in your Tracking
ID page, and save the
entry.

Even if you aren’t using
Wordpress, the process
is still quite simple; just
follow these easy steps
provided by Google:
8
1.   Find your tracking code snippet. It’s in a box with several lines
     of JavaScript in it. Everything in this box is your tracking code
     snippet. It starts with  and ends with .

2.   The tracking code contains a unique ID that corresponds to
     each Google Analytics property. Don’t mix up tracking code
     snippets from different properties, and don’t reuse the same                             User Privileges
     tracking code snippet on multiple domains.
                                                                              If you have multiple people who
3.   Copy the snippet.                                                    need to be accessing your business'
                                                                                 Google Analytics account with
4.   Don’t edit your snippet. Just copy it. You might want to paste it
                                                                               admin privileges, you can easily
     into a text document if you’re worried about accidentally losing
                                                                            set that up as well. Simply click on
     or changing the snippet from your clipboard.
                                                                             the "Admin" button at the top of
5.   Paste your snippet (unaltered, in it’s entirety) into every web          your Analytics account, and click
     page you want to track. Paste it immediately before the closing          on the "User Management" link.
      tag.                                                                Add permissions for your new
                                                                                 user, filling out the new users'
6.   If you use templates to dynamically generate pages for your               email address, and selecting all
     site (like if you use PHP, ASP, or a similar technology), you can     roles to make them administrator.
     paste the tracking code snippet into its own file, then include it       You can choose to give this user
     in your page header.                                                  admin access to all or some of the
                                                                            profiles set up under your master
Whichever method you use, make sure you check it afterwards to                   account; once they receive the
ensure it was saved correctly. You can verify your setup here, and        email verification with access to the
your website data will begin tracking to your new Google Analytics               profile(s), they are good to go!
site within the next 24 hours.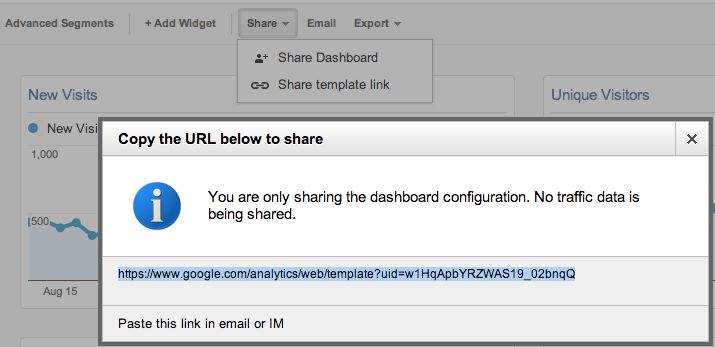
9

//03. Setting up Filters, Goals &
Linked Accounts
Now that you have your account set up and your Tracking Code installed, it’s time to start playing around
with the features of Google Analytics to make sure you are always viewing the most relevant and useful
information.

Filters

**Before we begin, a very important piece of information to note: once done, filtered information from
a Google Analytics profile cannot be undone. So it’s extremely valuable to have a master profile that
contains all raw data so that you don’t permanently lose any data that is being excluded by a profile
filter***

Filters can be used to remove certain data so it isn’t displayed in one or more of your Analytics profiles. Why
is this useful? Here’s one example: you could have multiple employees in your office accessing your website
numerous times throughout the day. If you filtered your data to exclude all traffic coming from your offices’ IP
address, then your true website traffic number won’t be polluted with this internal access.

          Quick Tip: If you’re unsure of how to find your company’s IP address: head on over to
          whatsmyip.org. You can then enter this data directly into your filter to exclude your office network
          from your results.)
10
1. You can sort your data using nearly any filter you can think of. Click on Admin and select the
Profile you'd like to add the filter to, and click on Filters.
2. From there, click + New Filter, and then Create New Filter. You can either select a Predefined
Filter or a Custom Filter, and then select which views you want that filter to apply to.
3. Save your choices and re-run your new filtered data, comparing it to your original raw master
profile (see the "very important" note above) to make sure your filter is working the way that you
want it to.
You can add multiple filters to one
profile (ie: filter by IP address, and
then by Visitor Campaign) and they
will be filtered in the order in which
you set them up. If you ever wanted
to change this order, you would click
Assign Filter Order and then Move
Up or Move Down to move your
filters to how you want them.
If you want to add or remove an
additional filter from a profile,
you just need to go into the Apply
Existing Filter section and add or
remove as you wish. Make sure you
click Save to keep your selections.11 Goals & Conversions Goals allow you to measure the true results of your online marketing efforts, and how often users take or complete defined actions. They allow you to track which sources of traffic and which actions lead to the most conversions on your website. To set up Goals, head to the Admin section, click Goals and then Create a Goal. You can choose from a list of template goals (that have standardized business objectives) or create your own custom goal from scratch. Here are some types of common types of Goals that are popular to set up: yy Time on Site yy Pages/Visit yy URL Destination yy Tracking a specific event (such as clicking on a "subscribe" link, or downloading a whitepaper file). After your Goals have been set up for a few days or weeks, head to the Conversions section of your Analytics account to view more information of completed goals and your conversion rates. Goals and Conversions are a necessary tool to help you understand the actions taken by visitors of your website and track trends over time; you can receive all of the analytics data in the world, but it is meaningless if you don't know how to read it and act on it.
12
Associating Google Search Console & AdWords Accounts

If applicable, you can also associate Google Search Console and AdWords accounts to your new Google
Analytics account. For Search Console, you can associate the accounts through your Search Console
homepage; click on Manage site and add Google Analytics property. You then just need to choose the web
property that you want to link to the site, and save your selection. This will now allow you to view Search
Console data directly within your Google Analytics reports, and also be able to access Google Analytics reports
directly from within your Search Console account.

To link Google AdWords to your Analytics account, it's a similar process: from your AdWords account, click
Tools and then Google Analytics. Or, go to your Analytics account first, click Admin, and select the account
that you would like to link to your AdWords account; in the "Property" column, select the property, and then
under Product Linking click AdWords Linking then the +New Link Group button and follow the instructions.

This AdWords and Analytics connection will allow
you to analyze customer activity through your
website; it will also allow you to do the following:
yy Import Google Analytics goals and transactions
   into AdWords as conversions
yy View Google Analytics site engagement data in
   AdWords
yy Create remarketing lists in Analytics to use in
   AdWords for targeting specific audiences
yy Automatically view your AdWords click and cost
   data alongside your Analytics site engagement
   data
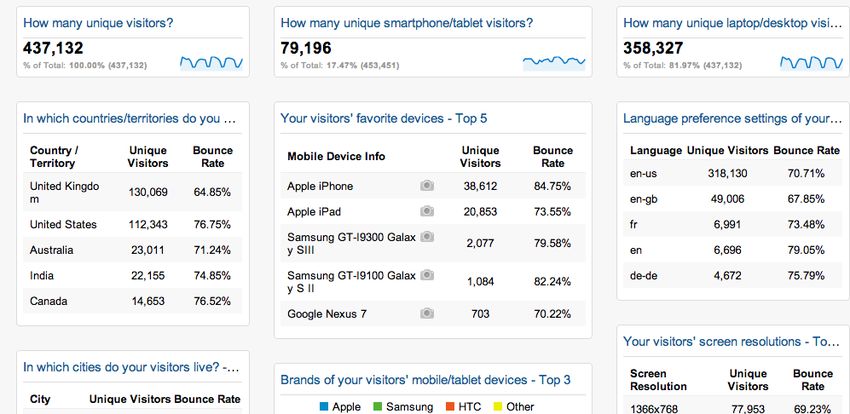
13

//04. Setting up and Using Dashboards

Dashboards create visualized summaries of different reports as widgets; they are displayed on a single page
in your Analytics account, giving you real-time, high-level access to your metrics and their performance.

Every Google Analytics account comes with a default dashboard that has a few standard widgets already
included. You can add or remove any widgets to this default dashboard, and you can create up to 20
dashboards to display your data in different formats (up to a maximum of 12 widgets per dashboard).

Shared Dashboards

Google has an awesome feature where you
can import any shared dashboard templates
into your own account for free! All you have
to do is find a shared dashboard that you
like, click on the link while logged into your
Analytics account, and choose the profile
you want to add the dashboard to. This is a
really great tool that can save you time setting
up your own dashboards, and boost your
reporting capabilities using others’ creativity.
Econsultancy.com has this useful listing of
some great templates to get you started.
14
Separate your Dashboards

It's a smart idea to separate your dashboards based on the information you want to pull out of them. For
example, if you want a real-time view of your Social Media Analytics, create a dashboard tailored just for
this data; or, if you want to test the stats on your new mobile-friendly website, set up a new dashboard that
tracks all of your Mobile Analytics. This separation of your data allows you to pull up one of these custom
dashboards and know exactly what you are looking at, and what section of your website the data is reporting
on. It's quick, it's easy, and readily accessible for all team members to access and understand.
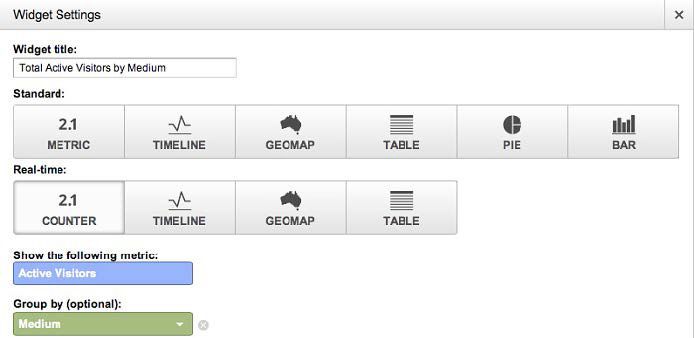
15
Using Widgets

There are a number of widgets available to add to your dashboards - the trick is knowing which
ones to use to get the insights you want and need.

yy Metric widgets: these widgets present a single piece of data on your dashboard along with a small sparkline.
   This is ideal if you need to check one specific piece of data each day, like the amount of revenue generated from
   an online store for a certain time of day.

yy Timeline widgets: these widgets provide a detailed chart showing trends by day. This widget allows you to
   show a single metric or compare two metrics, such as the daily number of website visits and corresponding
   revenue generated in the same period.

yy GEO map widgets: these widgets allow you to display a map within your dashboard, which can be very handy
   if your business is worldwide. You can go as detailed as showing the location of your visitors, or even compare
   conversion rates or engagement by specific geographic location.

yy Table widgets: these widgets are great for monitoring PPC campaigns, landing pages or specific content.
   They display a table that combines information with up to two metrics per dimension, so you can compare, for
   example, conversion rates between two products.

yy Pie widgets: these widgets are pretty self-explanatory. The data is presented in a pie or doughnut chart and
   can be useful for visual comparisons.

yy Bar widgets: these widgets present data in a bar chart, and are very useful for visualizing comparative data.
   You can edit the widget to present the data horizontally or vertically, and allows for additional customization to
   get the most out of the chart for your reporting.
16

Any one of these widgets can also have filters applied to them, allowing you to further
manipulate and define what is presented in the dashboard views.
17

                03
  HOW TO READ
AND UNDERSTAND
 YOUR ANALYTICS
WHAT DATA SHOULD YOU
     WATCH FOR?
18 //01. Acquisition Let’s start with Acquisition, or, in layman’s terms: visits. In order to build your website audience, you first need to find out who is coming to your site, where they are coming from, and what they are up to. The data provided can tell you anything from the country your visitors are coming from, how often they come to your site, how they found your site, and how they are browsing (smartphone, tablet, or computer). Google Analytics breaks down acquisition stats in a variety of views: yy Channels: how do you acquire visitors to your site? This view will allow you to compare between direct visits, referral visits, social media visits, etc. yy Keywords: which keywords or which sections of content are performing the best on your site? yy Campaigns: which campaigns are driving the most traffic to your site? yy AdWords Spend Analysis: you may be spending a lot on your AdWords budget and not understanding how to track your ROI. This view will allow you to analyze your paid marketing channels and get details on which campaigns are sending you the most traffic. yy Social Media: this section will show you all the stats on your social media accounts - which network is bringing you the most visitors, conversions, and shares, and which landing pages are most visited through which social channels. yy Affinity: This is an interesting analytics segment that allows you to understand which user profiles are visiting your site, based on their affinities. For example, “TV Lovers”, “Business Professionals”, or “News Junkies”. You can then use these categories to tailor your advertising towards categories that are bringing the most traffic to your site, or you can choose to remarket towards them in your AdWords account. ...and a few more, but you get the gist. Measuring your site visits is the easiest piece of the analytics pie - but it’s also the smallest.
19

//02. Engagement

Attracting visitors to your website is one thing, but keeping them there and getting those conversions is an
entirely different thing. Once you have a better idea of who is out there visiting your site, you can more easily
ensure that you reach them and fulfill their needs, by providing them what they’re looking for on a a well-
optimized, usable, peak performing site.
20
There are three actions that a site visitor can make: read the page they are on, click through your
site to additional pages, or leave your website entirely. Google Analytics engagement metrics will
help you track and measure these actions, and evaluate the quality and performance of your content.

There are three main metrics that track engagement in Google Analytics:

yy Pages/Visit: when a visitor comes to your website, they click through an average number of pages; the more
   engaging your content is, the more pages your visitors will click through, looking for more.

yy Average Time on Site: similarly, this metric tracks the average length of time a visitor will spend on your
   website, whether on a single page, or clicking through multiple pages. As a result, it’s safe to assume that the
   longer someone spends on your site, the more likely they found the content engaging and relevant to their
   needs. You can use this data to understand what keeps a visitor on your site, and also what makes visitors leave
   - which is extremely important information.

yy Bounce Rate: this rate measures the number of visitors that leave your website directly after reaching the
   entry page. This can help you determine if your entry page is performing well enough to interest your visitors
   into clicking through further, or if they leave right after reaching your website. Doing a thorough user experience
   analysis will help you pinpoint any potential reasons why a visitor may leave your site, and help you fix them
   before they become an issue.

If you are considering making any changes to your website design or layout, this information will be the most
useful for those decisions. Your entry pages need to be engaging, your content interactive, and your website
user-friendly. Accurately responding to your visitors’ behavior will lead you right to the next Google Analytics
metric that you need to track.
21

//03. Outcome (Goals & Conversions)

Setting goals are necessary
for you to measure the
performance of your
website. Google has four
goal types, and each one
measures a different
action or event:

Every time a goal is
completed, Google
Analytics will log a
conversion in your
account; if you can assign
a monetary value to each of these conversions, you can see how much these conversions are worth to your
business. You can also track abandonment rates (which is the rate of visitors who fail to convert on a specific
goal you’ve set up). The information provided within the Outcomes section really helps to paint a full picture
of your visitors, your website performance, and how your business is tracking against its conversion targets.

From this point, you have all of the data you need to sell and convert to your target market, and reach your
goals. As you can continue to watch your trends over time, you can do more testing, adapt as needed, and
then repeat, based on the insights that are provided within Google Analytics.
22

                  04
      GOOGLE
    ANALYTICS VS.
%     HUBSPOT
    HOW TO LEVERAGE
      BOTH TOOLS
23
If you’ve been humming and hawing over which tool to rely on for your website analytics, here’s your
answer: you don’t have to choose! Use both! HubSpot is an Inbound Marketing tool, and Google Analytics
is a website analytics tool: they each offer their own benefits to results and analytics reporting.
Whether you’re an existing HubSpot user or a new one, and are still looking to leverage your Google Analytics
results, here are some practical ways that you can rely on both tools, concurrently, for a complete view of your
website’s performance.
But first: because there is no team in “I” (or in this case, “H”), you have to start off by inserting your Google
Analytics tracking code into the HubSpot platform. Follow these steps:
1. Log into Google
Analytics and click
Admin
2. Under the Property
section, click Tracking
Info
3. Click Tracking Code
and copy the Tracking
ID that is listed.24
Once you've copied the Tracking ID, login to your HubSpot account and follow these next steps:
1. Click Content --> Content Settings
2. Under the Select a Domain to Edit, select one of the options from the dropdown list: either a default for
all domains, or for one specific domain
3. Scroll down to the
Google Analytics
section and check off
the Integrate with
Google Analytics box,
and add in the tracking
ID, copied from above.
4. Scroll down and click
Save Changes
Now that your Google
Analytics code is tracking on
your HubSpot platform, you
can start using either tool, or
both, to answer some standard analytical questions.25 //01. Basic Reporting For basic reporting, one of these tools isn’t really better than the other. You could use either to get the same information, so there is no clear “winner” in this category, covering items such as traffic, acquisition, and basic conversions. //02. Lead Tracking With Google Analytics, there isn’t actually an out-of-the-box way to determine if your leads are on your site, besides looking at the limited “Returned Visitors” section. You can use goal setting to track leads, but it’s not the most intuitive tool. HubSpot, on the other hand, integrates with many CRMs that can give you the ability to track specific visitors and leads on your site, and where they are coming from (down to the IP address). This information can help you tailor their website experience, depending on where they are in the sales cycle. Lead tracking and the ability to nurture contacts is one of the best “pros” of using the HubSpot tool.
26

//03. Increasing Site Traffic

This is a category where the two tools work best as a team. Google Analytics offers the ability to customize
your reports in many different ways to see how users are viewing your site, and they have a great section on
SEO analytics, which, partnered with Google Search Console, will help you become a master of your site’s SEO.

HubSpot, on the other hand, is built for inbound marketing; this means they have great tools for keyword
research and competitor research and analytics, which can help you with brainstorming new content for your
target audience.
27

//04. Campaign Performance

If you’re running different marketing campaigns and want to understand the results of each, Google Analytics
has all of the traffic information down pat, from direct traffic to referral traffic, or from search traffic to
campaign or AdWords traffic.

HubSpot’s email marketing tool will give you a great report on results from an email campaign, but they will
not provide the same information on site traffic that GA can.

//05. Content Performance

As noted above, HubSpot is all about Inbound Marketing, so their tools to help you create and market your
content are above par and will help you be the most successful in your content creation journey.

Google Analytics also offers a comprehensive section that can help you to understand how your content is
being consumed, such as how long visitors are staying on your site and how many pages they are visiting.
28

                                                               05

                       c              SUMMARY

Website analytics aren't just helpful for understanding historical website traffic stats; they can
also help you understand and predict future trends as well. All it takes is regular review of your
analytics data, in comparison to prior periods, for you to see and understand your traffic trends
and any areas where irregular traffic might be highlighted. Instead of trying to guess what could
be causing a traffic or conversion slowdown on your website, a simple review of your analytics
account can usually point out the problem right away.
29
Learn More
If you’re still looking for more information about Google Analytics and how it can help you improve your
website experience, check out these additional resources:
How Not to Analyze Your Analytics [Video]
http://blog.umamimarketing.com/how-not-to-analyze-your-analytics-video
Ad Blockers: What They Are and How They Affect Your Analytics
http://blog.umamimarketing.com/ad-blockers-what-they-are-and-how-they-effect-your-analytics
7 Smart Ways to Analyze Your Analytics
http://blog.umamimarketing.com/7-smart-ways-to-analyze-your-analytics
Recent Google Analytics Updates to Help Grow Your Business
http://blog.umamimarketing.com/the-most-important-things-to-know-about-the-recent-google-
analytics-updates
Gut Feelings...or Just Heartburn? Why You Need Analytics
http://blog.umamimarketing.com/gut-feelings...or-just-heartburn-why-you-need-analyticsUmami Marketing is a results-driven inbound marketing agency based out of Vancouver, BC,
Canada. We are a one-stop shop for small to medium-sized businesses’ marketing needs,
including search engine optimization, social media marketing, content creation, Google Adwords
and other paid marketing campaigns, and also Wordpress design and development. We’re
passionate about marketing and excited to partner with you in elevating your web presence and
reaching your inbound marketing goals.
Get Your Assessment With an Inbound Marketing Specialist
"Liked what you read? Why not sign up for a free Inbound Marketing Assessment?"You can also read