Control of Laser Focal Point by Using an Electrically Tunable Lens in Laser-induced Plasma Optical Emission Spectrometry - J-Stage
←
→
Page content transcription
If your browser does not render page correctly, please read the page content below
ISIJ International, Advance
                                      ISIJ Publication
                                           International,
                                                       by Advance
                                                           J-STAGE,Publication
                                                                      DOI: 10.2355/isijinternational.ISIJINT-2020-170
                                                                                  by J-STAGE
     ISIJ International, J-Stage Advanced
                                       ISIJ International,
                                            Publication,
                                             ISIJ International,
                                                         DOI:
                                                           Advance
                                                              http://dx.doi.org/10.2355/isijinternational.ISIJINT-2015-@@@
                                                                 Vol. Publication
                                                                      60 (2020), ISIJ
                                                                                 No.
                                                                                   by International,
                                                                                      J-Stage
                                                                                      12             Vol. 60 (2020), No. 12, pp. 1–6

Control of Laser Focal Point by Using an Electrically Tunable Lens
in Laser-induced Plasma Optical Emission Spectrometry

Yusuke FUGANE, Shunsuke KASHIWAKURA and Kazuaki WAGATSUMA*

Institute for Materials Research, Tohoku University, Sendai, 980-8577 Japan.
              (Received on March 25, 2020; accepted on June 1, 2020; J-STAGE Advance published date: July 15,
              2020)

             This paper suggests a method to control the focal point of laser on the on-focus position of a sample
           surface automatically in laser-induced breakdown spectrometry (LIBS). For this purpose, an electrically-
           tunable plano-convex lens was installed in a laser irradiation system, where it could vary the focal length
           of laser with a long working distance and a rapid response time, and the focal length could be periodically
           varied with a triangle waveform. Because the tunable lens was easily handled and inexpensive, the laser
           system could be modified with a low cost, as compared with commercial apparatuses having complicated
           optics to control the position of laser irradiation. A piece of scrapped stainless steel the surface of which
           was titled and had some roughness was investigated as a test specimen. A satisfactory result was
           obtained such that the plasma could be generated uniformly and firmly along a laser trace on the sample
           surface and thus could give the emission signal with a sufficient precision. The driving frequency of the
           tunable lens, which controlled a repetition period of the laser beam, was optimized to be 10 Hz when the
           scan rate of laser was fixed at 3.0 mm/s. As a result, it is expected that the LIBS system with the tunable
           lens can be applied to actual on-site/in-line analysis in material production.

           KEY WORDS: laser-induced breakdown spectrometry; focal-length tunable lens; laser scanning; elemental
           analysis; scrapped material.

                                                                      the oscillation mode of laser. This would cause a serious
1.   Introduction
                                                                      problem especially when LIBS is applied to in-line analysis,
   A gaseous plasma generated by irradiating a high-power             where lots of specimens having various sizes and shapes
laser is extensively employed as an excitation source for             have to be recognized and analyzed in a short measuring
optical emission spectrometry, generally called laser-                time. For such a purpose, Noll et al. suggested an experi-
induced breakdown spectrometry (LIBS).1) LIBS has several             mental apparatus of LIBS including an auto-tuning system
features suitable for on-site/in-line analysis in the actual          of the laser focal position to detect the emitted radiation
process of material production, in which an as-received               from the specimens.4) More recently, a group of Deguchi
sample can be analyzed with little pre-treatment under                published a LIBS measuring system for online elemental
ambient air atmosphere and thus the analytical result can             monitoring of a steel manufacturing processes,5) and also
be obtained easily and rapidly. In steelmaking industry, it is        reported a LIBS analysis of manganese in steel samples
now expected that LIBS can be applied to the ladle analysis           under high temperature atmosphere.6) A LIBS apparatus,
of steel products as an alternative to spark discharge plasma         which has a complicated optical system so that the emitted
optical emission spectrometry.2) Also, LIBS is a promising            radiation as well as the laser beam can be simultaneously
analytical method for sorting scrapped metallic materials             focused just on a sample surface, has been commercially
because it can determine their chemical compositions with             available for the fast in-line analysis.7) This apparatus can
a high response time,3) enabling the metal resources to be            provide analytical results enough to distinguish individual
highly recycled on the basis of the analytical information.           specimens while they are moving on a conveyer; however,
   It is an important issue in LIBS that the focal position           high initial and running costs are needed to operate it.
of laser irradiation has to be strictly controlled to create             We consider a simple and inexpensive system of LIBS by
laser-induced plasma on a sample surface; otherwise, no               using a fast electrically tunable lens, which may be avail-
emission of the sample species can be observed due to                 able for sorting scrapped materials when the specimens have
insufficient focusing of the laser beam. Generally, the focal         been arranged in a line by any mechanical operation. Figure
point of laser should be controlled with a precision of ca. 1         1(a) indicates a simplified illustration of the electrically tun-
mm, dependent of the incident power, the wavelength and               able lens. The tunable lens changes in shape by an external
                                                                      force. It consists of a container, which is filled with an opti-
* Corresponding author: E-mail: wagatuma@imr.tohoku.ac.jp             cal fluid and sealed off with an elastic polymer membrane.8)
DOI: https://doi.org/10.2355/isijinternational.ISIJINT-2020-170       The deflection of the lens is proportional to the pressure in

                                                                  1                                                      © 2020 ISIJ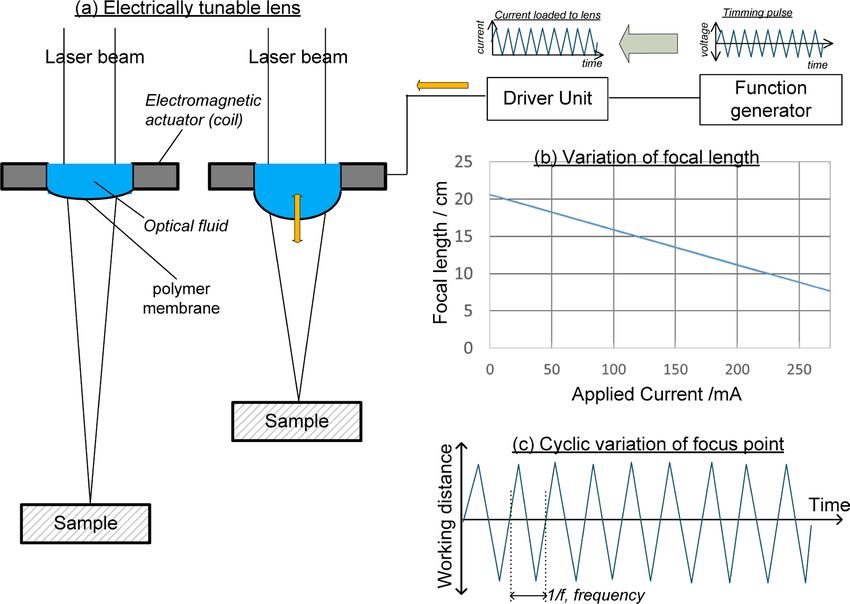
ISIJ International, Advance Publication by J-STAGE
                                            ISIJ International,
                                                  ISIJ International,
                                                                Advance
                                                                      Vol. Publication
                                                                           60 (2020), No.
                                                                                       by J-Stage
                                                                                          12

              Fig. 1.   Schematic drawing of the operation of an electrically tunable lens (a), the variation of the focal length driven by
                        applied current (b), and a cyclic variation of the focus controlled by a timing pulse from a function generator (c).
                        (Online version in color.)

the fluid, which is controlled by an electromagnetic actuator
that is used to exert pressure on the container.8) As a result,
the focal distance of the lens is varied by the current flowing
through the coil of the actuator. When the lens is installed
in a LIBS apparatus, the focal point of laser can be changed
widely and rapidly along the incident direction of the laser
beam. In this study, we represent the performance of this
LIBS system, especially regarding auto-focusing of the laser
irradiation when a sample moves along one direction (the
laser is scanned on the sample surface).

2.   Experimental
                                                                                    Fig. 2. Block diagram of a LIBS apparatus employed in this
   A schematic diagram of the experimental setup is depicted                                study. (Online version in color.)
in Fig. 2. A Q-switched pulsed Nd: YAG laser (SSL-330-
50, EKSPLA, Lithuania) was operated at a pulse width of
about 150 ps and an output wavelength of 1064 nm (funda-                         ing that the lens can follow a cyclic variation in the applied
mental frequency). A repetition rate of 50 Hz was applied                        current at a frequency of several 100 Hz (see Fig. 1(c)).
with a laser power of about 20 mJ/pulse. The energy of the                          The plasma emission was focused on the entrance port
pulsed laser was measured using a power meter for lasers                         of an optical fiber and collected on the entrance slit of a
with a thermal sensor (3A-P, Ophir Photonics, Israel). The                       spectrometer, dispersed by a Czerny-Turner-type mono-
laser beam was focused on the sample surface with a fast                         chromator (MS7504i, SOL Instruments Ltd., Belarus) with
electrically-tunable plano-convex lens (EL-10-30, Optotune,                      a grating of 3600 lines/mm at an actual resolution of 0.02
Switzerland), having an external diameter of 30 mm and a                         nm, and detected by an intensified charge-coupled detec-
clear aperture of 10 mm. This lens transmits 95% of the                          tor (ICCD) (DH734-18F-03, Andor, UK). All the intensity
laser beam at a wavelength of 1064 nm, and the adjustable                        data were acquired during a gate width of 500 μs at a delay
range of the focal distance may be varied from lens to lens;8)                   time of 0.5 μs after each shot of the pulsed laser, so that
therefore, we calibrated the actual working range of the lens                    strong background emission just after the breakdown could
employed in our experiment to obtain a variation from 20 to                      be blocked.9) All the experiments were carried out under
8 mm when the current applied to the electromagnetic actua-                      ambient air atmosphere and flow of the atmospheric gas
tor increased from 0 up to 250 mA, as shown in Fig. 1(b).                        was not controlled.
The adjustable range was also dependent on temperature.                             Eight standard reference materials (SRM) of aluminum
The response time in a pulsed operation is less than 2.5 ms                      alloy (Japan Aluminium Association, Tokyo) were prepared
when a rectangular current step changes the focal length                         to investigate the characteristics of the focal-tunable lens.
from 10 to 90% as much as the maximum value,8) indicat-                          In this study, a major alloyed element of magnesium was

© 2020 ISIJ                                                                 2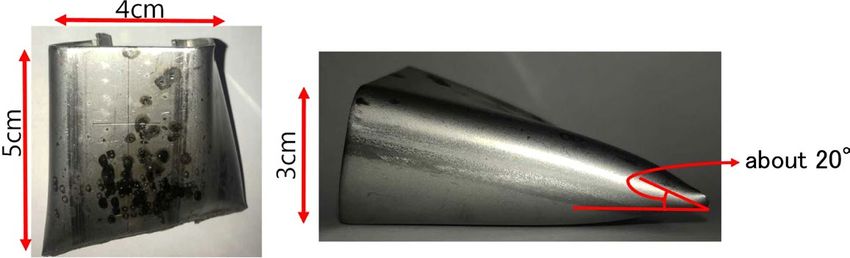
ISIJ International, Advance Publication by J-STAGE
                                             ISIJ International,
                                                   ISIJ International,
                                                                 Advance
                                                                       Vol. Publication
                                                                            60 (2020), No.
                                                                                        by J-Stage
                                                                                           12

     Fig. 3. Photograph of a test specimen (a piece of scrapped stain-
             less steel). (Online version in color.)

principally determined in the SRMs having the magnesium
content of 0.008, 0.014, 0.57, 0.97, 1.29, 1.38, 2.8, and 4.24
mass%. A sensitive atomic line, the Mg I 285.21-nm line,
was selected as the analytical line. These disk-shaped SRMs
had flat surfaces, and all the measurements were carried out
for their as-received surfaces without any pre-treatments
before LIBS, such as polishing with emery paper. In addi-                      Fig. 4. Variation in the emission intensity of the Al I 309.27 nm in
tion, a piece of scrapped stainless steel was prepared to eval-                        an aluminum alloy when the focus point of laser is gradu-
                                                                                       ally changed at an interval of 0.2 mm. A relative distance
uate auto-focusing of the laser irradiation. As a photograph                           of 0 mm corresponds to the on-focus position on the sam-
is shown in Fig. 3, this specimen has a dimension of 50 ×                              ple surface.
40 × 30 mm, with the surface tilted at an angle of about
20 degrees. As similar to the SRMs of aluminum alloy, the
as-received surface was under irradiation of the laser beam.                 off-focus positions, while the laser energy becomes insuffi-
   These specimens were set on a motor-driven X-Y-Z                          ciently transferred to the specimen due to de-focusing of the
stage (SGSP26-200S, SIGMA Koki, Japan), which was                            laser beam. In these cases, electrons of the metallic sample
controlled with a system controller (SHOT-304GS, SIGMA                       might work as a trigger in a production of the LIBS plasma
Koki, Japan), and could be precisely moved to the laser                      in which atoms of the specimen are involved.
beam in three-dimensional directions. The X-Y-Z stage                           It is found in Fig. 4 that the focal position should be
was first adjusted in the Z-direction (height direction) until               regulated to be within ± 1 mm from the surface of speci-
the irradiation position of laser had been focused just on a                 men (the on-focus point). A peak of the emission intensity
target position of the sample surface, and then the tunable                  was observed in this range of the focal position. The focus-
lens worked to vary the focal position of laser in a cyclic                  tunable lens enables this condition to be automatically
manner when the specimen was moved along a lateral direc-                    fulfilled by varying the focal distance of laser in a cyclic
tion at a constant speed. Our investigation was interested                   manner. However, experimental parameters of the lens, such
in how working parameters of the tunable lens should be                      as the frequency and the working distance of the focal point,
optimized, in order that the tilted sample of stainless steel                strongly affect the resultant emission intensities, and thus
could provide the emission signal even when the surface                      they should be optimized.
position was varied.
                                                                             3.2.   Comparison in a Calibration Curve between Fixed
                                                                                    and Cyclic-varying Focal Points
3.     Results and Discussion
                                                                                We investigated a calibration relationship between the
3.1.   Dependence of Emission Intensity on the Focal                         emission intensity of the Mg I 285.21 nm and the magne-
       Position of Laser                                                     sium content in the aluminum alloy SRMs when the tunable
   First of all, we investigated a variation in the emission                 lens worked in a cyclic manner, in order to evaluate the
intensity of an Al I emission line in a SRM of aluminum                      analytical performance in comparison to the result when the
alloy when the focal point of laser was step-wisely changed                  focal point was fixed on the on-focus position. As illustrated
at an interval of 0.2 mm. The Al I 309.27-nm line was                        in Fig. 1(c), the tunable lens was regulated using a triangle
employed as the analytical line. Figure 4 shows a typical                    wave which was generated with a function generator at a
result, where the displacement of 0 mm indicates the on-                     fixed frequency and a fixed amplitude; therefore, the focal
focus position when the laser was focused just on the sur-                   point was varied linearly and repeatedly.
face of specimen, and the plus and minus signs mean focal                       For a typical instance, the tunable lens was modulated
positions above and below the surface, respectively. It was                  at a frequency of 0.25 Hz and a working distance of ± 10
interesting that the emission intensity became drastically                   mm from the on-focus position, where the laser breakdown
reduced at focal positions just above the surface (only 2                    occurred intermittently, and the emission intensity from the
mm apart from the surface), because the irradiation energy                   plasma was measured for 16 s. This condition for the lens
of laser would be largely absorbed by the surrounding gas,                   realized that the laser irradiation crossed the on-focus posi-
thus decreasing atoms of the specimen to be ablated and                      tion 8-times, and that about 80 laser shots could contribute
ejected from the surface. On the other hand, the emission                    to the plasma formation when the laser beam was irradiated
intensity could be observed at focal positions beneath the                   at a repetition rate of 50 Hz, under the assumption that
surface (down to 6 mm from the surface). The reason for                      the effective range of the focal position was ± 1.0 mm as
this effect is that LIBS plasma can be produced even at these                denoted in Fig. 4. The emission intensity of the Mg I line

                                                                         3                                                            © 2020 ISIJ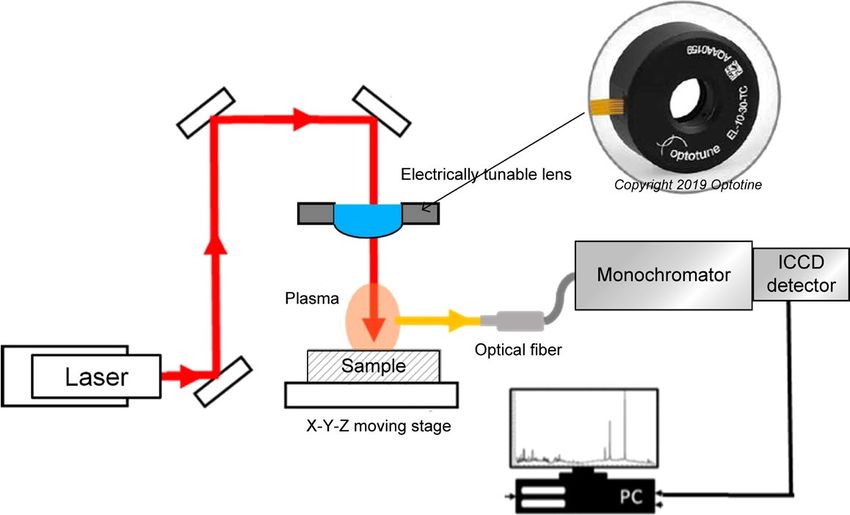
ISIJ International, Advance Publication by J-STAGE
                                          ISIJ International,
                                                ISIJ International,
                                                              Advance
                                                                    Vol. Publication
                                                                         60 (2020), No.
                                                                                     by J-Stage
                                                                                        12

was integrated and averaged over the measuring time of 16                    were always varied with moving the sample. The tunable
s, and four replicate measurements were conducted for each                   lens works to adjust the focal distance of laser irradiation
aluminum alloy SRM. Figure 5(a) shows a calibration curve                    so that the laser beam can be focused on the specimen sur-
of the averaged intensities in the auto-focusing operation                   face as frequently as possible; for this purpose, the driving
with the tunable lens using seven of the SRMs (the data of                   frequency of the lens should be optimized.
the 1.38-mass% SRM was excluded due to a measurement                            A large number of emission lines, originated from iron,
error), in which their relative standard deviations were esti-               chromium, and nickel in the specimen of stainless steel,
mated in a range between 4 to 18%. The emission intensity                    were found in the LIBS spectrum. Two sensitive lines of the
became saturated at higher contents of magnesium. This                       Cr I 360.53 nm and Fe I 358.12 nm were simultaneously
saturation is due to self-absorption of the Mg I 285.21-nm                   measured along with a scan of the laser beam on the speci-
line, because this emission line is assigned to a resonance                  men surface. The intensity ratio of the Cr I to the Fe I lines
transition from 3p 1P1 (4.3457 eV) to 3s 1S0 (0.00 eV).10)                   was estimated to correct an ablated amount of sample atoms
However, the resultant calibration curve could be well fitted                for each laser shot. The driving frequency of the tunable lens
to a second-order polynomial with a correlation coefficient                  was selected to be 0.25, 0.5, 1, 2, 5, 10, 25, or 50 Hz, with
(r2) of 0.9713. For comparison, a calibration curve was esti-                a working distance of ± 10 mm from the on-focus position.
mated when 50 shots of the laser were fixed to the on-focus                  It was measured how many laser shots could contribute to
position of specimens, as shown in Fig. 5(b). As similar to                  the plasma creation enough to excite the atomic emission
the data of the auto-focusing laser (see Fig. 5(a)), a fitting               of the sample atoms. Here, we defined ‘an effective shot’
with a second-order polynomial could be performed with a                     to have the Cr I/Fe I intensity ratio more than a threshold
correlation coefficient (r2) of 0.9836. Therefore, the calibra-              value, which was the average value minus the standard
tion relationship could be determined with high reliability in               deviation when they were calculated over all the laser shots
the auto-focusing mode as well as the fixed on-focus mode,                   (nominally 500). Figure 6 represents that a percentage of
implying that an auto-focusing control of laser could be                     the effective shots to the whole laser shots is the largest at
applied to the quantitative analysis of LIBS.                                a driving frequency of 10 Hz, which is a desirable condition
                                                                             for the laser scan. The intensity ratio was integrated and
3.3. Optimization of the Frequency of Tunable Lens                           averaged for each laser scan at a fixed distance of 30 mm on
   A repetition rate of laser, a moving speed of the sample                  the specimen surface. Then, triplicate measurements were
stage (a scan speed of the laser beam), and a driving fre-                   carried out for each driving frequency to check the preci-
quency of the tunable lens are interrelated experimental                     sion and the repeatability. Figure 7 indicates plots of the
parameters in the auto-focusing operation. More laser                        integrated intensity ratio (a) and its relative standard devia-
shots at a higher repetition rate are needed for observing a                 tion (RSD) (b) in the triplicate measurements, as a function
dynamic variation of the emission intensity along with the                   of the driving frequency of the tunable lens. The emission
movement of the specimen. Therefore, the laser repetition                    intensity has a maximum value at a driving frequency of 10
rate was selected to be 50 Hz, since it was the maximum rate                 Hz, and that the relative standard deviation is larger with
of our laser system. The other parameters were determined                    an increase of the driving frequency, meaning that the data
under various possible combinations. In this measurement,                    precision becomes worse at higher driving frequencies. The
the moving speed of the stage was fixed at 3.0 mm/s,                         following discussion is described to understand the reason
enabling 500 laser shots to hit on the specimen surface at a                 for these results.
sampling distance of 30 mm. As seen in Fig. 3, the piece of                     At lower driving frequencies (0.25 and 0.5 Hz), the verti-
scrapped stainless steel analyzed in this study had a tilted                 cal motion of the laser beam is slow, which may decrease
and distorted surface; therefore, the focal points of laser                  the probability that the laser beam can reach the on-focus

              Fig. 5. Calibration curves for the emission intensity ratio of Mg I 285.21 nm versus the Mg content in seven SRMs of
                      aluminum alloy, when the focal position of laser is modulated at a frequency of 0.25 Hz (a) and is fixed on the
                      on-focus position of the sample surface (b). (Online version in color.)

© 2020 ISIJ                                                             4
ISIJ International, Advance Publication by J-STAGE
ISIJ International,
ISIJ International,
Advance
Vol. Publication
60 (2020), No.
by J-Stage
12
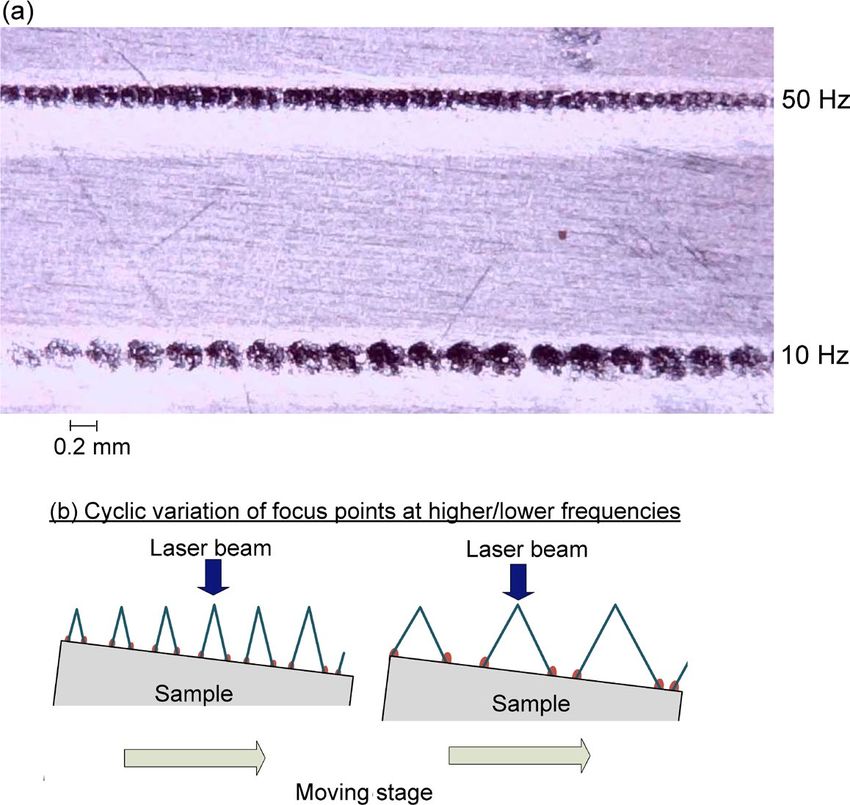
positions while the specimen is moved. This is a possible at driving frequencies of 10 Hz and 50 Hz. The groove of
reason why the averaged emission intensity as well as the 50 Hz is more continuous and thinner compared to that of
number of the effective laser shot is reduced at the low 10 Hz. This observation is an evidence that, at the 50-Hz
driving frequency of the tunable lens. On the other hand, driving frequency, the laser beam could hit the on-focus
at higher driving frequencies (25 and 50 Hz), the vertical positions frequently but the resultant plasma would be
motion of the laser beam is so fast that the irradiated laser insufficient to ablate the sample atoms and then to emit the
beam might not provide sufficient amounts of sample atoms radiation. A model for the plasma production is represented
(the laser ablation might occur faintly), thus resulting in the in Fig. 8(b). At lower driving frequencies, the plasma break-
lower emission intensities. Figure 8(a) shows microscope down occurs intermittently; however, each breakdown may
images of the ablation groove left on the specimen surface produce the plasma more firmly such that the laser energy
can be sufficiently transferred into the sample surface. This
Fig. 8. Optical microscope images (a) of the ablated groove when
Fig. 6. Percentage of the effective shots resulting in plasma to the the laser beam is modulated at driving frequencies of 10
whole shots at several driving frequencies of tunable lens, and 50 Hz. Schematic drawing (b) for representing cyclic
where error bars were estimated from triplicate measure- variations of the laser beam at higher (left) and lower
ments. The laser of 50 Hz was scanned on the surface of a (right) driving frequencies of the tunable lens. (Online ver-
piece of stainless steel at a moving speed of 3.0 mm/s. sion in color.)
Fig. 7. Plots of the integrated value of the intensity ratio of Cr I 360.53/Fe I 358.12 (a) and the relative standard deviation
(b), as a function of the driving frequency of the tunable lens. The laser of 50 Hz was scanned on the surface of
a piece of stainless steel at a moving speed of 3.0 mm/s.
5 © 2020 ISIJISIJ International, Advance Publication by J-STAGE
ISIJ International,
ISIJ International,
Advance
Vol. Publication
60 (2020), No.
by J-Stage
12
effect might explain the result regarding RSD as shown laser was fixed at 3.0 mm/s. The LIBS apparatus suggested
in Fig. 7(b): the emission intensity can be measured more in this study slightly modifies a conventional one, and thus
precisely at the lower driving frequencies. it is much less expensive than commercial LIBS apparatuses
Our measurement recommends that the driving frequency having complicated optics to control the focal point of laser
of the tunable lens is set at 10 Hz, because the emission on the three-dimensional position of a sample. Accordingly,
intensity from the specimen is the most intense with a this LIBS system may be applicable to actual on-site/in-line
relatively low RSD (2.5%). Of course, the experimental analysis in material production, when specimens flow along
conditions are largely affected by specimen-dependent fac- a line continuously, like a continuous casting process, or
tors, such as the kind, shape, and surface roughness. Thus, when many specimens such as scrapped pieces are arranged
we need to re-optimize the experimental parameters, in a in a line by any mechanical method.
case where these properties of sample are largely different.
Acknowledgments
This research was conducted under the support of a
4. Conclusions
Grant-in-Aid from the Ministry of Education, Science,
This paper described a method how the focal point of Sports and Culture of Japan. (No. 17 H01903). The authors
laser irradiation can be automatically controlled just on the are grateful to Nippon Steel Corp., Japan, for a Grant for
on-focus position of a sample in LIBS, based upon a fast LIBS research (2019).
variation in the curvature of an electrically-tunable plano-
convex lens. The lens can change the focal length with a long REFERENCES
working distance and a rapid response time, and the focal 1) J. Sneddon, T. L. Thiem and Y.-I. Lee: Lasers in Analytical Atomic
Spectroscopy, VCH Publishers, New York, (1997), 197.
length can be periodically varied with a function generator. 2) H. Kondo, M. Aimoto and K. Wagatsuma: Tetsu-to-Hagané, 100
A Q-switched Nd: YAG laser system is slightly modified by (2014), 846 (in Japanese).
using the tunable lens. A key of this measurement is that the 3) S. Kashiwakura and K. Wagatsuma: Anal. Sci., 29 (2013), No. 12,
1159.
laser beam can be flexibly focused on the specimens even if 4) R. Noll, C. Fricke-Begemann, S. Connemann, C. Meinhardt and V.
their shapes are changed every second. A piece of scrapped Sturm: J. Anal. At. Spectrom., 33 (2018), No. 6, 945.
5) Z. Wang, Y. Deguchi, F. Shiou, S. Tanaka, M. Cui, K. Rong and J.
stainless steel having a tilted surface with some roughness Yan: ISIJ Int., 60 (2020), No. 5, 971.
was investigated as a test specimen, where the LIBS plasma 6) M. Cui, Y. Deguchi, Z. Wang, S. Tanaka, M. Jeon, Y. Fujita and S.
could be generated uniformly and firmly along a laser trace Zhao: Plasma Sci. Technol., 21 (2019), No. 3, 034007.
7) Application Report for MonoLIBS, Secopta Analytics GmbH,
when the laser beam was scanned on the specimen surface. Teltow, (2019).
The driving frequency of the tunable lens, which controlled 8) Operation Manual for EL-10-30-Series, Optotune, Dietikon, (2019).
9) K. Wagatsuma: Bunseki, (2006), No. 10, 514 (in Japanese).
a repetition period of the laser irradiation, was an important 10) C. E. Moore: Atomic Energy Levels, Vol. 1, NBS Circular No. 467,
experimental parameter; in our measurement, the driving U.S. Government Printing Office, Washington, D.C., (1949), 106.
frequency was optimized to be 10 Hz when the scan rate of
© 2020 ISIJ 6You can also read