Provision Presentation to the Western Cape Drought Dialogue - Trevor Balzer Strategic and Emergency projects - Green Agri
←
→
Page content transcription
If your browser does not render page correctly, please read the page content below
The Impact of TITLE
        PRESENTATION   the drought on Water
        Presented by:
                         Provision
        Name Surname
        Directorate
  Presentation to the Western Cape Drought
     Date
                   Dialogue

Trevor Balzer
Strategic and Emergency projects
balzert@dws.gov.za

Friday 24 June 2016

                                     1
WATER THE “CRITICAL” RESOURCE

                       2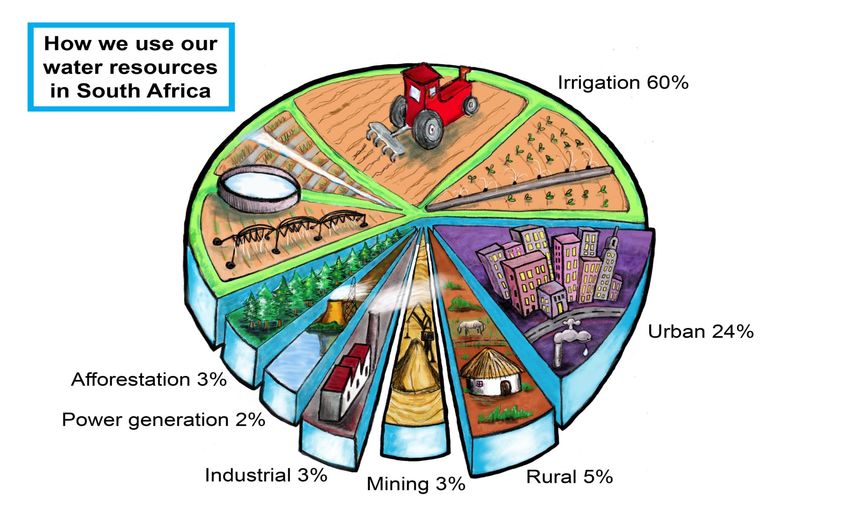
The Importance of Water – “THE” critical
              resource
• South African climate is a highly variable
• Water is naturally scarce in SA: limited freshwater resources
• Water is a critical resource for growth & development
• To date, water managers have successfully supported a strong
  economy and ongoing socio-economic growth
• To maintain the water balance, SA needs:
   – Ensure that water remains high on the national agenda
   – “smart” water management
   – all citizens/users to understand & appreciate the importance
     of water and work together to deal with the current drought
     conditions being experienced currently across six Provinces
   – all stakeholders to participate in active water management
   – Strengthen the leadership role of Government and
     governance functions
   – Additional water resource development, inter-basin
     transfers and regional bulk water distribution infrastructure 3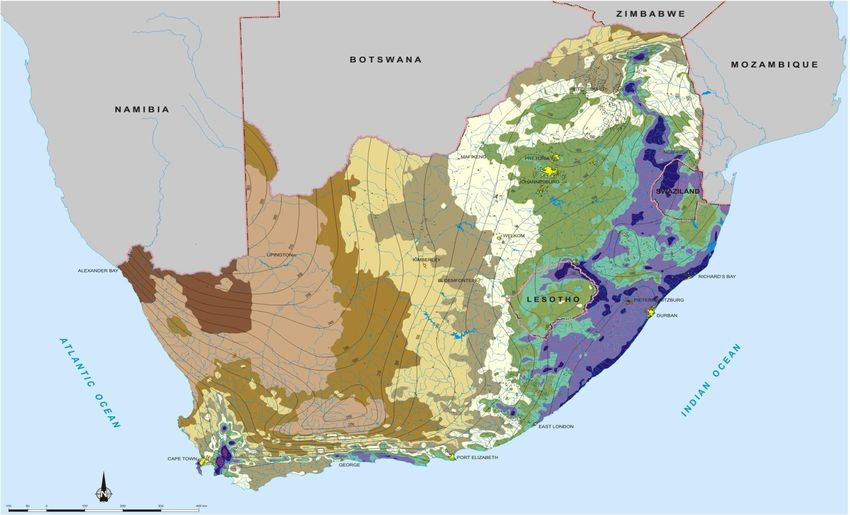
National Rainfall and Evaporation

                       Note skewed distribution
                       of rainfall, which increases
                       eastwards while evaporation
                        rates increase westwards
                                                 4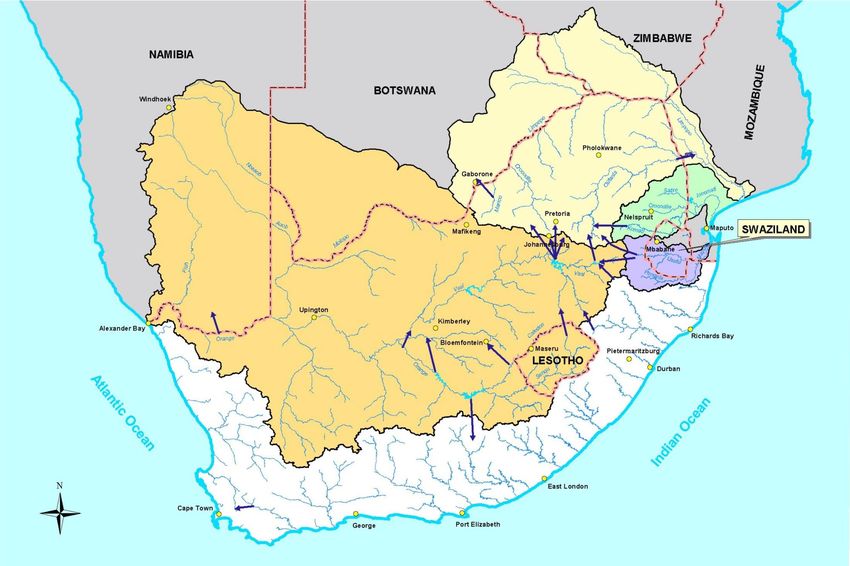
Shared Water Courses
• Four of our major river systems with six immediate
  neighbouring        countries:     Botswana,      Lesotho,
  Mozambique, Namibia, Swaziland and Zimbabwe.
• The total area covered by these four shared catchments
  in South Africa is equal to about 60% of our surface area
  and the mean annual flow from these rivers amounts to
  about 40% of the our total average river flow.
• These areas support ± 70% of gross domestic product
  and similar proportion of population.
• In order to regulate the use of water from these rivers, a
  number of bilateral and multi-lateral commissions and
  committees have been established between South Africa
  and its neighbours.
• South Africa is also party to the international convention
  that relates to shared water course management.            5
International Rivers shared by South Africa

                                                  6
                                              6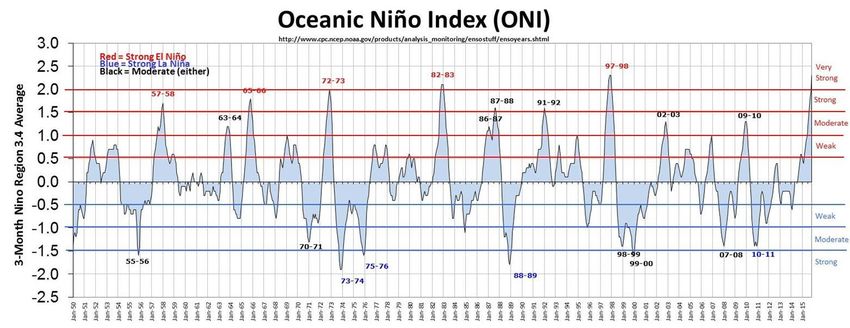
Limited Water Resource Potential

              Surface Water Potential                                          Ground Water Potential

Total Runoff = 49 billion m3/year (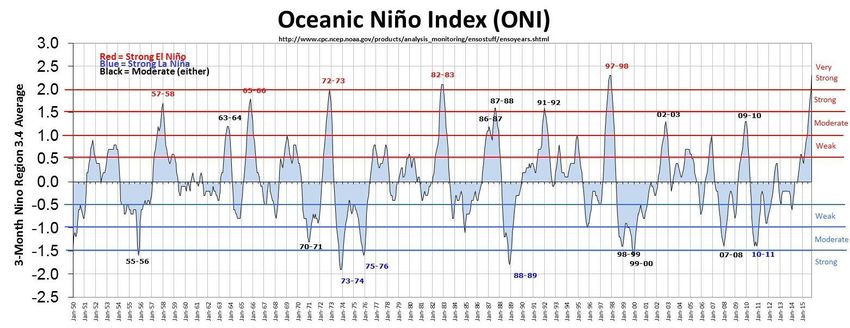
CURRENT WATER RESOURCES MIX AND USE

                        8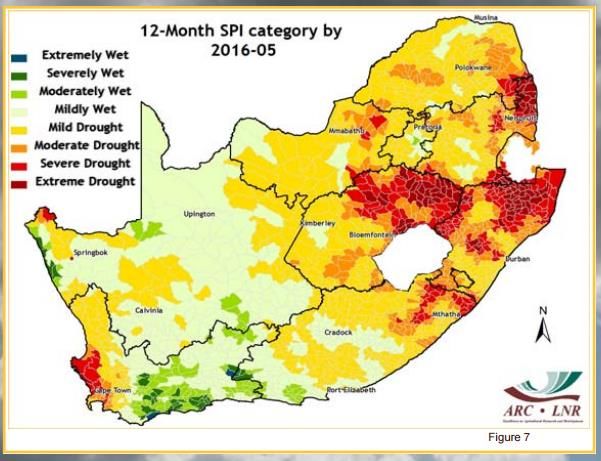
Current water resources mix
• At the planned 98% assurance level of supply RSA’s
  water use is constituted of:
   –   77% surface resources
   –   9% ground water
   –   14% return flows
   –   Desalination < 1%
   This water mix will in future need to be altered by
   increased use of currently under-utilised water
   resources such as groundwater (abstraction and
   recharge), re-use of water (waste water recycling),
   desalination in coastal areas and domestic rainwater
   harvesting.
   Competition for scarce water resources is increasing
   between all water use sectors, i.e. agriculture,
   industry, power generation, mining, commercial,
   domestic and environment.
                                     9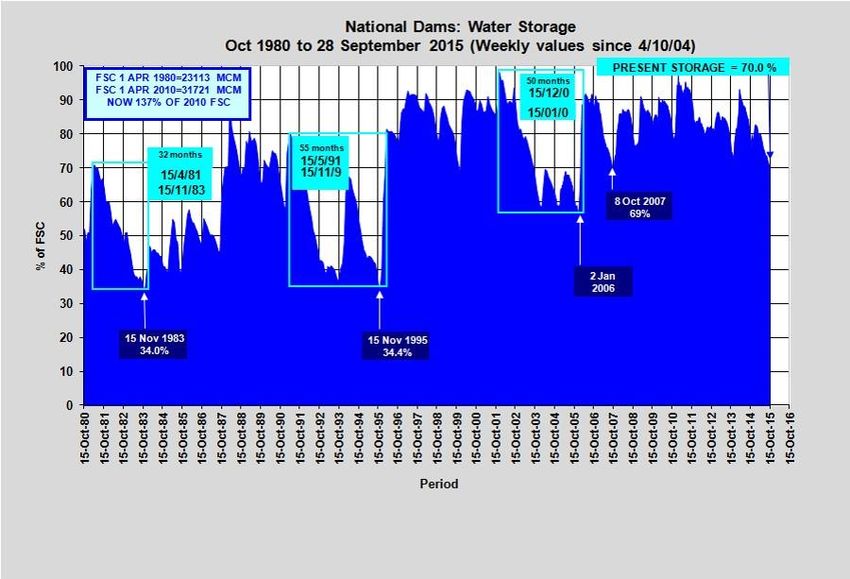
Existing water use
CURRENT DROUGHT

             11
Current Drought
• Drought is a natural phenomenon, and is not the first drought we are
experiencing, in order to deal with drought occurrences, our water
resources managers have developed very robust operating rules for all of
the major dams, which are used to determine the need for water
restrictions.
• As a result of the current drought conditions prevailing across much of
South Africa and the abnormally high temperatures experienced in
November and December 2015, our freshwater resources are currently
under serious pressure.
• Our economic nodes and national growth points are currently adequately
served through 238 schemes on a national basis, we measure 211 of
these dams on a weekly basis, currently schemes are in a positive water
balance at 53.1% of full capacity (20 June 2016) compared with 75.4% at
the same time last year and 70% at the start of the hydrological year (1
October 2015) .
• Drought disasters declared in 7 Provinces ( 3 Metros, 40 DM’s and
176LM’s).
• Western Cape Declared on 25 November 2015 (West Coast and Central
Karoo)
12Intensification of the Drought
• During 2015 the drought intensified over most parts of the summer
rainfall region and the images provided ARC show that according to
the Standardised Precipitation Index (SPI) the month of December
was extremely dry, the trend can be seen from the next four slides.
• This information correlates strongly with our records of declining
reservoir levels in the summer rainfall region as well as the winter
rainfall region.
• An assessment of the historical impacts of El Nino shows that our
dams will take a number of years to fully recover once the event
subsides to near-neutral:
– in 1982/83 our dams dropped to 34% which was compounded
by a moderate event in 1986/87 and the dams only recovered
to 85% in April 1988 (5 years)
– The 1991/92 and 2002/3 events took 3 years to recover to 90%
– We expect that it could take more than three years to recover
from the current event.
13SAWS Weather Outlook
• El Nino has weakened as predicted and is close to a neutral state.
• The likelihood of La Niña conditions next summer is increasing, while
the resurgence of another El Niño next summer is regarded as unlikely.
The likelihood of a La Niña (opposite of El Niño) to develop by late spring is
increasing.
• Although many parts of the country still suffer from insufficient rain, a
succession of cold fronts is expected over the South Western Cape and
Overberg with good expectations of rain and possible snow in the mountains.
• In the longer term there is an expectation of slightly above average rainfall in
the winter rainfall areas and below-normal rainfall in the interior.
• Maximum temperatures are expected above-normal over most of the
country, except in the west where they will become below- normal by late
winter.
• It is recommended that medium- and shorter-range weather forecasts be
monitored for the development of conditions that may alter or strengthen
the expectation of the current forecast. There is some uncertainty in the
longer term forecasts which makes it difficult to provide a confident outlook
for the next summer season at this early stage.
14Description of drought phases and corresponding indicator
thresholds
Indicator threshold
Precipitation Hydrology
Cat Description Possible impacts Frequency % of normal SPI CPC Soil Dam Ground
precipitation Moisture levels water
module % zone level%
D0 Dry Dry period: Short term dryness slowing plant growth of crops 1/3 yrSECRET 16
SECRET 18
CURRENT STATUS OF OUR DAMS

                   20
Current status of our dams: storage
trends as at 20 June 2016
• Our dams are built to harvest rainfall runoff during wet seasons for
later use during dry periods.
• The graph below presents the combined storage percentage (from
1980) of the national dams over time (the combined water storage
capacity has also increased over time as more dams have been
built). Periods of very low storage were experienced in the early
eighties, early nineties and early twenties, with the lowest
combined levels recorded on 15 November 1983 (34% of full total
capacity), 15 Nov 1995 (34.4% of full capacity) and 2 Jan 2006
(56.0% of full capacity) respectively.
• A downward trend started after the very high levels experienced
in 2010/2011 and while the value of 53,1% recorded at 20 June
2016 is still above the previous lows, it still shows a significant
downward trend.
21Very Strong
Oceananic Nino Index (ONI)

SECRET          23
Summary of Water in Storage per Province
                           Number of Dams per Province             % of full capacity
                     106
                FSC in
    Province                              10% to           22/06/15 13/06/16 20/06/16
                  m^3      Total   ≤10%            ≥100%
                                           40%             Last Year Last Week This Week
Eastern Cape       1 826    43      2       5       1       78,3        68,8        68,4
Free State        15 971    19      4      10       1       79,7        54,0        53,9
Gauteng              115    4       0       0       3       91,6        86,5        86,5
Kwazulu-Natal      4 669    18      0       5       0       67,6        48,3        47,6
Lesotho*           2 376    2       0       1       0       70,0        47,4        47,5
Limpopo            1 508    26      1       6       2       83,0        58,3        58,0
Mpumalanga         2 538    22      1       6       0       84,0        60,4        59,9
Northern Cape        146    5       1       1       1       83,9        64,1        61,4
North West           825    28      4      11       4       63,6        66,2        66,3
Swaziland*           334    1       0       1       0       82,1        23,9        23,9
Western Cape       1 853    43      1      17       3       45,7        30,2        35,1
Total             32 162 211       14      63       15      75,4        53,1        53,1
                                                                25
Overview of National Status of Dams at 13 June 2016 (1)
Item 13 June 20 June Comments
National Storage 53,1 % 53,1 % Overall situation stable, National total the
same. Last year: 75,4 %, present trend is
better than last year.
Dams < 10% 13 14 One more.
10% < Dams < 40% 64 63 One less.
Dams >100% 16 15 One less.
Most provinces are slightly down or stable, but Western Cape rose by almost 5% and North West very
slightly.
Vaal System Dams: 62,0% 61,7% 14 dams serving Gauteng, Sasol, and ESKOM.
Vaal 39,3% 38,8% Vaal Dam now below 40%
Katze 59,1% 59,0% Katze Dam now below 60%
Grootdraai 83,2% 82,1%
Sterkfontein 89,2% 89,3% System was 81,2% last year this time.
Bloemhof 21,7% 21,7% Note: nett volume for Vaal SystemOverview of National Status of Dams at 13 June 2016 (2)
Item 13 June 20 June Comments
Cape Town System: 29,4% 34,6 % 6 dams for City of Cape Town.
Voëlvlei 20,6% 25,5%
Brandvlei 18,4% 18,4% System was 51,8 % last year this time
Theewaterskloof 29,1% 32,1%
Clanwilliam 15,7% 18,8%
Berg River 25,7% 57,1% Responding very well to rain over the
Greater Brandvlei 18,4% 33,0% weekend.
Algoa System: 75,2% 75,0 % 5 dams for Nelson Mandela Bay
System was 82,3% last year this time
Amatola System: 85,6% 85,1% 6 dams for Buffalo City
System was 84,0% last year this time
Umgeni System: 51,7% 51,2% 5 dams serving Ethekwini & Mzinduzi
Nagle 66,8% 66,7% System was 97,4% last year this time
Midmar 45,0% 45,1%
Hazelmere 46,6% 45,0% Slightly down.
Goedertrou 19,8% 19,6%
Hluluwe 15,8% 15,5% Very low and dropping slightly.
Klipfontein 16,7% 16,0%
Bloemfontein: 32,9% 34,3% 4 dams serving Mangaung
27 last year this time
System was 36,0%WATER RESTRICTIONS
28Intervention by restrictions & shedding
• Restrictions are used on systems facing deficits to
prolong the water supply during periods of water
shortage.
• Restrictions are applied to stop supplying less critical
uses in order to avoid emptying the water resource
completely.
• For urban use, critical use include water for the house,
unlike gardening, swimming etc.
• Restrictions are gazetted by the Minister (or as
delegated) and if implemented, lasts until the drought is
broken.
29SYSTEMS OPERATIONS FORUMS (SOF)
• Comprises of the stakeholders who contribute in
guiding the implementation of the annual operating
rules.
• The main objective of the SOF is to provide a
consultative platform for implementation,
monitoring, auditing, reviewing and updating of
system operating rules and/or restrictions. This also
entails capacitating water control officers, operators
and water users.
• The role of SOF members is to disseminate
information and give feedback on measures taken in
order to comply with abstraction allocations,
especially during restrictions conditions.
• The establishment of the SOF also aims to ensure
equity and transparency in decision making process.FREQUENCY OF SYSTEMS
OPERATIONS FORUMS (SOF)
• SOFs are held at the end of the rainy season which is
regarded as the decision date when the operating
analyses are conducted as follows:
– the water available (yield) at the acceptable risk
levels is determined for current dam storage levels.
– This amount of water available is then compared to
the current supply to determine the level of water
restrictions needed.
– Additional decisions dates for restrictions are
required if systems have lower storage volumes
compared to inflow, as these systems react quickly to
drought, i.e. empty and fill more rapidly
– The importance of the timing of the analyses and
starting conditions are much more critical for short
term planning and drought management.DROUGHT MITIGATION MEASURES
32Short term mitigation measures
• Water conservation and water demand management (War on
Leaks);
• Surface water resource management (Optimised operation of
Systems);
• Managing and use of groundwater resources (drilling and
equipping boreholes);
• Eradication of invading alien plants/catchment care (WfW
programme by DEA);
• Eradication of illegal water use;
• Development of surface water resources (Raising of the
Clanwilliam);
• Water Transfers;
• Rainwater harvesting (provision of tanks in selected areas);
• Provision of static storage tanks at strategic locations and the
carting of water by tanker.
33Medium term to long term measures
• Medium term measures: domestic rain water harvesting,
hydro-census on current groundwater utilization and
possible future use, integrating groundwater and surface
water use in the future, small scale emergency
desalination, further water transfers, dolomitic aquifer
abstraction and recharge.
• Long term measures: review all state owned reservoir
operating rules, incorporate all municipal and privately
owned dams into the management system for future,
further transfer schemes to improve drought resilience,
large scale desalination options, institutionalise the
conjunctive use of surface and ground water, water quality
management with initial focus on WWTW, construction of
new dams/reservoirs, long term solution for AMD.
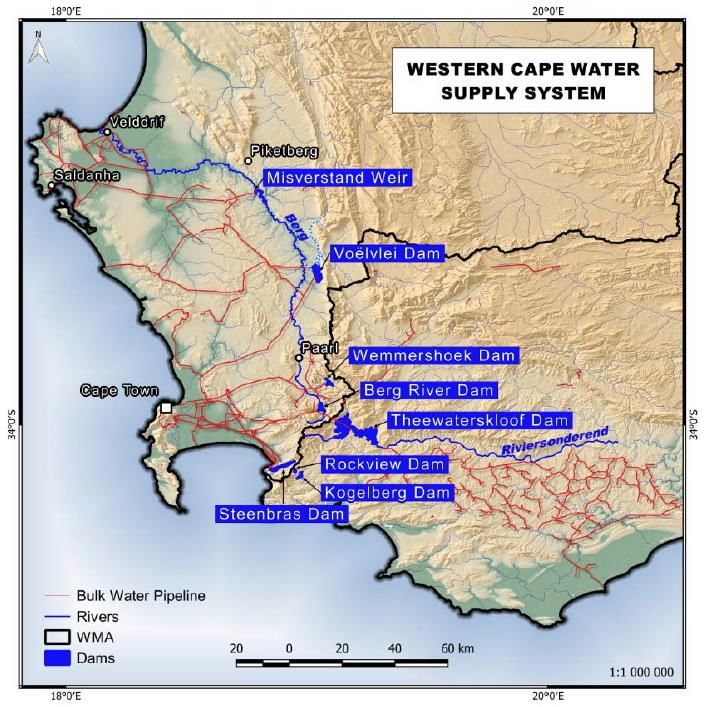
34WESTERN CAPE WATER SUPPLY SYSTEM
3536
SYSTEM OVERVIEW                                                                24 Rivers

                  Withoogte
                                    Misverstand
                                                                          LBerg IB

                                                              Mis
                  Swartland

                                                                                                    VLV
Legend             CCT
 Irrigation                                                                                              Voelvlei
  demand                                                                  CCT: Drakenstein
                                                         UBerg IB
  Metro

                                                                                                    WHK
 demand

Other urban                      Wynlands WUA   Sbosch
 demands
                                                                                         Wemmershoek

                                                                    BRD
                                                                           Berg River
  dam                         Kleinplaas
                                                                           Dam
                                                                               Theewaterskloof
         tunnel
                                          US
                         LS

         Supply                                                                      Vyeboom                 RSE IB
                                               Upper and Lower
         line
                     Palmiet                   Steenbras
Water Reconciliation Scenarios
• Water Requirement Scenarios
– Growth of domestic water requirements
– Growth of agricultural consumption / capped
allocation
– Industrial development Saldanha Bay
– Success of WC/WDM
• Available System Yield
– Impact of climate change
– Implementation of the Reserve
• Lead-times of available interventionsWater Reconciliation Scenarios
39Water Reconciliation Scenarios
DWS did pre-feasibility assessments on the following 6 projects:
• Augmentation of Voëlvlei Dam from Berg River catchment (winter
flow) downstream of the Berg River Dam. (Preferred option,
preliminary designs done (EIA started in November 2015), but may
only be ready by 2021, projected shortfalls may be experienced by
2019, see Cape Metro projects below).
• Michell’s Pass diversion weir (upper Breede ) to augment Voëlvlei
Dam.
• Raising the structure of the Lower Steenbras Dam
• Building a new dam in the Molenaars River (Worcester side of the
Huguenot Tunnel)
• Raising the structure of Voëlvlei Dam
40Water Reconciliation Scenarios
Cape Metro is also doing the assessment of the flowing initiatives:
• More intensive Water Conservation and Water Demand Management
implementation of measures
• Desalination of seawater (working with ESKOM on utilising Koeberg’s
marine intake works)
• Development of groundwater (deep drilling would be expensive around
Theewaterskloof and Wemmershoek dams, quality problems to do large
scale development of the Cape Flats Aquifer, but small scale projects
being implemented by the CCT)
• Re-use of waste water (significant problems in taking this up into the
water supply systems, needs significant pumping to one of the large
storage dams to dilute with fresh water after final purification. Concerns
about dealing with suspected toxins, hormones, oil, heavy metals:
storing somewhere for a year after pre-treatment may solve most
problems, but the available storage in one of large dams require high
heads for pumping over long distances (to either Steenbras Dam or
Bergrivier Dam.)
41THANK YOU!
Reconciliation report is available at
https://www.dwa.gov.za/Projects/RS_WC_WSS/ ,
more specific:
https://www.dwa.gov.za/Projects/RS_WC_WSS/Docs/Re
conciliation%20Strategy.pdf
Weekly status of reservoirs report at:
http://www.dwa.gov.za/Hydrology/Weekly/Weekly.pdf
42You can also read