The Color Analysis of Building Façades: Based on the Panoramic Street View Images - gis.Point
←
→
Page content transcription
If your browser does not render page correctly, please read the page content below
184 Full Paper

The Color Analysis of Building Façades:
Based on the Panoramic Street View Images
Wei Zhang1, Yuxing Zhou2, Mengqi Yang2
1Huazhong Agricultural University, Hubei/China · zhang28163@gmail.com
2Huazhong Agricultural University, Hubei/China

Abstract: The color scheme of the building façades is a critical visual impression of the city’s context
and characteristics. Analyzing the building colors can provide a way to get an objective and holistic
view of the city and a foundation to enact regulations and ordinances on the building color and texture.
Traditional color analytical processes are usually carried out by manual survey and sampling, which
can take a lot of time and be high-cost in large-scale urban areas, and are limited by the number of color
samples and accidental factors of the environment. To this end, we proposed an automated color sam-
pling and analysis method by using street view images as the data source. The images were semantically
segmented to extract the façade areas with a convolutional neural network. The dominant colors of the
building façades were then identified and transformed to the Munsell color system for further analysis
and comparison between different districts. The research can provide a repeatable and objective urban
building color analysis method and a low-cost, high-efficiency tool for urban color surveys.
Keywords: Building façades, street view images, convolutional neural network, Munsell color system

1 Introduction
The color scheme of a city is an essential element of the urban landscape and is related to the
first impression of the city. It is also a reflection of the city’s historical context. By analyzing
the colors of the buildings, we can get a more objective and holistic view of the city and can
provide a foundation for the regulations and ordinances for the color and texture usage of
building construction.
Research on building colors has a long history that dates back to the 1st century. Vitruvius,
the Roman architect has described the natural color materials in his book “De Architectura
Libri Decem”, known today as “The Ten Books on Architecture” (CAIVANO 2006). In recent
years, the harmony of building color has been widely applied in urban color plans in a number
of cities around the world (WANG et al. 2020, XU et al. 2020). Traditional research methods
for urban color analysis include color card comparison, instrument color measurement and
photograph recording (LI et al. 2020). These methods are usually carried out by manual sur-
vey and sampling, which is limited by the number of color samples and the environment’s
accidental factors. Moreover, because the color sampling process is operated manually, it
could take a lot of time and be high-cost.
Due to the limitations of current color analysis methods, most studies of urban building colors
are focused on a part of the urban area such as the historical area or downtown area, while
large-scale studies on the city scale are seldom carried out (LUAN & JACQUES 2017). As
urban color planning has received much more attention in urban planning, current research
tools cannot meet the need for color analysis.
With the development of street view services by Google, Bing, Baidu, and other map service
providers, the access to the realistic views of the urban buildings in most cities around the
world has become available for everyone. The panoramic images collected by the data re-

Journal of Digital Landscape Architecture, 6-2021, pp. 184-194. © Wichmann Verlag, VDE VERLAG GMBH ·
Berlin · Offenbach. ISBN 978-3-87907-705-2, ISSN 2367-4253, e-ISSN 2511-624X, doi:10.14627/537705015.
This article is an open access article distributed under the terms and conditions of the Creative Commons
Attribution license (http://creativecommons.org/licenses/by-nd/4.0/).
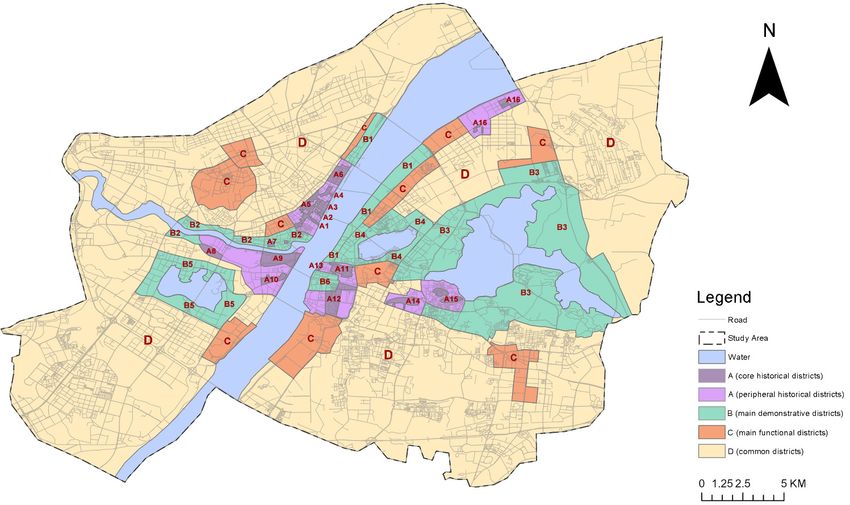
W. Zhang et al.: The Color Analysis of Building Façades 185

cording vehicles could provide an intact and continuous illustration of building façade along
the street. Compared to traditional sampling methods, using the large-scale street view im-
ages as the data source could significantly reduce the time costs, and is suitable for large-
scale urban problems the study.
To this end, we used a large scale of Baidu street view images as a data source and semanti-
cally segmented them to extract the façade areas with the help of a convolutional neural net-
work. Then, the dominant colors of the building façades were identified and transformed to
the Munsell color system for the analysis and composition between different districts. This
can provide a repeatable and objective urban building color analysis method and offers a low-
cost, high-efficiency analysis tool for urban color surveys.

2 Study Area
Wuhan is a city located in the central part of China. The city’s central urban area (678 km2)
was selected as the research area. Since 2014, Wuhan Natural Resources and Planning Bu-
reau has initiated a research project on the building color and material planning and manage-
ment in response to the goal of “improving the living environment and creating a charming
Wuhan.” Based on the city’s historical context, the city government released the “Regula-
tions on the Usage of Building Colors and Materials in the Main Urban Area of Wuhan” in
January 2016. The regulation adopts the Munsell color system to describe the colors and
requires that the façades of the new, rebuilt, and expanded buildings must meet the regula-
tions by adopting one or several colors listed by different color regulated districts. The listed
colors are determined by a systematic field study and a public questionnaire survey. The
corresponding color regulated districts and each district’s acceptable colors are shown in the
figure below (Figure 1 & Figure 2).

Fig. 1: Districts listed in the “Regulations on the Usage of Building Colors and Materials
 in the Main Urban Area of Wuhan”
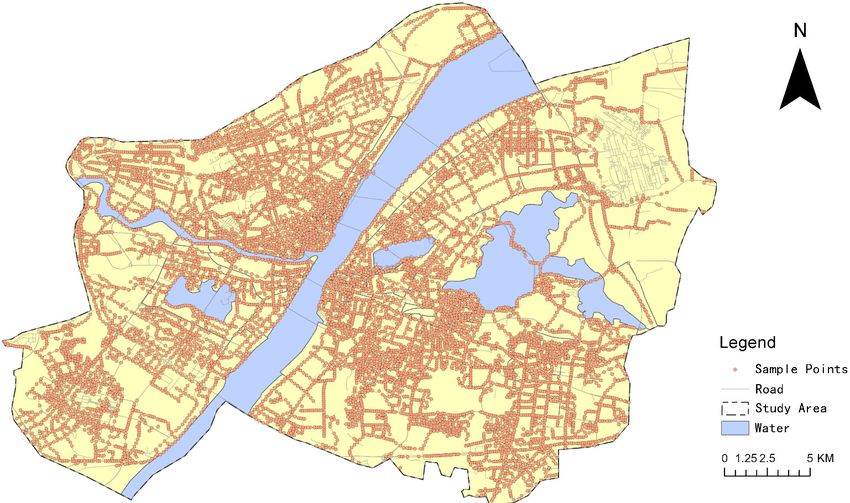
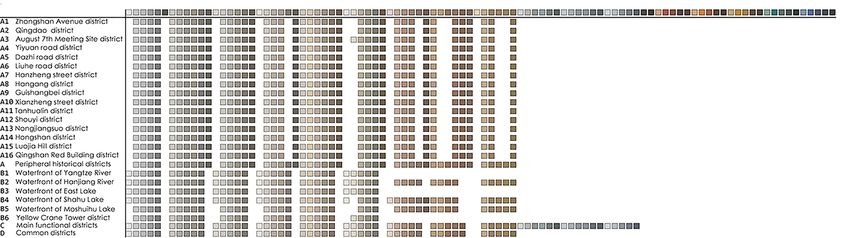
186 Journal of Digital Landscape Architecture · 6-2021

Fig. 2: The acceptable colors of the building façades in different districts in the regulation

3 Methods
3.1 Acquiring Panoramic Images
The street vector data in the area are downloaded from OpenStreetMap (OPENSTREETMAP
CONTRIBUTORS 2020). The roads and streets located on the ground were screened out by
removing the viaducts, underground tunnels, and bridges based on the attributes of the vector
data. Then the streets were divided into equal distances with 200m intervals to find the sam-
pling points to acquire the panoramic images (Figure 3).

Fig. 3: Sampling points of panoramic images in the main urban area of Wuhan

The panoramic street view images were obtained by a web crawler with Baidu API (BAIDU
LBS 2020). Each image downloaded was a 2:1 equidistant cylindrical projected image with a
resolution of 1024×512. 10294 valid panoramic images were finally obtained.
W. Zhang et al.: The Color Analysis of Building Façades 187

3.2 Projection Transformation
As different areas are not proportional on an equidistant cylindrical projected image, the
equidistant cylindrical projected image was transformed to a cylindrical equal-area projected
one with the following equations (Figure 4):
 1
 2 = (1)
 2

 2 = 0 (2)
y0 is the pixel height of the cylindrical equal-area projected image, x1, x2 are the corresponding
x, y pixel coordinate of the equirectangular projected image, y1, y2 are the corresponding x, y
pixel coordinate of the cylindrical equal-area projected image (ZHANG et al. 2020).

 Equirectangular projected images

 Cylindrical equal-area projected images
Fig. 4: The transformation from equirectangular projection to cylindrical equal-area pro-
 jection

3.3 Recognize and Extract Building Façade by Semantic Segmentation
The convolutional neural network Dilated ResNet-105 was used to identify and extract the
building façade area in the cylindrical equal-area projected image. The training data is from
the Cityscapes Dataset. The accuracy of semantic segmentation is measured by Mean Inter-
section-Over-Union (mIoU), which first computes the IOU for each semantic class and then
computes the average over classes (QUAKNINE 2019). IoU is defined as follows: IoU = true
positive / (true positive + false positive + false negative). Dilated ResNet-105 achieves an
mIoU of 75.6% on the Cityscapes dataset. After removing 917 images that did not contain
building façade areas, the remaining 9377 images were binarized to the building façade areas
and other areas. The binarized images were then used as masks to extract the building façade
areas on the panoramic images (Figure 5).
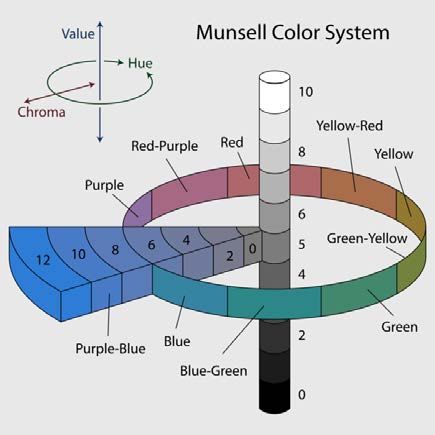
188 Journal of Digital Landscape Architecture · 6-2021

 Semantic segmented images

 Extracted façade areas
Fig. 5: Semantic segmented images and extracted façade areas

3.4 Extracting the Dominant Façade Colors
To reduce the influence of different lighting conditions and shadows cast on the façades, the
façade areas which were excessively light or dark were removed before further analysis with
the following RGB value calculation:
 ++< 1.1 (3)
 − ∨ + −∨ + −∨ 0.4 (4)
To analyze the dominant colors of the building façades, the color that covers the largest pro-
portion on each image was extracted as the dominant color of the building.

3.5 Conversion to the Munsell Color System
The Munsell color system is a color space system proposed by the American painter and art
educator Albert H. Munsell in 1898. This color system expresses the color relationship be-
tween Value, Color, and Chroma in a three-dimensional sphere (Figure 6). It is based on
human visual perception of uniform marking colors, making it a reliable scientific basis
(GONG & SHENG 2019, SALLY 2014). Color in the Munsell color system is divided into five
dominant colors and five intermediate colors formed by mutual mix: red (R), red-yellow
(YR), yellow (Y), yellow-green (GY), green (G), green-blue (BG), blue (B), blue-purple
(PB), purple (P), purple-red (RP), and divide the changes between two adjacent colors into
ten parts, a total of 100 kinds of color. The middle axis of the sphere is Value, which is
divided into 11 levels, from all-black (N0) to all-gray (N5) to all-white (N10). The radiation
extending from the center of the central axis is Chroma, and its value increases from 0 near
the central axis as the distance from the central axis increases. The composition of its color
expression is Color + Value/Chroma; for example, 5GY4/6 is Color 5GY with Value N4 and
Chroma 6 (Figure 7).
The Munsell color system is based on psychology and is formulated according to the visual
characteristics of different colors. It is widely used in color representation and management,
and also used as a standard and tool to define color relationships, evaluate color matching
effects, and record color forms.
As the “Regulations on the Usage of Building Colors and Materials in the Main Urban Area
of Wuhan” was based on the Munsell color system. The RGB colors of the façades were then
transformed to the Munsell colors based on ASTM D1535 tables with the Illuminat C Ob-
server (AKEN 2020).
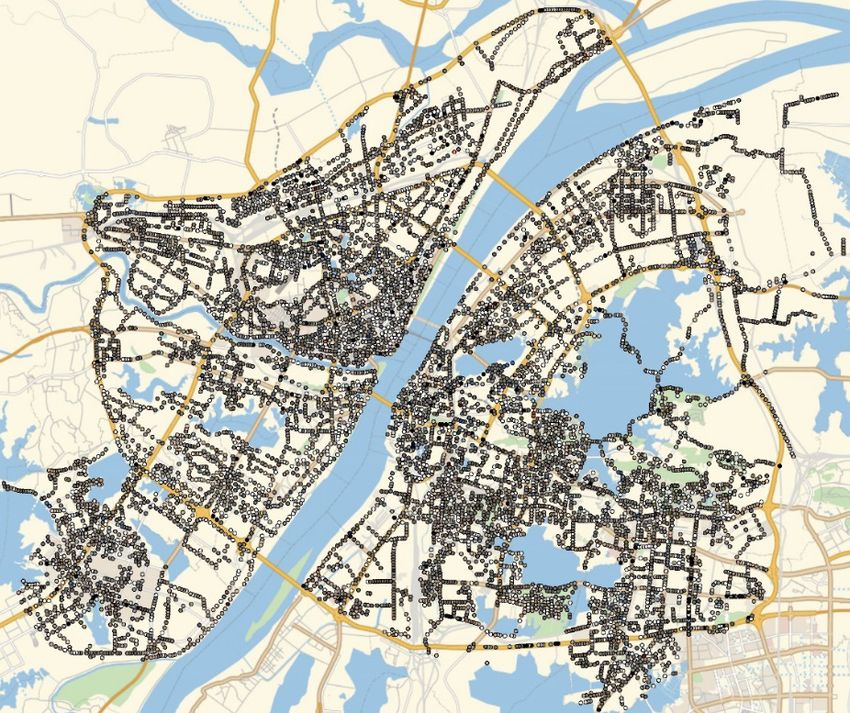
W. Zhang et al.: The Color Analysis of Building Façades 189

Fig. 6: Munsell color system Fig. 7: Munsell color system distribution band of Color

4 Results and Discussion
It can be seen that the dominant colors of the building façades are mainly pale white, slate
grey, and light brown (Figure 8). The dominant colors in different districts are generally sim-
ilar, and the color characteristics of different areas are not very prominent.

Fig. 8: Distribution map of dominant colors of buildings in the main urban area of Wuhan
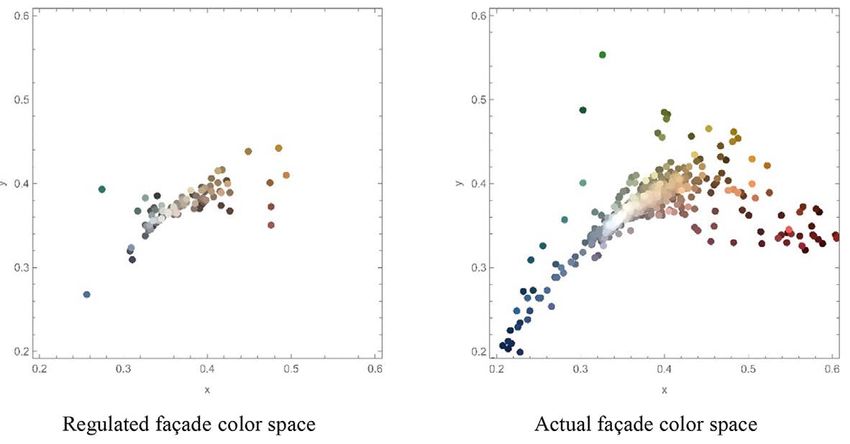
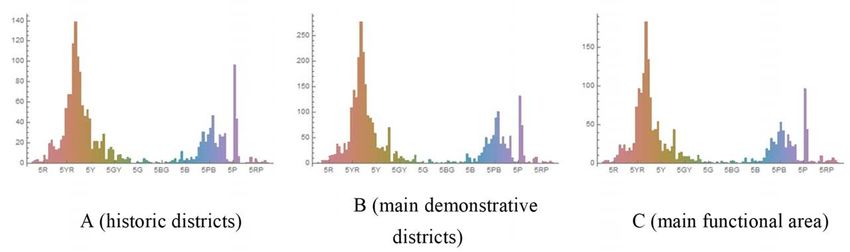
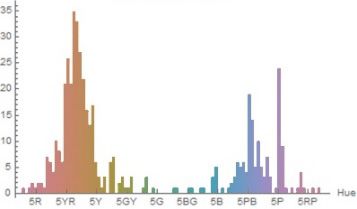
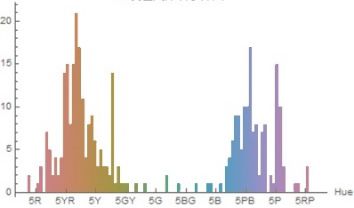
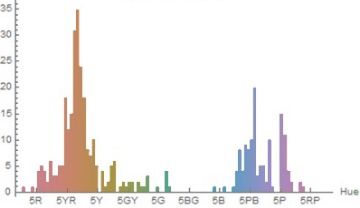
190 Journal of Digital Landscape Architecture · 6-2021

A comparison between the 98 Munsell colors recommended in the “Regulations on the Usage
of Building Colors and Materials in the Main Urban Area of Wuhan” and the actual dominant
colors of the city are illustrated in CIE-XYZ color space (Figure 9). It can be seen that the
colors of the building façades are mostly consistent with the regulations, and there are a few
colors such as dark blue, medium green, dark orange, and saddle brown listed outside the
regulated color area.

Fig. 9: Comparison of regulated and actual façade colors in CIE-XYZ color space

In the “Regulations on the Usage of Building Colors and Materials in the Main Urban Area
of Wuhan,” the main urban area of Wuhan is divided into 4 different districts: A (historical
districts); B (main demonstrative districts); C (main functional districts) and D (common
districts).
To reduce the complexity and visualize the hue distribution of the dominant colors, the Value
and Chroma of each color were unified to 6, and the colors without a hue (pure white to grey)
were dropped out. The color distribution of dominant colors in each region are shown in
Figure 10. It can be seen that the colors in different districts are mainly distributed between
5YR-5Y with 2 other peaks at 5P and 5PB, which shows that the warm orange and blue-
purple are in dominance.

Fig. 10: Color distribution of the façades in different districts
W. Zhang et al.: The Color Analysis of Building Façades 191

The city of Wuhan has a history of 3500 years. The historical districts of Wuhan contain a
number of traditional Chinese and western buildings. The color distribution of each historical
district is shown in the figure below (Figure 11).

A1 Zhongshan Avenue A2 Qingdao district A3 Aug.7 Meeting Site A4 Yiyuan road district
district district

A5 Dazhi road district A6 Liuhe road district A7 Hanzheng street A8 Hangang district
 district

 A10 Xianzheng street A11 Tanhualin district A12 Shouyi district
A9 Guishanbei district
 district

A13 Nongjiangsuo A14 Hongshan district A15 Luojia Hill district A16 Qingshan Red
district Building district

Fig. 11: The color distribution of each historical district

Although the recommended colors in the regulation are almost the same in A1 – A16 districts
(Figure 2), the hue distribution in different historical districts show that colors are variant.
Districts such as A5, A9 and A16 have a wider hue distribution than other districts. And in
most districts the warm colors are in the majority.
192 Journal of Digital Landscape Architecture · 6-2021

B1 Waterfront of Yangtze River B2 Waterfront of Hanjiang River B3 Waterfront of East Lake

B4 Waterfront of Shahu Lake B5 Waterfront of Moshuihu B6 Yellow Crane Tower district
 Lake

Fig. 12: The color distribution of each main demonstrative district

The color distribution of each main demonstrative district is shown in Figure 12. The B1 –
B6 districts are the waterfront areas of Wuhan. Some of the districts such as B2 have a wide
distribution of cold colors from blue to purple while the warm colors are also significant.
However, compared to A or C districts, the color difference is not very prominent.

5 Conclusion and Outlook
Focusing on the building façade colors of Wuhan's central urban area, we used panoramic
images downloaded from Baidu Map, and extracted the façade areas by semantic segmenta-
tion to conduct color analysis based on the Munsell color system. The result shows that the
dominant colors of the main demonstrative districts, the historical districts, and the waterfront
districts are mainly warm. And the typical colors are pale white, slate gray and light brown.
Compared with requisite colors listed in the “Regulation on the Management of Building
Colors and Materials in the Main Urban Area of Wuhan”, the difference of façade colors
between each district is not very significant, further coordination is still needed to highlight
the characteristics of different districts in the city.

5.1 Potential Applications
As the number of cities which adopt the color management regulations is continuing to in-
crease, the establishment of a holistic building color database has become valuable as the
foundation of further analysis. The research proposed a method to automatically identify
building dominant façade colors by recognizing and extracting the façade areas on the pano-
ramic street view images. First, the semantically segmented images are binarized and trans-
formed to the cylindrical equal-area projected images to extract the façade areas. Then the
color composition of façade areas is calculated to obtain its dominant colors. It is suitable for
W. Zhang et al.: The Color Analysis of Building Façades 193

analyzing building façade colors in large-scale areas. Compared with traditional manual color
sampling and recognition, it can shorten the analysis time, reduce the labor cost, and improve
the accuracy of color analysis. Moreover, with the regularly updated panoramic images col-
lected by vehicles, the dynamic change of building colors could be monitored, and the par-
ticularly popular/unpopular colors could be found. The regulation could be more flexible and
adaptive to different developments (e. g. the maximum deviation from the given colors could
be regulated by percentage, or the allowed colors would be updated cyclically based on the
dominant city colors).

5.2 Limitations and Future Research
The accuracy of color recognition is influenced by a number of environmental factors. The
street trees and street furniture may block some part of the building façades and will affect
the color recognition. The colors on the panoramic image may deviate from the actual color
for some factors such as the time difference of the panoramic street view images were taken
and illumination conditions. And the accuracy of the neural network model’s semantic seg-
mentation limits the accuracy of the recognition results. At present, there are still some other
elements such as cars or pavement that could be misidentified as the building façade area.
Moreover, casted shadows or light reflection may also affect the accuracy of color recogni-
tion. More refinement is still needed to make the color analysis process more precise and
adaptable to different urban areas.

Acknowledgements
This work was supported by the Natural Science Foundation of China [51808245].

References
AKEN, H. (2020), WallkillColor Munsell Conversion Software.
 http://www.wallkillcolor.com/Munsell21/index.htm (11.12.2020).
BAIDU LPS (2020), Baidu Static Panoramic Street View API.
 http://api.map.baidu.com (11.12.2020).
CAIVANO, J. L. (2006), Research on color in architecture and environmental design: Brief
 history, current developments, and possible future. Color Research & Application, 31(4),
 350-363.
GONG, R. Q. & SHENG, J .P. (2019), Conversion from Munsell color space to RGB. Industrial
 Control Computer, 85-86.
LI, K. R., YANG, Y. Q. & ZHENG, Z. Q. (2020), Research on color harmony of building fa-
 çades. Color Research & Application, 45 (1), 105-119.
LUAN, N. & JACQUES, T. (2017), Color in the urban environment: A user‐oriented protocol
 for chromatic characterization and the development of a parametric typology. Color Re-
 search & Application, 42 (1), 131-142.
OPENSTREETMAP CONTRIBUTORS (2020), Street Data from Wuhan. China.
 https://planet.openstreetmap.org (11.12.2020).
194 Journal of Digital Landscape Architecture · 6-2021

OUAKNINE, A. (2019), Review of deep learning algorithms for image semantic segmentation.
 Medium 2018. https://medium.com/@arthur_ouaknine/review-of-deep-learningalgo-
 rithms-for-image-semantic-segmentation-509a600f7b57 (11.12.2020).
SALLY, C. (2014), The Munsell Color System: A scientific compromise from the world of
 art. Studies in History and Philosophy of Science, 47, 26-41.
WANG, G. & LU, X. (2020), How was the color harmony thought be positioned and applied
 in Japan’s landscape color planning. Urban Plan Int, 1-15.
WUHAN NATURAL RESOURCES AND PLANNING BUREAU (2015), Regulations on the usage of
 building colors and materials in the main urban area of Wuhan.
 http://gtghj.wuhan.gov.cn/hs/pc-769-86300.html (11.12.2020).
XU, Z.P. & ZHENG, X. (2020), Roadmap of moving urban colour toward cultural sustainabil-
 ity in China. Color Research & Application, 1-18.
YU, F. K. V. & FUNKHOUSER, T. (2017), Dilated Residual Networks. In Proceedings of the
 IEEE conference on computer vision and pattern recognition, 472-480.
ZHANG, W., YANG, M. Q. & ZHOU, Y. X. (2020), Assessing Urban Park Open Space by
 Semantic Segmentation of Geo-tagged Panoramic Images. Journal of Digital Landscape
 Architecture, 5-2020, 339-351.
You can also read