Technical Measurement Investigations of an Office Building Characterised by Low Energy Use and High Thermal Comfort
←
→
Page content transcription
If your browser does not render page correctly, please read the page content below
Technical Measurement Investigations of an Office Building
    Characterised by Low Energy Use and High Thermal Comfort
Gerd Hauser, Univ.-Prof. Dr.-Ing.
Director of the Fraunhofer Institute for Building Physics
Full professor of Munich Technical University; Department of Civil Engineering and Surveying
Nobelstrasse 12
D-70569 Stuttgart
email: hauser@ibp.fraunhofer.de;
www.ibp.fraunhofer.de

Jan Kaiser, Dipl.-Ing.
Fraunhofer Institute for Building Physics, Project Group Kassel
Gottschalkstrasse 28a
D-34127 Kassel, Germany
email: jan.kaiser@ibp.fraunhofer.de

Dietrich Schmidt, Tekn. Dr.
Fraunhofer Institute for Building Physics, Project Group Kassel
Gottschalkstrasse 28a
D-34127 Kassel, Germany
email: dietrich.schmidt@ibp.fraunhofer.de

KEYWORDS: energy efficiency, comfort.

SUMMARY: Technical measurement investigations of an office building with an extremely low energy use for
heating and high thermal comfort. The building of the Centre for Sustainable Buildings in Kassel was
established in 2000. The detailed monitoring within the framework of the SOLAROPT research programme
covered the years 2002 and 2003.The building is the extension of an old factory; this required certain
architectural necessities. From the planning stage to the construction of the building, special consideration was
given to aspects of building physics; thus, excellent thermal properties could be achieved, which were recorded
by technical measurements.
Energy Consumption: In 2003, the energy use for heating the building amounted to 24.7 kWh/m²a in 2003, thus
falling considerably below usual values.
Consumption of Electricity :The overall consumption of electricity in the year of 2003 was about 18.4 kWh/m²a,
whereas a current consumption for artificial lighting of 3.5 kWh/m²a was recorded.
Daylight: In case of cloudy sky the daylight coefficients in office rooms are about 9 % near windows, decreasing
to 1.7 % in the area of the back wall of the room. Through the external shading device, which is in some rooms
subdivided and thus allowing variable adjustment of the slats, the intensity modulation of light in the rooms may
be customised to user requirements. This is also proven by the low consumption of electricity for artificial light.
Thermal comfort: Even in the extremely hot summer of 2003, excess temperature degree hours of 4.5 to
529.9 Kh/a maximum could be determined. In most of the rooms, temperatures of 27 °C were never exceeded.
Detailed measuring data on the load performance of the heating systems, temperatures during the heating
period and under mid-summer boundary conditions, air quality parameters and air change rates, illumination
and temperature on the surfaces of the building elements as well as in building components, especially in the
field of thermally activated systems, are presented.

.
1. Introduction
In the office building of the Centre for Sustainable Buildings at Kassel, also hosting educational institutions and
laboratories, measurements regarding
    • Energy consumption
    • Thermal comfort in winter and summer periods
    • Daylighting and
    • Air quality
were performed and analysed for a time period of two years. Essential results will be presented in the following;
further details are given in [1] Hauser G., Kaiser J., Roesler M., and Schmidt D. (2004).
The investigations were performed within the framework of the promotion programme entitled "Energy-
optimisation of Buildings, Subconcept 3 Optimised Solar Buildings with Minimum Energy Demand". With
regard to the energetic quality of the projects funded, requirements to the primary and final energy demand for
heating, building services, and lighting were defined as follows, namely:
        Primary energy demand       < 100 kWh/m²a
        Final energy demand         < 70 kWh/m²a
        Useful energy heating       < 40 kWh/m²a.

Figure 1: The Centre for Sustainable Building;            Figure 2: Vertical section of the building.
left-hand: the Kolben-Seeger Building.

2. Description of the building
As a rampant, open-floor structure with a light gap, the Centre for Sustainable Buildings attaches to the
longitudinal side of an existing building, which hosts institutes of the Faculty of Architecture, Urban and Rural
Planning of Kassel University. Figure 1 shows a view from the southwest, Figure 2 presents a vertical section of
the building. The static construction is a combination of reinforced-concrete floors free of downstands and
circular reinforced-concrete columns. The system is based on a module of 1.35 m, which is extended to a module
of 5.40 m and of 6.75 m, respectively, in the experimental area. Transverse bracing is achieved by the external
gable walls, the end walls of the hall, and an internal wall; longitudinal bracing is ensured by rising internal
walls, one each in the building's front and rear part. Major structural and technical characteristics to achieve the
goals envisaged include:
    •    South orientation of the main façade, with a window/façade ratio of 100 %
    •    Lowest-energy construction with high-quality structural thermal insulation (mean U-value of all
         exterior building components 0.2 W/m2K)
    •    Thermally activated building components for heating and cooling

.
• Passive cooling by employing the base slab as a heat exchanger
• Demand-controlled mechanical ventilation with heat recovery
• Natural ventilation in summer and night time ventilation via the atrium
• Daylight-controlled and occupancy-related supply of artificial lighting
• External, high-efficiency solar shading devices, partially adjustable to various settings.
The costs of the building are compiled in Table 1.
Table 1: Building costs according to DIN 277
Costs: Construction + Services equipment = Building costs
Per net floor area 769 €/m² 300 €/m² 1069 €/m²
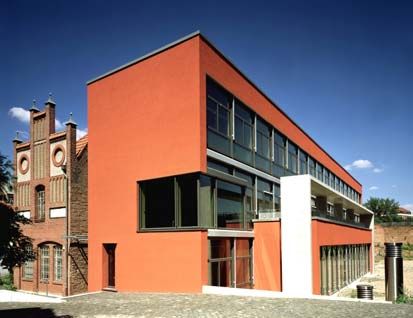
3. Heating energy consumption
The final energy-consumption rates for heating the building (30.7 and 24.7 kWh/m²a for 2002 and 2003, figures
corrected with regard to degree-day numbers) are close to the predicted demand and well below the requirements
specified in the promotion programme. Figure 3 contains the above-mentioned values in comparison to typical
administrative buildings and to the target value prescribed in the promotion programme. The primary energy
consumption amounts to 42 or 31.7 kWh/m²a, respectively, thus remaining clearly below the target value of
100 kWh/m²a that was specified in the promotion programme.
250
final energy
[kWh/(m²a)] heat, adjusted
200
175 electricity
annual energy
building services + lighting
consumption
150 building services
lighting
100
70
50 42
31.7
0
typical office target value ZUB 2002 ZUB 2003
buildings
Figure 3: Specific rates of energy consumption for heating and electricity required for building services and
lighting in 2002 and 2003, compared to values characteristic of typical administrative buildings [1] and to
target values specified in the 'SolarBau'-Programme [2].
4. Consumption of electricity
In both years that were included in the balance, the power consumption in the Centre for Sustainable Buildings
was found to be extraordinarily low. In 2002, the measured specific power consumption totalled 21.6 kWh/m²a
on an annual mean basis. In 2003, this value even decreased to 18.7 kWh/m²a. For both years of operation, the
comparison to energy demand coefficients (as specified in the Swiss standard SIA 83, for instance) produced
very favourable results. The rates of electricity consumption are already rather close to the SIA target value of
17 kWh/m²a and they are clearly below the limiting value. In some sectors, such as lighting and building services
engineering, the target values stipulated in the above standard are significantly higher. Figure 4 presents a com-
pilation of the various sectors of use in comparison to the Swiss SIA directive.
.40 D:\Projekte\PC116Kayak / GrafikEnglisch / fig5-10_elecConsumption
[kWh/m²a] building services
35 34 (ventilation, pumps, actuators...,
3 incl. measurement)
30 9 equipment
annual electricity
lighting
consumption
25
21.6 central server
20 8 3.2 18.7
17
3.9 3.2
15 2
5 6.5 3.5
10 14 7.1
3
5 8
7
0 4.9
target (SIA380) limit (SIA380) ZUB 2002 ZUB 2003
Figure 4: Comparison of the specific annual power-consumption rates to target and limit values following the
Swiss directive SIA 380, for building type 1.
5. Optimised solar façade
In conjunction with a window/façade ratio of 100 % (UF = 0.8 W/m²K, g = 0.42), the main façade's south orient-
ation ensures good exploitation of solar entries. It could be shown, that the specific heat output will be reduced to
almost 50 % under equal outdoor temperatures and high irradiation (average daily global radiation > 90 W / m²).
However, this effect is reduced by the external shading device, which is frequently used in periods of intensive
insolation due to glare phenomena.
6. Heating and cooling with thermally activated building components
During the two-year monitoring period, the operating mode of the thermally activated building elements was
subject to variations. In the first year of reference, the screed system and the reinforced-concrete ceiling system
were run in parallel; in the second heating period, only the screed system was used for heating purposes. It was
not possible to identify an energetic advantage for a particular mode of operation; regarding the quality of
thermal comfort during the heating cycle, no differences were found, either. The maximum output that is avail-
able for each office via the heating system is equal to 80 W/m².
20 D:\Projekte\PC116Kayak / GrafikEnglisch
office 2.06
[kWh/d]
range of global radiation:
15 0-50 W/m²
50-100 W/m²
heating
100-150 W/m²
daily energy consuption for
150-200 W/m²
10 >200 W/m²
5
0
cooling/-
data pool:
02-09-01 to 03-09-01
-5
-10
-10 -5 0 5 10 15 20 25 [°C]30
outside temperature
Figure 5: Daily heat demand of the test office R 2.06 (floor area: 23.3 m2) as a function of the mean outdoor air
temperature and the mean global radiation.
For the cooling case, it was initially intended to switch between the thermal activation of the reinforced concrete
ceiling and the screed. Since heat emission to the ground is independent of the time of day and the screed was
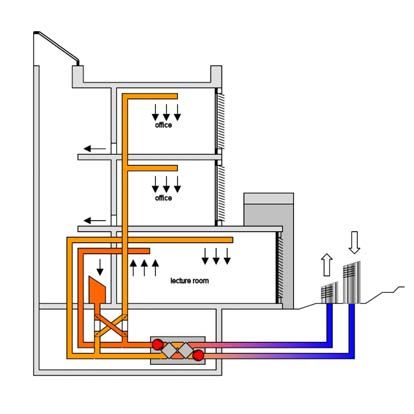
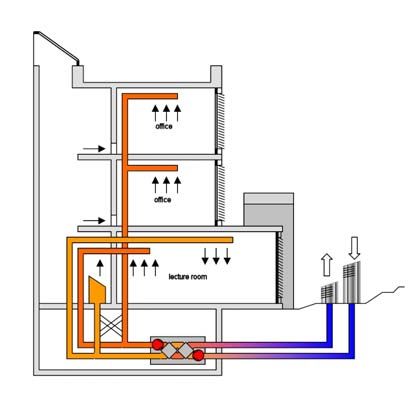
.quicker to respond, only the screed system was used for cooling. The maximum cooling capacity amounts to approximately 40 W/m². Figure 5 represents the heat that was supplied to and extracted from a representative office as a function of the outdoor air temperature and the solar radiation. 7. Mechanical ventilation A ventilation concept was realised in the institute building, which allows both mechanical balanced ventilation (see Figures 6 and 7) and window venting. The central part of the mechanical ventilation system is a volume supply/extract system with heat recovery (via two plate heat exchangers connected in series), which can ventilate the office section only, the office section and the auditorium, or the auditorium, exclusively, depending on demand. The volume flow is regulated by means of speed control, based on the air quality inside the different spaces. The air qualities required for the office section could be ensured at any time by using the mechanical ventilation system. In the fully occupied lecture auditorium, CO2 limiting values could not always be observed. This is due to the limitation of the volume flows to 4000 m³/h, approximately (a compromise between energetic requirements and ventilation intensity), which in practice was found to be no problem. Yet, the assessment of measured mixed-gas concentrations remains difficult. Although the air quality was rated unsatisfactory in some user interviews, the measured reference parameters proved air qualities to be constantly good. The measured degree of heat supply due to heat recovery amounts to approximately 80 %. The share of recovered heat in the overall heating energy demand is 15.5 %. Using speed control and demand-controlled air change, the plant's electric power consumption could be dramatically reduced to about 120 kWh/mon. Prior to introducing demand- responsive controls, the consumption of electricity amounted to 640 kWh/mon, approximately. Figure 6: Mode of operation: exhaust-air operation. Figure 7: Mode of operation: supply-air operation. 8. Window ventilation and night time heat losses During the summer months, the building is ventilated almost exclusively through windows, as it was envisaged. The mechanical ventilation system was only used when the lecture hall was occupied and for flooding the building with fresh air in the early morning hours. In the heating season, windows were hardly opened at all. The effects of intensive nocturnal ventilation to discharge heat on mid-summer days is investigated, considering different ventilation strategies. Good results were achieved for cross-flow ventilation of the spaces; here, the air flows to the outside through the open office doors and windows, through the opened dampers of the smoke and heat-exhaust system (RWA) in the atrium. As a function of the temperature difference between outdoor air and atrium, air changes were measured to be up to 40 times as much (for temperature dependence, see Figure 8 and Figure 9). In the respective spaces, substantial cooling could be achieved during the test period. The use of the lowered shading device as a protection against driving rain has practically no adverse effects regarding the air change. The use of the ventilation system for nighttime ventilation (as a hybrid or as a sole system) was found to .
be unsatisfactory, as the volume flows do not suffice to induce nocturnal heat losses. Likewise, the combination
of open windows, closed office doors, and opened dampers did not meet the expectations regarding the air
change, either. This is due to the relatively high pressure losses in the overflow apertures of the door reveals.
                                   50                                                                       office 2.07
                                                                                                      av wind speed =0.5 m/s
                                 [ACH]                                                                      office 2.07
                                                                                                      av wind speed =0.43 m/s
                                   40                                                                 (with sun shading)
                                                                                                            office 1.07
                                                                                                      av wind speed =0.37 m/s

                                   30
                   airchange

                                   20

                                   10

                                    0
                                         -2        0         2        4        6       8 [°K] 10
                                              temperature difference (atrium/outside)

Figure 8: Time-profile of the indoor-air temperatures during the night of 2nd August to 3rd August, 2002
(shading device lowered).

                                         02-08-01          02-08-02 night ventilation 02-08-03
                                   30                                                              room temperature
                                                                                                        R 1.07 (free flow)
                                  [°C]                                                                  R 2.05 (window ventilation)
                                                                                                        R 2.07 (without ventilation)
                                   26
                                                                                                        outside temperature
                                   24
                   temperature

                                   22
                                   20
                                   18
                                   16
                                   14
                                         18    0       6      12    18     0       6   12 [h] 18

                                                                 time of day

Figure 9: Air change measured in rooms 1.07 and 2.07 as a function of the temperature difference between
staircase and outdoor air. Every point/spot represents the average across 10 min.

9. Lighting
The implemented lighting concept features a high degree of daylight utilisation and the use of daylight-
dependent illuminance control. In this way, the consumption of electricity for artificial lighting could be limited
to 3.5 kWh/m²a on average. Here, the specific consumption of electricity for office illumination accounts for
about one third of the total power consumption due to lighting.
In the office tract of the building, the majority of the work places are daylight-oriented; according to German
standard DIN 5035-2, these workplaces must have a nominal illuminance of 300 lx close to the window area.
The illuminances that were determined for artificial lighting at one of these workplaces range between 300 and
350 lx. Illuminances measured in the depth of the room vary around 200 lx, approximately.

.
10. Use of daylight
When the office daylight coefficients were measured on a day with an overcast sky, they were about 9 % near
windows, continuously decreasing towards the rear side. Daylight coefficients measured in the off-window area
are not lower than1.7 %, thus exceeding by far the requirements specified in German standard DIN 5034-2 (min.
0.9 '% in the depth of the room). Further, it could be shown that the reflectance of the space-enclosing surfaces
has little influence on the daylight coefficient. The greatest impact on the intensity and the distribution of meas-
ured daylight coefficients is due to the position of the shading devices. If slatted blinds are closed completely,
resulting daylight coefficients will be lower than 0.5 % throughout the entire depth of the room. Higher values
may be achieved using a subdivided shading device. The highest values of workplace lighting (about 1.8 %) can
be obtained if slats are closed in the upper part of the device and positioned horizontally in the lower part.
11. Thermal comfort
In addition to specifying high requirements to the building's energy efficiency, special importance was placed
upon thermal comfort during planning. Special attention was given to environmental comfort under summer
conditions; here, it was of particular interest whether the combination of efficient solar shading and passive
cooling by building components would be sufficient to ensure thermally comfortable indoor-air temperatures
despite high mid-summer outdoor air temperatures.
In the winter months, thermally comfortable indoor-air conditions were achieved at any time. With approx-
imately 22 °C, the office air temperature (averaged across all heating periods) is comparatively high. This is due
to the use of solar radiation incident through the glazed south façade. With lower radiation, mean temperatures
are about 21 °C (during occupancy Mon – Fri, 8.00 a.m. – 7.00 p.m.), continuously rising to more than 23 °C as
solar irradiation increases. Here, the position of the manually adjusted external shading device is the main factor
of influence.
Despite the difficult climatic boundary conditions prevailing in the extremely hot summer of 2003, the excess
temperature degree hours (see Hauser G. 1997, and Hauser G. and Otto F. 1997) that were used for evaluating
thermal comfort in the summer months remained in an acceptable margin. Excess temperature degree hours
(Gh26) were determined that range from a minimum of 4.5 Kh/a to a maximum of 529.9 Kh/a. The average is
about 145 Kh/a. The maximum value was found in the experimental area of the second storey. It is due to the
lack of building-component cooling in combination with a permanently open shading device. The comparison of
all other spaces to the reference case thus found affirms the beneficial joint effects of low-performance, passive
building-component cooling and external shading devices. The values found for Gh26 suggest some relationship
between location, occupancy, and technical equipment of the offices. In highly equipped spaces, an increased
risk of overheating is to be expected. The same goes for offices located on the second floor compared to ground-
floor offices.
More detailed measurements in both offices confirm the function of all components to prevent overheating. The
limitation of the air-temperature gradient to 2 K (measured at different heights according to German standard
DIN 1946-2) is observed in both offices even in the mid-summer period. The excess temperature degree hours,
which were calculated for the test rooms acc. to definition using the operative temperature, amount to 129.6 and
331.9 Kh/a. The higher value that results for the space situated on the second storey is due to the short periods of
occupancy and the position of the shading device, which was rarely lowered.
References
[1] Hauser G., Kaiser J., Roesler M., and Schmidt D. (2004). Energy-related optimisation, surveying and
documentation for the demonstration building of the Centre for Sustainable Buildings, Optimised
solar buildings, Subconcept 3 Kassel University, December 2004.
[2] DIN 5035-2 (1996). Interior lighting using artificial light, June 1996
[3] DIN 5034-2 (1985). Daylighting in interior rooms. Fundamentals, February 1985
[4] Hauser G. (1997). ESVO2000 – Proposal of a concept. International Congress of Building Physics,
Building Physics of external walls, Berlin, 1997, p. 11-25
[5] Hauser G. and Otto F. (1997). Effects of increased thermal insulation on thermal comfort in summer.
.Bauphysik 19 (1997), no. 6 .
You can also read