Identification of potential traffic accident hot spots based on accident data and GIS - MATEC Web of Conferences
←
→
Page content transcription
If your browser does not render page correctly, please read the page content below
MATEC Web of Conferences 325, 01005 (2020) https://doi.org/10.1051/matecconf/202032501005
ICTLE 2020

 Identification of potential traffic accident hot spots based on accident data
 and GIS

 Hongge Zhu1,a Yuntong Zhou2 Yanyan Chen3

 1
 Hongge Zhu, China Highway Engineering Consulting Corporation, Beijing University of Technology, China
 2
 Yuntong Zhou, Beijing Engineering Research Center of Urban Transport Operation Guarantee; Beijing University of Technology Beijing,
 China
 3
 Yanyan Chen, Beijing Key Laboratory of Traffic Engineering, Beijing University of Technology, Beijing, China

 Abstract. The problem of road traffic safety has been widely concerned in recent years. The identification of traffic
 accident hot spots can effectively improve the road traffic safety and let the traffic managers formulate targeted
 improvement measures and suggestions. The traditional identification method of accident hot spot does not consider
 the spatial attribute of the accident, so it has some limitations in the identification of traffic accident hot area.
 Therefore, this paper first proposes a method to identify the hot spot of traffic accidents based on geographic
 information system (GIS). The mathematical model and machine learning model are used to explore the correlation
 between traffic accidents and spatial characteristics from macro and micro aspects. Finally, taking Beijing as an
 example, the feasibility of the research method is proved by using the accident data of Beijing in 2015 and the
 geographic information of Beijing. The research results of this paper can realize the spatial effective transformation of
 accident records, comprehensively consider the micro and macro attributes of the accident itself, realize the automatic
 and efficient identification of the accident hot spot. In addition, the causality analysis results between each attribute
 and the distribution of accident hot spots can help decision makers to formulate safety and sustainable road strategies.

 1 Introduction problems related to traffic accidents and geographical
 location, and has the spatial and spatial database
 management function of visual interface.[1][2][3] [4]
 China's traffic safety situation is grim. In recent years, the
 number of traffic accidents in China is increasing year by
 year, and the number of accident deaths ranks first in the The research significance of the text is as follows:
 world. Therefore, it is very important to identify potential
 traffic accident hotspots to ensure safe and smooth travel (1) This paper uses ArcGIS software to study. ArcGIS is
 environment. The traditional traffic accident analysis a complete GIS software system based on industrial
 usually relies on the map, engineering drawing and standards. It has the characteristics of comprehensive
 general information management system which lack of function, good scalability and user-defined flexibility. It
 effective spatial data analysis, which results in not only can combine the traditional traffic accident database with
 the heavy workload of data processing, but also the the visualization and spatial analysis ability of GIS
 analysis results are not comprehensive and accurate, and system, and use the traditional mathematical model
 it is difficult to reveal the internal laws. Therefore, it is algorithm and machine learning algorithm to find out the
 necessary to make full use of the information, technology various attributes hidden behind the traffic accident data.
 and scientific methods to effectively analyze and identify The potential connection of data reveals the hidden
 the dangerous road sections, so as to find out the current regularity.
 dangerous areas of traffic accidents, and take measures
 such as identification, rectification and prevention. The
 occurrence of urban traffic accidents has clear spatial (2) The effective identification of potential accident
 location characteristics, so it is necessary to analyze the hotspots is effective and practical for management
 relationship between traffic accidents and geographical decision-making, reducing traffic accidents and
 location in the process of identifying traffic accident hot improving safety operation management.
 areas. Geographic Information System (GIS) is an
 important technical means to analyze and explore the
 a
 Corresponding author: 2047768025@qq.com

© The Authors, published by EDP Sciences. This is an open access article distributed under the terms of the Creative Commons Attribution
License 4.0 (http://creativecommons.org/licenses/by/4.0/).
MATEC Web of Conferences 325, 01005 (2020) MATEC Web of Conferences https://doi.org/10.1051/matecconf/202032501005
ICTLE 2020

 (3) It provides certain reference for traffic management M = K(K + 1)/2 (4)
 departments to make decisions, which is of great
 significance to reduce the incidence of traffic accidents,
 reduce potential accident risks and improve the 2.2 Random forest (RF)
 effectiveness and practicability of safety operation
 management. RF is one of the most commonly used classifiers
 proposed by Breiman for training and predicting samples.
 Based on bootstrap sampling method, RF algorithm can
 2 Method change the training set and establish decision tree set.
 Because the classification tree is constructed with the
 The purpose of this paper is to find out the relationship guidance of data, and the candidate variable set is a
 between the severity of vehicle accidents and macro and random subset of variables at each split.In this paper, the
 micro factors, and to provide the basis for the Gini index of random forest algorithm is used to analyze
 identification of traffic accident hot areas. the influence of different factors on the severity of traffic
 accidents.[5][6]
 2.1 Binary logic regression
 The Gini index is calculated as follows:
 Based on the accident data, this study uses binary logistic

 regression to establish a model to analyze the impact of GINI(p) = ∑
 =1 (1 − ) = 1 − ∑ =1
 2
 (5)
 different road facilities on the severity of traffic accidents
 from the micro level. In the logistic regression model, the
 Where: K represents K categories, Represents the sample
 results are divided into two parts. The relationship
 weight of class K.
 between probability and events is described by the
 following link function:
 So the characteristics The importance on node m, that is,
 ef(xn ) 1
 the Gini index changes before and after node m
 Pn = = (1) branching are as follows:
 1+ef(xn ) 1+e−f(xn )

 ( )
 Where, Is the probability of occurrence of the event; VIM = − − (6)
 It's a linear function that explains variables.
 Where Gil and Gini index of the two new nodes after
 In logistic regression model, the linear function is related branching respectively
 to the expected value of response, which is composed of
 k independent variables and coefficients
 If the feature If the nodes in decision tree I are in set M,
 then the importance of X in the ith tree is
 f(xn ) = β0 + β1 x1n + β2 x2n + ⋯ + βj xjn + ⋯ +
 βk xkn (2) ( ) ( )
 VIM = ∑m∈M VIM (7)

 Where, Is the xjn vector of the independent variable, and
 Suppose there are n trees in RF, then
 is the corresponding coefficient.
 ( ) ( )
 When there are two or more independent variables in the VIM = ∑ =1 VIM (8)
 experimental study, the effect of one of the independent
 variables on each level of the other is inconsistent. This Finally, all the obtained importance scores are normalized
 phenomenon is called the interaction effect. This study
 takes the first-order interaction effect as the research
 VIM
 object, which is limited to two explanatory variables. VIM = ∑ (9)
 Therefore, the function It can be expressed by the =1 VIM

 following expression:
 The denominator is the sum of all characteristic gains,
 ( ) = 0 + 1 1 + 2 2 + ⋯ + + and the molecule is the Gini index of characteristic J.
 +1 1 2 + ⋯ + ( −1) (3)
 2.3 Spatial analysis method
 Where: K is the number of independent variables; m is
 the number of variables and interaction effects. Compared with the traditional statistical (Poisson) model,
 the spatial location identification of traffic accident

 2
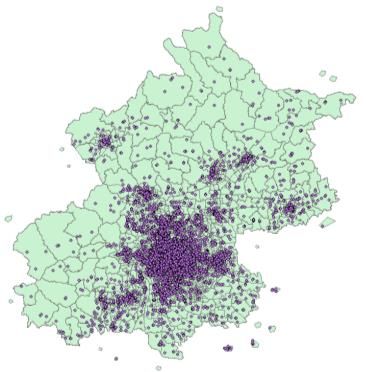
MATEC Web of Conferences 325, 01005 (2020) ICTLE 2020 https://doi.org/10.1051/matecconf/202032501005
ICTLE 2020

 hotspots uses the spatial attributes of accident points. Hot
 spot analysis results of traditional accident prone section
 identification will determine that a single intersection or
 section with high accident rate is a dangerous section,
 while the accident hot area will identify multiple
 continuous single road sections as a hot spot area on the
 basis of considering the spatial autocorrelation of the
 spatial agglomeration of accident points. The traditional
 spatial analysis method (hotspot analysis) of traffic
 accidents may be affected by random factors rather than
 by road environment. Therefore, in order to explore the
 main factors of the distribution of traffic accident hot
 spots, this paper comprehensively considers the following Figure 1. Distribution of Schools.
 two points: (1) the historical location of traffic accidents;
 (2) the spatial attributes of the historical locations of
 traffic accidents.[7] The macro factors of traffic accidents studied in this
 paper are as follows:
 In this paper, the spatial analysis method based on Arc Table 1. Statistical table of macro factors in study area
 GIS software is used to evaluate the potential mutual
 dependence between the attribute values of observation Variable Description Max Min Mean S.D
 The length
 data in a certain analysis range. If the similarity of the
 Length of 123.22 1.58 9.86 14.42
 observed values of each spatial point becomes more TZA(km)
 similar with the reduction of spatial distance, it is spatial Work
 positive correlation, otherwise it is spatial negative Ln Work 9.21 4.61 7.3 0.92
 population
 correlation; if there is no obvious relationship between Resident
 the observed values and spatial relationship, it is spatial Ln Live 9.80 4.80 8.31 0.95
 population
 uncorrelated The dense
 AFC of subway 8.34 0.00 0.27 0.77
 station
 3 Study case The dense
 Bus station of bus 306.55 0.00 24.69 35.30
 station
 Most of the existing studies show that both macroscopic The dense
 and microscopic considerations are conducive to the Bank
 of bank
 81.75 0.00 4.24 8.73
 analysis of traffic accidents. Therefore, this study The dense
 analyzes from two levels.[8] Supermarket of 392.55 0.00 8.95 19.04
 supermarket
 The dense
 The map of Beijing is divided into 2023 traffic areas as Restaurant of 140.12 0.00 10.65 18.57
 analysis units. In addition to using ArcGIS software to restaurant
 obtain the basic information of traffic district such as area, The dense
 edge length and location, this paper also obtains the point Office 68.95 0.00 1.47 4.39
 of office
 of information (POI) data of supermarkets, banks, school The dense
 School 51.03 0.00 2.77 4.38
 supermarkets and office buildings from Google map, and of school
 uses mobile phone signaling data to obtain the Area of
 employment and living conditions of each traffic district. Area 382.05 0.14 8.61 31.46
 TAZ ( )
 Using the spatial analysis tool of ArcGIS software, the The length
 POI data of supermarkets, banks, school supermarkets, of road
 office buildings, the number and density of residents and Road 244.48 0.274 18.326 24659
 inside
 working population in each traffic district are collected TAZs (km)
 and calculated. Figure 1 shows the spatial distribution of
 the relevant POIs in this paper.
 3.1 Introduction to traffic accident data

 In this study, the normal traffic accident data recorded by
 Beijing police in 2015 were extracted.There are three key
 components of the collision data: (1) the location during
 the collision; (2) the collision attributes, including the
 involved vehicles, pedestrians, casualties, road cross-
 section, central isolation facilities, road safety attributes,
 road conditions, road types, road alignment; (3) weather
 conditions and other environments.

 3
MATEC Web of Conferences 325, 01005 (2020) MATEC Web of Conferences https://doi.org/10.1051/matecconf/202032501005
ICTLE 2020

 Among the casualties, there is information about the In addition, road type is very important in micro factors,
 number of casualties and the characteristics of death. In so binary logistic model is used to further analyze road
 2015, except for minor accidents, there were 3982 traffic type, and different symbols are used to indicate the
 accidents in Beijing. The road type information in traffic degree of PR (> | z|): "* *" represents 0.001-0.01, "*"
 accidents is shown in the following table: represents 0.01-0.05, "." represents 0.05-0.1, and "*"
 represents 0.1-1, as shown in Table 2.
 3.2 Analysis of accident influencing factors
 Table 3 shows class IV highways and general urban roads
 and serious pedestrian accidents. In addition, the first-
 The graph shows the order of importance of macro
 class highway and self -built road are also related to the
 factors in Gini coefficient. The top 10 most important
 accident.
 factors include the density of restaurants, the density of
 bus stops, the area and length of TAZ, the density of
 banks, the
 Table 2. Traffic accident data road type statistics

 Variable Description Percent(%)
 1 Expressway 5.07
 2 Level 1 8.04
 3 Level 2 10.12
 4 Level 3 5.7
 5 Level 4 5.5
 6 Others 1.46
 Road type
 7 City Expressway 5.83
 8 General City Road 29.03
 9 Units self-built road 0.6
 10 Public parking lots 0.13
 11 Public square 0.03 Figure 2. Results of Gini coefficient of accident
 12 Other roads 28.5 influencing factors

 resident population, the type of roads, and the density of Table 3. Statistics of influencing factors of road type in binary
 supermarkets. A large number of studies have shown that logic model
 commercial gatherings affect traffic safety. In terms of all
 Std.
 poi densities, restaurants, banks and supermarkets are Variable Estimate
 Error
 z value Pr(>|z|) Sign
 considered to be important features. At the same time, First
 dense bus stops have become an important macro feature class -2.01048 0.79535 -2.528 0.011479 *
 of traffic accidents. In similar studies, there may be more road
 potential risks at bus stops. At present, not all bus stops in Second
 Beijing have guardrails to protect waiting passengers, so class -1.48124 0.76465 -1.937 0.052725 .
 there is a greater risk of traffic accidents.[9] road
 Third
 class -2.1823 0.79753 -2.736 0.006213 **
 Previous studies have discussed a positive correlation road
 between population and traffic accidents. It is confirmed Fourth
 **
 in this paper that more permanent population means more class -4.07199 0.95797 -4.251 2.13E-05
 *
 traffic activities. Therefore, in order to improve road road
 safety, we should pay special attention to the area with General
 **
 relatively dense population, which may become the hot city -2.57305 0.7248 -3.55 0.000385
 *
 spot of traffic accidents.[10] road
 Self-
 built -2.73951 1.2744 -2.15 0.031584 *
 In addition, school density is also an important factor road
 affecting traffic accidents, because schools can attract a Other
 -2.25638 0.73417 -3.073 0.002116 **
 lot of traffic, so the relatively large traffic attraction will roads
 be accompanied by traffic accidents in the suburbs.
 Therefore, it is necessary to study the school density as 3.3 Identification of traffic accident hot area
 an important factor in the identification of traffic accident
 hot spots.

 4
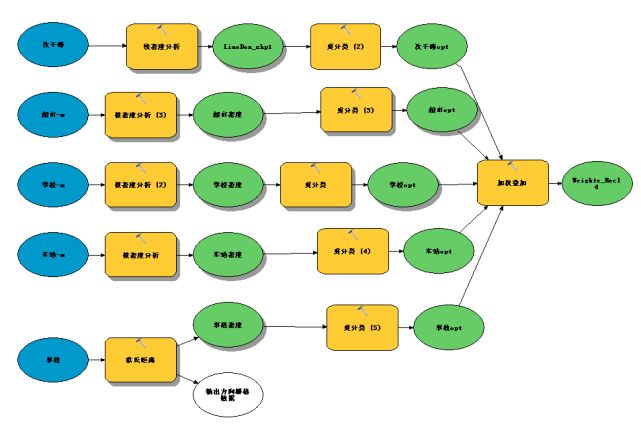
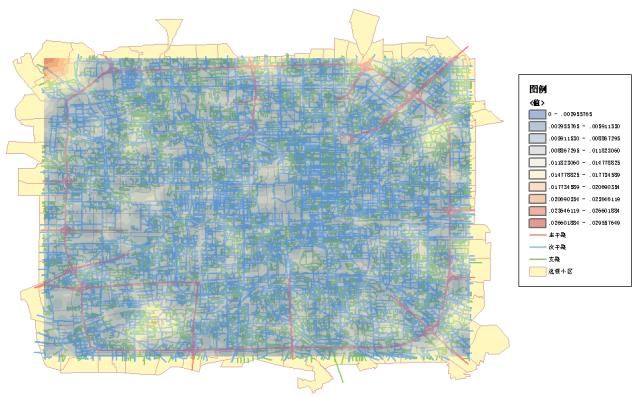
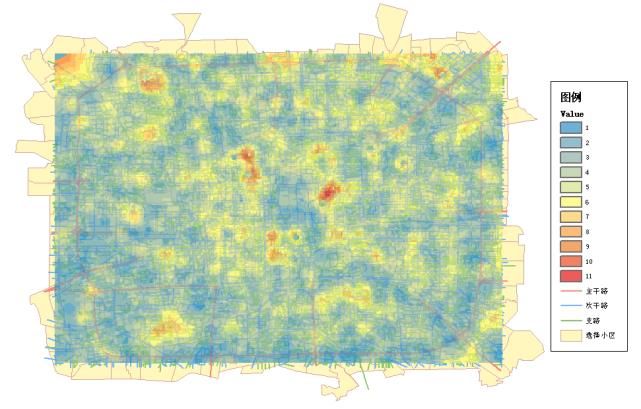
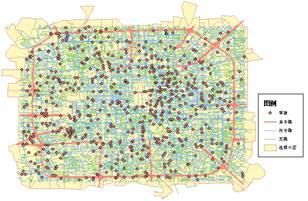
MATEC Web of Conferences 325, 01005 (2020) ICTLE 2020 https://doi.org/10.1051/matecconf/202032501005
ICTLE 2020

 The previous section has analyzed and introduced the The results of hot zone identification are shown in Fig.
 influencing factors of traffic accidents from macro and 5.It can be seen from Figure 5 that the hot spots of traffic
 micro aspects in detail, carried out correlation analysis on accidents are scattered, relatively concentrated in the area
 many related factors, and determined the spatial from the second ring road to the Third Ring Road in the
 characteristics of dangerous road sections. This section urban area of Beijing. Figure 6 shows the nuclear density
 mainly introduces the process of hot zone identification map of traffic accidents. Traffic accidents are distributed
 by using the influencing factors of traffic accidents, so as intensively, and key traffic accident dangerous areas
 to provide strong scientific basis for improving urban cannot be identified.
 traffic safety.
 Table 4. The fixed number and carrying capacity of passengers

 Serial
 factor weight
 number
 Historical accident
 1 30
 location
 2 Road grade 30
 3 Business density 10
 4 School density 10
 Density of bus
 5 20
 stops
 the sum 100

 Compared with figure 5 and Figure 6, it can be seen that
 Figure 3. Traffic accident distribution map of the study the traffic accident hot area in Figure 5 overlaps with the
 area area where the traffic accident is concentrated as shown
 in Figure 6, but there is no great degree of risk
 differentiation. At the same time, if we don't
 This paper selects the inner area of the Fourth Ring Road consider the influence factors of spatial attributes among
 as a case of traffic accident hot area identification for the traffic accident points, almost all the traffic accident
 further analysis. The traffic accident hot zone is points with high accident frequency will be considered as
 composed of a series of continuous road sections with a the accident hot area, which indicates that even the area
 high number of traffic accidents. According to the above with relatively concentrated traffic accident points in the
 analysis of traffic accident influencing factors, the historical data is not necessarily the potential traffic
 historical location of traffic accident, road type, accident hot area. On the contrary, many areas with no
 supermarket density, school density and station density high incidence of traffic accidents in history have the
 are selected as important indicators to identify the hot possibility of becoming high-risk areas of traffic
 area. The specific flow chart of the identification process accidents. Further inspection is needed to eliminate
 is shown in Figure 4.Firstly, the core density tool and potential safety hazards.
 linear density tool of ArcGIS software are used to
 identify the density of POI points, and then the density of
 each POI point is re sorted by the re classification tool in
 ArcGIS software according to the equal interval. The new
 classification categories are 10, and the higher the density,
 the higher the score. Finally, weighted stack is carried out.
 According to the order of Gini coefficient, the weight is
 set as shown in Table 4.

 Figure 5. Identification results of traffic accident hot zones

 Figure 4. Flow chart of Arc GIS identification of accident
 hot zones

 5
MATEC Web of Conferences 325, 01005 (2020) MATEC Web of Conferences https://doi.org/10.1051/matecconf/202032501005
ICTLE 2020

 the hierarchy of the weight setting of each index in the
 weighted analysis, and establish a scientific index system
 to identify the accident hot area.In addition, more factors
 can be considered to further explore the distribution of
 traffic accident hot spots.

 References
 1 Chen Yuefei. Development of identification and
 analysis system for dangerous highway sections based on
 ArcGIS [D]. 2015
 2 Shen feimin. Road traffic safety. Beijing Machine Press,
 Figure 6. Traffic accident distribution map 2007:219-25
 3 Wu xiuxu et al. Application and practice of ArcGis9
 geographic information system [M]. Beijing: Tsinghua
 4 Conclusion University Press, May 6, 2007
 4 Xiong Li. Research on identification of traffic accident
 1) In this paper, considering the attributes of the accident hot area and analysis method of hot area cause based on
 itself and the spatial attributes, the identification method ArcGIS [D]
 of traffic accident hot area is proposed, which is of great 5 Besharati, M. M., Tavakoli Kashani, A., Li, Z.,
 significance to improve road traffic safety and formulate Washington, S., & Prato, C. G. (2020). A bivariate
 targeted improvement measures and suggestions. random effects spatial model of traffic fatalities and
 injuries across Provinces of Iran. Accident Analysis &
 Prevention, 136, 105394. doi:10.1016/j.aap.2019.105394
 2) In this paper, random forest and binary logistic model 6 Ramón Díaz-Uriarte, Sara Alvarez de Andrés. Gene
 are used to identify the macro and micro influencing selection and classification of microarray data using
 factors of traffic accidents. The influence of road random forest[J]. Bmc Bioinformatics, 2006, 7(1):3-0.
 infrastructure, road spatial environment and socio- 7 MOONS E. etal Identifying hazardous road locations:
 economic environment on the distribution of accident hot Hot spots versus hot zones[J]. Trans. Computational
 spots is comprehensively considered. Spatial statistics Science, 2009, 6: 288–300.
 and mathematical statistics are combined to 8 Huang, H., Song, B., Xu, P., Zeng, Q., Lee, J., &
 comprehensively consider the attributes and spatial Abdel-Aty, M. (2016). Macro and micro models for zonal
 attributes of accidents.At the same time, the priority level crash prediction with application in hot zones
 of hot area was set up, which was divided into 10 grades identification. Journal of Transport Geography, 54, 248–
 to rank the severity and risk.In general, in order to ensure 256.doi:10.1016/j.jtrangeo.2016.06.012
 a higher efficiency of investment improvement, priority 9 Noland, R.B., Quddus, M.A., 2005. Congestion and
 can be given to the adjustment and optimization of the safety: a spatial analysis of London.Transport. Res. A 39,
 most dangerous accident hot area. 737–754
 10 Yang K , Yu R , Wang X , et al. How to determine an
 3) In this paper, there are still some deficiencies and areas optimal threshold to classify real-time crash-prone traffic
 that can be further improved in the exploration of traffic conditions?[J]. Accident Analysis & Prevention, 2018,
 accident hot area identification: we can further explore 117(AUG.):250-261.

 6
You can also read


