A Pilot Optimisation of Sulphate Precipitation in the High-Density Sludge Process
←
→
Page content transcription
If your browser does not render page correctly, please read the page content below
A Pilot Optimisation of Sulphate Precipitation
                                              in the High-Density Sludge Process
                                               Bernard Aubé1, Moacir Lamares2, Stéphan Lone Sang3
                                                      Envirobay Inc., Sainte-Anne-de-Bellevue, Québec, Canada
                                                      1

                                                          Sociedade Mineira de Neves-Corvo,S.A., Portugal
                                                          2

                                        3
                                         Wood Environment & Infrastructure Solutions, Montréal, Québec, Canada

                          Abstract
                          High sulphate concentrations can cause issues both in a mine’s process water recycle and
                          for effluent discharge. This is the case for the Neves-Corvo mine in Portugal. A large
                          study looked at control of sulphate and the part presented here details the optimisation
                          of sulphate removal in the high-density sludge (HDS) process. The HDS process was
                          operated at different pH setpoints, varying sludge recycle rates, and several different
                          reactor retention times for three different water sources. An added step in the process
                          was the addition of carbon dioxide to precipitate calcium carbonate and further mini-
                          mise the gypsum saturation level. The tests defined optimal HDS conditions to provide
                          improved feed conditions for nanofiltration or for non-scaling process water.
                          Keywords: Sulphate removal, HDS process, gypsum precipitation, calcium carbonate,
                          nanofiltration, reverse osmosis

                    Introduction                                                      filtration (both nanofiltration and reverse
                    The Neves-Corvo Mine is located in Baixo                          osmosis). These other tests are discussed in a
                    (Lower) Alentejo, on the south edge of the                        separate paper (Aubé et al, 2018).
                    Iberian Pyrite Belt. The nearest town is Cas-                          This paper presents the new and extensive
                    tro Verde, Portugal. It is operated by Somin-                     tests reviewing all aspects of the HDS process
                    cor (Sociedade Mineira de Neves Corvo SA),                        to decrease total dissolved solids in the treat-
                    a subsidiary of Lundin Mining. Neves-Corvo                        ed effluent. The HDS process was operated at
                    is the biggest copper and zinc mine in the                        different pH setpoints, varying sludge recycle
                    European Union and has been in operation                          rates, and several different reactor retention
                    since 1988.                                                       times. This was done for three different water
                        Prior to 2014, the mine had experienced                       sources: 1) acid water, 2) process water in-
                    problems with site water quality, both inter-                     cluding thiosalts, and 3) nanofiltration con-
                    nally and in their final effluent. A project was                  centrate. The results are detailed in the next
                    initiated to evaluate commercially available                      sections for these three types of feed waters.
                    options which could be applied to meet the                             The results of the pilot test were used to
                    water needs, both for effluent discharge to the                   design the full-scale treatment plant with
                    environment and for internal use and con-                         confidence. The process setpoints developed
                    sumption as a process water recycle. Within                       in these tests could be applicable to other
                    this project, a pilot plant study was completed                   mine sites around the world for improved
                    to evaluate the most economic and efficient                       HDS treatment and minimisation of the gyp-
                    process to oxidise thiosalts, precipitate met-                    sum saturation level and total dissolved solids
                    als, and to reduce sulphate concentrations.                       concentration.
                    The base process of the pilot campaign was
                    the conventional HDS process.                                     Materials and Methods
                        In addition to the HDS process, the pilot                     The pilot plant was operated on-site at the
                    test plan included thiosalt oxidation and vari-                   Neves-Corvo Mine continuously from Octo-
                    ous sulphate removal techniques such as bar-                      ber to December 2015. As shown in Figure
                    ium hydroxide precipitation and membrane                          1, the pilot plant was built inside a 40-foot-

                                              Wolkersdorfer, Ch.; Sartz, L.; Weber, A.; Burgess, J.; Tremblay, G. (Editors)       971

14_Piloting of the waste discharge systens.indb 971                                                                               9/3/18 12:51 PM
11th ICARD | IMWA | MWD Conference – “Risk to Opportunity”
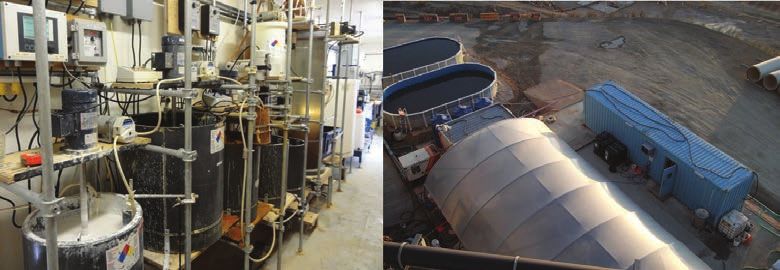
Figure 1: Pilot plant used for the study
long maritime container. The pilot plant was system allowed the pilot plant to run unat-
provided by Wood (formerly Amec Foster tended for short periods of time and to log key
Wheeler). The two pools near the plant were parameters. Reagents, including lime slurry,
used to prepare different feed water qualities hydrogen peroxide, ferric sulphate as catalyst,
expected under future mine operating condi- an anionic flocculant, barium hydroxide and
tions. carbon dioxide, were fed from reagent storage
The pilot plant consisted of a series of en- tanks. Lime feed was controlled by pH and
gineered PVC reactors equipped with baffles other reagent addition rates were controlled
and risers. Agitation was provided using ra- by flow. Air was sparged into reactors when
dial impellers when the reactor was also aer- ferrous oxidation was required, and carbon
ated or axial impellers when there was no gas dioxide was used for calcium carbonate pre-
sparging. The design flowrate of the plant was cipitation.
2 L/min, but it was sometimes operated at 1 Physico-chemical parameters and reagent
L/min for certain tests. A 150-cm high and storage tanks levels were recorded several
50-cm diameter clarifier with a conical bot- times per day. The solids content of the differ-
tom and a rake system was used for solid/ ent reactor slurries and of the clarifier sludge
liquid separation. The pilot plant was also were measured regularly. Filtered samples
equipped with a membrane filtration skid for were taken twice daily from all reactors to
nanofiltration or reverse osmosis. monitor the dissolved concentrations of key
A programmable logic controller (PLC) elements.
SLUDG E LIME
F LOCCULANT
LIME/ SLUDG E
MIX
AIR
RAW WATER
EF F LUENT
R1
R2 CLARIF IER
R3
RECY CLE DISPOSAL
SLUDG E
Figure 2: HDS process
972 Wolkersdorfer, Ch.; Sartz, L.; Weber, A.; Burgess, J.; Tremblay, G. (Editors)
14_Piloting of the waste discharge systens.indb 972 9/3/18 12:52 PM11th ICARD | IMWA | MWD Conference – “Risk to Opportunity”
Description of Processes Acid Water Tests
The central component of the pilot plant was The first water tested was an acid water source
an HDS system that allowed enough flexibil- from the tailings area named Cerro do Lobo
ity to evaluate different retention times, pH (CdL). This acid mine drainage (AMD) con-
setpoints, and sludge recycle flowrates (Fig- tains tailings runoff and residual process wa-
ure 2). The HDS process is well-known and ter from the paste tailings disposal. It is char-
described in detail elsewhere (Aubé and Lee, acterised by a low pH near 2.6 and high Fe
2015). As a summary description of the HDS content averaging 213 mg/L (total). The total
process applied here, high-sulphate water was sulphate content averaged 4,577 mg/L. This
contacted with a mixture of recycled sludge water also contained high Na (983 mg/L), Ca
and lime slurry in a reactor. The quantity of (627 mg/L), and Cl (565 mg/L). The sodium
lime slurry added in the Lime/Sludge Mix chloride content is mostly from the ore. This
Tank was controlled to maintain the pH of salinity significantly affects the equilibrium
the overflow in the first reactor. Neutralisa- saturation level of gypsum in the HDS pro-
tion reactors were added as needed to pro- cess as the activity (or effective concentration)
vide additional retention time. This formed a is decreased for the calcium and sulphate.
slurry consisting of treated water with fresh CdL water was fed to the HDS process
precipitates combined with recycle sludge for treatment at pH 10.0 with reactor reten-
solids. This was then flocculated and fed to a tion times varying from 0.5 to 4.0 hours. The
clarifier for solid-liquid separation. sludge densification was very efficient, with
To meet the site water objectives, addi- the minimum target of 20% solids attained
tional process options were evaluated. Nota- within 2.5 days of operation. The highest
bly, a thiosalt oxidation reactor using Fenton’s sludge density attained was 35% solids, with-
reagent was installed upstream of the HDS out any pumping or viscosity problems. The
for some of the tests. A barium hydroxide re- sludge recycle rate was controlled to maintain
actor was also introduced in the HDS process a target reactor solids content between 30 and
to precipitate sulphate as barium sulphate for 40 g/L. As gypsum tends to form more read-
two of the tests. Nanofiltration and reverse ily onto existing gypsum precipitates, higher
osmosis membranes were tested on the feed reactor solid contents serve to offer more
water upstream of the HDS process and on precipitation sites onto which the dissolved
the HDS effluent. Those distinct process ar- sulphate and calcium can precipitate. How-
rangements resulted in different water quali- ever, the amount of solids to be maintained
ties being evaluated in the HDS section of the in the reactor is limited by the flocculation
process. efficiency. If the reactor solids content is too
Fenton’s reagent is a combination of per- high, the flocculant will not attach to a suffi-
oxide and iron (Rolia, 1984). These tests, as cient fraction of the particles and the clarifier
well as the barium precipitation and mem- overflow will contain a high total suspended
brane filtration tests, are discussed in Aubé et solids (TSS) content. Despite this theory,
al, 2018. even at reactor solid contents as high as 45
g/L, the clarifier overflow turbidity and total
4 6 0 0
Sulphate Concentration (mg/ L)
4 4 0 0
4 2 0 0
4 0 0 0
3 8 0 0
3 6 0 0
3 4 0 0
3 2 0 0
Figure 3 Sulphate concentra-
3 0 0 0
0 ,0 0 ,5 1 ,0 1 ,5 2 ,0 2 ,5 3 ,0 3 ,5 4 ,0 4 ,5 tion versus retention time for
Retention time (hours) CdL waters
Wolkersdorfer, Ch.; Sartz, L.; Weber, A.; Burgess, J.; Tremblay, G. (Editors) 973
14_Piloting of the waste discharge systens.indb 973 9/3/18 12:52 PM11th ICARD | IMWA | MWD Conference – “Risk to Opportunity”
suspended solids content were low, averaging 467 mg/L. Ca, Na and Cl concentrations are
of 4.2 NTU and 10.7 mg/L TSS. In the best respectively 702, 906 and 505 mg/L.
conditions, the TSS was maintained below 4 Fenton’s oxidation (hydrogen peroxide
mg/L. catalysed with ferric sulphate) in the first re-
Figure 3 shows that increasing the reten- actor was used to oxidise thiosalts prior to
tion time up to 4 hours incrementally in- treatment by the HDS process in subsequent
creased gypsum precipitation and sulphate reactors for metals and gypsum precipitation.
removal. It is clear that the higher retention This process is detailed in Aubé et al, 2018.
time improved sulphate removal as even be- Essentially, oxidation with Fenton’s reagent
tween 3 and 4 hours retention time, there was converts the thiosalts (thiosulphates and oth-
an added sulphate removal of 160 mg/L. er polythionates) to sulphate.
The final sulphate concentration attained In the HDS portion, three pH setpoints
at Neves Corvo (3200 mg/L) is high in com- (10.5, 11.0 and 11.5) were tested to evaluate
parison to what is achievable with HDS treat- the effect on sulphate removal. Filtered sam-
ment at other mine sites. This is due to the ples from each reactor were analysed to eval-
very high sodium and chloride concentra- uate the progression of gypsum precipitation
tions of the Neves Corvo waters. This high (Figure 4). This figure shows an increase in
salinity increases the solubility of all other sulphate concentration in the Fenton Reactor,
elements in solution. Despite this compara- despite some gypsum precipitation occur-
tively high final concentration, the data ring simultaneously in this reactor. Complete
clearly indicate that sulphate precipitation as thiosalt oxidation alone would have produced
calcium sulphate (gypsum) is improved with in the order of 800 mg/L of sulphate and the
increased retention time. increase in Fenton’s Reactor was in the order
of 200 mg/L.
Process Water Tests Figure 4 shows two important conclu-
A synthetic water was generated on site to sions from the trials: an increased retention
simulate future operating conditions. The time up to 5 hours clearly shows improved
mixture was composed of 50% CdL water, gypsum precipitation, and a pH setpoint of
30% overflow from the paste tailings thicken- 11 improves sulphate removal over pH 10.5
ers, and 20% mine water. This process water or 11.5. There appears to be only a slight im-
was blended in two 55 m3 pools and fed to provement of sulphate removal beyond the
the pilot plant. The water is characterised by 5-hour retention mark, but this is unclear.
a pH that ranged from 2.7 to 3.3, Fe content During this test, the sludge density gener-
averaging 94 mg/L and sulphate averaging ally varied between 20 to 30% solids. The re-
3692 mg/L. Thiosalt concentrations averaged actor solid contents often exceeded the maxi-
4 1 0 0
pH 1 0 .5
Sulphate Concentration (mg/ L)
3 9 0 0
pH 1 1 .0
3 7 0 0 pH 1 1 .5
3 5 0 0
3 3 0 0
3 1 0 0
2 9 0 0
2 7 0 0
2 5 0 0
Raw Water F enton H DS Reactor H DS Reactor H DS Reactor H DS Reactor Clarifier
F eed Reactor 1 h 5 h 6 h 7 h Ov erflow
Figure 4 Sulphate concentrations throughout the Fenton-HDS process
974 Wolkersdorfer, Ch.; Sartz, L.; Weber, A.; Burgess, J.; Tremblay, G. (Editors)
14_Piloting of the waste discharge systens.indb 974 9/3/18 12:52 PM11th ICARD | IMWA | MWD Conference – “Risk to Opportunity”
mum target of 40 g/L, even going beyond 60 was white and consisted almost entirely of
g/L at times. Despite this, the clarifier over- gypsum. It had reached 20% solids content
flow remained clear and the TSS was main- after only 3 days. Two pH setpoints were op-
tained well below the target with an average erated during this test and it appeared that
of 8.4 mg/L. the final sulphate concentration was approxi-
mately 100 mg/L lower when operating at pH
Nanofiltration Concentrate Tests 11.5 over pH 11.0. It is unclear if the anti-
Nanofiltration tests were conducted to re- scalant had a significant impact, as the final
move sulphate to low levels, meeting strict concentrations attained, though higher than
guidelines of 250 mg/L for discharge (Aubé et for other tests, are also affected by the higher
al, 2018). The results presented here are from salinity of the concentrate. A clear and consis-
a test where the sulphate-rich concentrate is- tent increase in sulphate removal was shown
suing from membrane filtration was treated for increased retention times up to 3 hours,
using HDS. Prior to nanofiltration (using an beyond which only a marginal increase was
NF270 membrane), the process water had measured (67 mg/L).
been treated via Fenton-HDS, as per the pre-
vious section, removing metals and thiosalts. Reducing Calcium Concentration
Therefore, the concentrate treatment in this Gypsum precipitation, the source of scaling
5-hour HDS test was focused specifically on problems, is a function of both sulphate and
sulphate removal. calcium concentrations. In order to provide
The nanofiltration concentrate fed to the an improved water quality for either a mem-
HDS process had an average pH of 4.7 with brane feed or for re-use at the mine, decreas-
sulphate at 4500 mg/L, Ca at 856 mg/L, Na at ing calcium would be a significant benefit.
1000 mg/L and Cl at 462 mg/L. As the water Also, the optimum pH setpoint in the HDS
fed to the nanofiltration membrane had pre- process was defined as pH 11.0, which is
viously been treated by the Fenton-HDS pro- above the maximum water quality objective
cess, the thiosalts and Fe contents were low of 10.0. Trials were conducted using carbon
(37 and 1 mg/L, respectively). A key factor to dioxide sparging in a final reactor with a
consider is that an anti-scalant (SpectraGuard 30-minute retention time, prior to the clari-
250) had been added during the nanofiltra- fier and solid/liquid separation, to see if both
tion tests. As an anti-scalant is designed to pH reduction and some calcium removal
inhibit precipitation, it could affect gypsum could be simultaneously attained.
formation in the HDS process. The target pH for calcite precipitation re-
The sludge produced from this process quires a balance between the amount of car-
5 0 0 0
Sulphate Concentration (mg/ L)
4 5 0 0
4 0 0 0
3 5 0 0
3 0 0 0
0 1 2 3 4 5 6
Retention time (hours)
Figure 5 Treatment of nanofiltration concentrate with respect to retention time
Wolkersdorfer, Ch.; Sartz, L.; Weber, A.; Burgess, J.; Tremblay, G. (Editors) 975
14_Piloting of the waste discharge systens.indb 975 9/3/18 12:52 PM11th ICARD | IMWA | MWD Conference – “Risk to Opportunity”
9 0 0
H DS Reactor
Ca Concentration (mg/ L) 8 5 0
Ca reduction of 8 1 mg/ L CO2 Reactor
8 0 0
7 5 0
7 0 0
Ca reduction
6 5 0 of 1 0 5 mg/ L
6 0 0
5 5 0
5 0 0
pH 9 .5 pH 9 .0
Figure 6: Calcium removal with carbon dioxide sparging
bon dioxide added and the form in which it reactors improved sulphate removal. The tests
is present. Precipitation only occurs with the showed increased sulphate precipitation and
CO32- form, which is predominant at high pH a clear effluent with reactor solid contents of
values. At a pH of 9.0, less than 5% of the total up to 60 g/L.
inorganic carbon is in CO32- form while at pH Sparging carbon dioxide in the process as
9.5, almost 10% is in the desired form. The a final step before the clarifier serves to both
results shown in Figure 6 indicate that both decrease the final effluent pH and reduce the
these pH setpoints decreased Ca concentra- final calcium concentration, thus producing a
tions significantly, with pH of 9.0 showing a treated effluent with lower scaling potential.
slightly better removal with a 105 mg/L dif- A setpoint pH of 9.0 showed better results
ference. than pH 9.5.
Conclusions References
Results of this pilot campaign clearly showed Aubé, B., Lamares, M, Lone Sang, S., 2018 “A Pilot
that sulphate removal through gypsum pre- Comparison of Sulphate Removal Technologies
cipitation improves with retention time. Sig- at Neves Corvo”. Paper presented at the 11th
nificant added precipitation was shown in all ICARD | IMWA | MWD 2018, Pretoria, South
cases for the first 3 hours and marginal im- Africa.
provement beyond 4 hours and up to 7 hours Aubé, B., Lee, D.H., 2015. “The High Density
retention. Sludge (HDS) Process and Sulphate Control”,
For treatment of acidic water, a setpoint Paper presented at ICARD-IMWA 10th Interna-
pH of 11 performed best for sulphate re- tional Conference on Acid Rock Drainage and
moval. When treating a nanofiltration con- International Mine Water Association Annual
centrate, pH 11.5 was slightly better over a Conference, April 21-24, 2015, Santiago, Chile.
setpoint of 11.0. Rolia E., 1984. “Oxidation of Thiosalts with Hy-
The pilot results clearly indicated that drogen Peroxide”, Report CANMET Canada
higher concentrations of gypsum solids in the Centre for Mineral and Energy Technology”.
976 Wolkersdorfer, Ch.; Sartz, L.; Weber, A.; Burgess, J.; Tremblay, G. (Editors)
14_Piloting of the waste discharge systens.indb 976 9/3/18 12:52 PMYou can also read