Mapping of Salt Affected Land of Unnao District in Uttar Pradesh Using Geo-Spatial Techniques - IRJET
←
→
Page content transcription
If your browser does not render page correctly, please read the page content below
International Research Journal of Engineering and Technology (IRJET)                                          e-ISSN: 2395-0056
         Volume: 08 Issue: 06 | June 2021                  www.irjet.net                                              p-ISSN: 2395-0072

 Mapping of Salt Affected Land of Unnao District in Uttar Pradesh Using
                                               Geo-Spatial Techniques

                 Dipali Yadav1, Dr.M.S. Yadav2, Dr.Sudhakar Shukla3, Poonam Varshney4
                 1M.tech   Scholar, Remote Sensing & GIS, Remote Sensing Applications Centre, U.P., India
               2Head    & Scientist, Soil Resources Division, Remote Sensing Applications Centre, U.P., India
              3Head & Scientist, School of Geo-informatics, Remote Sensing Applications Centre, U.P., India
                               4Project Scientist, Remote Sensing Applications Centre, U.P., India

---------------------------------------------------------------------***----------------------------------------------------------------------
Abstract–Soil salinity/sodicity caused by natural or human-                                In this study, Unnao district has been taken
induced processes could be a major environmental hazard.                 as the study area for mapping sodic lands. The salts hold
The worldwide extent of primary salt-affected soils is about             water in the soil at high osmotic potential, which restrict
120 M ha, about 50% of these are in cultivable areas. Almost             easy exchange of water and nutrients with the plant roots.
20% of all irrigated land is salt-affected, and this share tends         Consequently, they slow down the growth and development
to increase although large efforts dedicated to land
                                                                         of plants. As a World Bank aided project is running in the
reclamation. They adversely effects agriculture practices and
soil quality but also have impacts economic conditions of                district since last 15 years to reclaim the sodic area and
farmers. Local names of salt affected soils are Reh, Kallar, and         make the area for cultivation of normal crops. The major
Chopan, Rakar, Thur, Karl etc. The monitoring and mapping of             changes have been reported mainly in terms of sodic land
salt affected land can be done by using the Remote Sensing &             areas, which have been reported to decrease over the years.
GIS technologies as such and use of alternative measures to              Gypsum application is advocated for the reclamation of
minimize the time and cost in reclamation processes. This
                                                                         sodic soils. Recently, the remote sensing technologies have
study helps in treating or reclaiming the mapped salt affected
soil. The treated area will be utilized for agriculture,                 been used increasingly in various domains like climate
gardening and fish rearing by utilizing existing ponds and the           changes, global warming, in order to explain or detect
rest is covered in construction.                                         different phenomena in a rapid manner and covering large
                                                                         areas. Soil salinization is the accumulation of salt in soils,
Key Words: Remote Sensing, Salt Affected Soil, GIS,                      which is considered as an ecological problem that is often
Sodicity, Salinity.                                                      attributed to natural influences (80% in salinized lands),
                                                                         rather than anthropogenic activities. Evaluating the spatial
    1. INTRODUCTION                                                      distribution of salt affected soil becomes so important to
                                                                         suitably manage and preserve the soils for agriculture
Salt affected soils occur both naturally and due to
                                                                         purpose. In recent decades, with the progress of remote
anthropogenic activities which increases accumulation of salts
                                                                         sensing technologies, the prediction of soil salinity and
within the landscape. However, it should be noted at the outset
                                                                         mapping its spatial distribution in large-scales are becoming
that there are two broad classes of salt affected soils. Saline
                                                                         more important and easy. This prediction helps to prevent
soils are those with an elevated concentration of any kind of
                                                                         and minimize the salinity phenomena (Zhang, Wang, &
salt, whereas “sodic” soils are those soils with a high
                                                                         Wang, 2002). The new remote sensing technologies become
proportion of sodium ions relative to other cations in the soil
                                                                         a powerful method to provide global and rich information
or water. A large proportion of land disturbance activities,
                                                                         on the spatio-temporal evolution of surface soil without any
including road construction, occur on sodium-affected soils.
                                                                         direct contact. The present soil salinity problem is related to
Soils with high levels of exchangeable sodium and low levels of
                                                                         time and space, for which traditional methods like field
total Soluble salts are susceptible to clay dispersion which
                                                                         investigation and laboratory analysis are not enough to
leads to sealing, crusting, low permeability, high bulk density
                                                                         monitor this. The aim of this research article is to identify
and low porosity. Sodic soils also tend to have a high soil
                                                                         the salt affected areas.
erodibility due to the susceptibility of these soils to gully and
tunnel erosion. The reclaimed area was utilized for crop
production, fruit production, forestry and fish rearing by
                                                                         2. STUDY AREA
utilizing existing ponds and the rest is covered in building,            Unnao is the head quarter of Unnao district in Uttar Pradesh.
threshing floor, channels, roads, etc.                                   It is situated between Kanpur and Lucknow. Unnao is a big

© 2021, IRJET          |     Impact Factor value: 7.529              |     ISO 9001:2008 Certified Journal                 |   Page 4047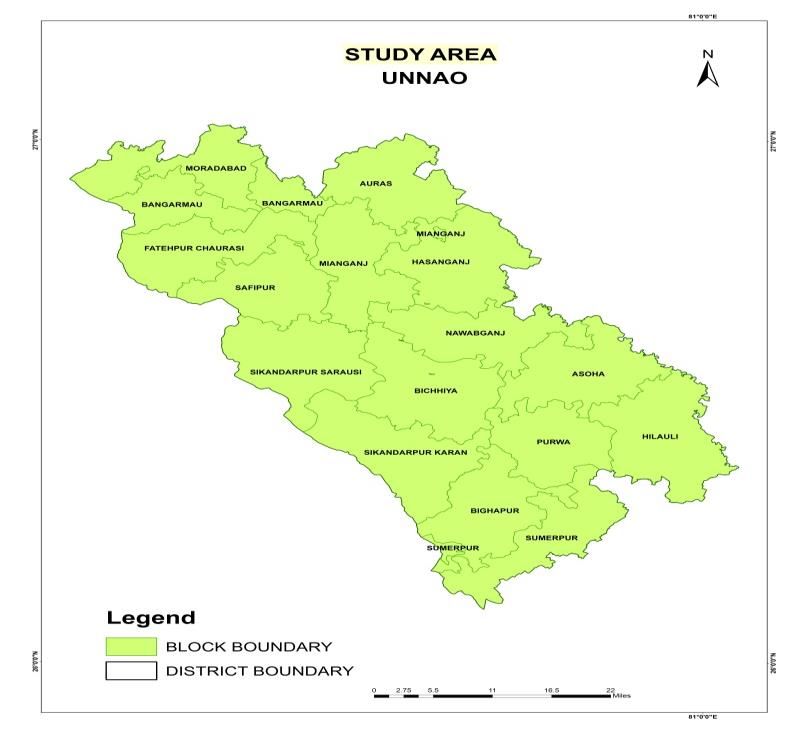
International Research Journal of Engineering and Technology (IRJET) e-ISSN: 2395-0056
Volume: 08 Issue: 06 | June 2021 www.irjet.net p-ISSN: 2395-0072
commercial metropolis with three commercial suburbs round Table -1: Satellite specifications
it. The town is famous for its leather-based, mosquito
internet, zardozi and chemical industries. Unnao is an
Satellite Sensor Path Row Season Year
historical city with many ancient buildings and systems.
Transganga city, a new satellite, town of Unnao is being
developed in order to broaden Unnao as a major commercial
and infrastructural hub because the place comes under
Kanpur-Lucknow counter magnet region. Unnao district is a IRS-1C LISS 100 53 Rabi 2018
part of central Ganges simple of the country covering an area III
of 4558 km2. The metropolis is enlisted as a municipality of
Kanpur metropolitan location and is the second biggest city
inside the metropolitan place. The district is roughly a 4. METHODOLOGY
parallelogram in shape and lies between range 26°8 N & 27°2
N and longitude 80°3 E & 81°3 E. it's miles bounded on the The methodology primarily based on the use of digital image
north by using district Hardoi, at the east with the aid of analysis technique and mapping of Sodic land on satellite data
district Lucknow, on the south with the aid of district Rae
of RESOURCESAT-1 of Unnao region using ARC GIS and ERDAS
Bareli and at the west via the Ganga which separates it from
districts of Kanpur & Fatehpur. IMAGINE.
DOWNLOAD SATELITE DATA OF IRS IRC 1C LISS-III
FROM BHUVAN
GENERATION OF FALSE COLOR COMPOSITE
USING ERDAS IMAGINE
PROCESSING AND INTERPRETATION OF
SATELITE DATA ON ARC GIS 10.2.2
MAPPING OF SALT AFFECTED
FIELD SURVEY AND GROUND TRUTH
STATICS GENERATION
Fig-1: Map of Unnao
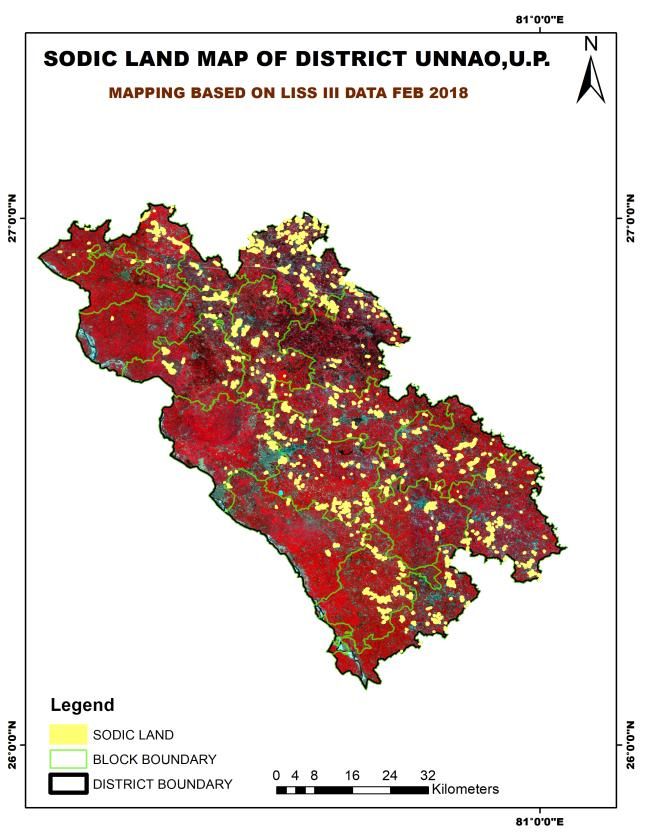
3. DATA AND SOFTWARE USED 5. RESULT & DISCUSSION
(1) IRS 1C LISS III (RESOURCESAT-1) for Feb 2018. The Free satellite images from BHUVAN became widely used in
specifications are shown in Table 1 several domain, According to the produced map of salt
(2) Software: MS Office-Excel (2007), ERDAS IMAGINE, affected land after mapping of satellite data and analysis, it is
ARC GIS 10.2.2 found out that 10778.53 hacters of land is salt affected.
North-eastern portion of Unnao having more salt affected
soil in compare to remaining portion. Blocks like Auras,
Bichiya &Manganj are the regions which are severely
affected by sodicity/salinity. Map of salt affected land of Rabi
© 2021, IRJET | Impact Factor value: 7.529 | ISO 9001:2008 Certified Journal | Page 4048International Research Journal of Engineering and Technology (IRJET) e-ISSN: 2395-0056
Volume: 08 Issue: 06 | June 2021 www.irjet.net p-ISSN: 2395-0072
season 2018 using satellite date of IRC 1C LISS-II shown (0.55–0.77 um) and infrared (0.9–1.3 um) ranges (Csillag,
below. Pasztor, & Biehl, 1993; Khan et al., 2005; Rao et al., 1995).
The higher NDVI values of moderately sodic soils (0.29–
0.52) may be ascribed to higher vegetative cover and also
management interventions at selected locations (Mandal &
Sharma, 2011; Raghuwanshi, Tiwari, Jassal, Raghuwanshi, &
Umat, 2010). The mixed reddish gray to dark gray tone for
sub-surface waterlogged areas indicated scattered crop
cover, and higher moisture content at soil surface.
6. CONCLUSIONS
Satellite data have become valuable tool in studying the
spatial extend of salt affected land and for monitoring the
changes that have taken place over period of time due to
reclamation process. The methodologies can be used to
extract precise and timely information on different aspect of
salt affected land in a cost effective manner on operational
cost. Thus, this proposal can be employed for decision-
making to develop effective plans to reduce or prevent
future increases in soil salinity. Visual and digital analysis of
IRS LISS III multi-spectral data was used for identification
and delineation of sodic soils. Field validation facilitated
development of map legends for accuracy. High values for
spectral reflectance were observed from salty surfaces, and
higher energy absorption in visible and infrared bands
suggested the identification of strongly sodic soils. The
mixed spectral signatures for salt, scattered crop covers
Fig -2: Mapping of salt affected land in Unnao were authenticated by field investigation. Saturation of
Na2CO3 and NaHCO3 salts in soil alkalization and low soil
The digital analysis of remote sensing data revealed mixed productivity. Sodic soils can be reclaimed with suitable
surface properties for salts, soil particles during dry (June) amendments such as gypsum or pyrite.
season and complex spectral signatures of moist soil surface
and moderate crop cover in salt-affected soils (Khan et 7. SUGGESTIONS
al., 2005). The similarity of spectral signatures for village
settlements (muddy roof top) and barren salt-affected soils The remote sensing technologies are now used increasingly
caused spectral confusion during digital analysis. Visual
in numerous domains in order to analyse or detect different
analysis revealed definite shape and sizes of rural
settlements that differs from irregular pattern in salt- phenomena in a rapid manner and covering large areas.
affected soils (Khan et al., 2005). Mixed gray to reddish gray Sodic soils of the Gangetic plain in Central Haryana are rich
and mottled red tones indicated waterlogging in cropped in sodium carbonate and bicarbonate salts and showed high
areas (Mandal & Sharma, 2013), which was authenticated ESP and variable soil texture. Strongly sodic soils (P1 and
during field studies. The linear shape of canals and typical P2) containing high Na2CO3 and NaHCO3 salts, coarse soil
curvilinear meandering rivers differs from stagnant water texture and sodic ground water needs gypsum application @
bodies (waterlogged surface) though these elements showed
8–10 t ha−1 to reduce alkalinity in soil and water followed by
similar spectral reflectance. Irrigated areas with poor quality
ground water showed mixed spectral signatures for poor leaching of excess soluble salts. Moderately sodic soil (P3)
crop stand (light to red tone) and moist soil surface (light to containing soluble Na2CO3 and NaHCO3 salts and fine soil
gray tones). Ground truth studies showed salt enrichment, texture can be reclaimed by addition of 4–6 t ha−1 gypsum.
unfavorable physical properties and poor drainages in soil Due to high clay content and presence of CaCO3 concretions,
profiles (Mandal et al., 2013; Sharma & Mondal, 2006). The P4 (slightly sodic soil) showed drainage restrictions and
low reflectance values of irrigated sodic soils in March data waterlogging. It may be used for growing salt-tolerant rice
(40–60) appeared to be due to surface moisture. Similar
and wheat crops. The addition of farm yard manure in soils
results were reported for carbonate rich salts in visible
and cultivation of Dhaincha (Sesbania sp.) is suggested to
© 2021, IRJET | Impact Factor value: 7.529 | ISO 9001:2008 Certified Journal | Page 4049International Research Journal of Engineering and Technology (IRJET) e-ISSN: 2395-0056
Volume: 08 Issue: 06 | June 2021 www.irjet.net p-ISSN: 2395-0072
improve physical properties, drainage conditions and reduce
waterlogging.
It is a dynamic process and quite often, the socio-
economic and political considerations become extremely
important in increasing extend of salt affected soil. Generally,
such factor is out of control of individual farmers and is call
for the attention of the policy makers. It becomes the
responsibility of respective governments to take
responsibility and make decisions regarding corrective
measures to prevent soil salinization and also to restore the
soils that already affected by salts.
ACKNOWLEDGEMENT
The author thanks Dr. M. S. Yadav, Head & Scientist, soil
resources Division, Remote Sensing and Applications Centre
U.P. for necessary support and guidance to carry out the
work. Sincere thanks are also to Dr. Poonam Varshney for
helping me in doing lots of research and analysis, So that I
came to know a lot of new things.
REFERENCES
[1] Al-Khaier, F. Soil Salinity detection using satellite
remotes sensing. Master’s thesis, International institute
for Geo-information science and earth observation, En-
schede, The Netherlands. 61 pages; 2003.
[2] Arunin, S. (1992) Strategies for Utilizing Salt-affected
Lands in Thailand, Proc. of the int. Symp. on Strategies
for Utilizing Salt- affected Lands, Bangkok, Thailand, Feb.
17-25, 1992, pp:259-268.
[3] Mandal, A. K., & Sharma, R. C. (2010). Delineation and
characterization of waterlogged and salt Affected areas
in IGNP command, Rajasthan for reclamation and
management. Journal of the Indian Society of Soil
Science, 58, 449–454.
[4] Mandal AK, Sharma RC and Singh G (2009) Assessment
of salt affected soils in India using GIS. Geocarto
International 24 (6): 437-456
[5] Pathak H. 1998. Reclamation of saline-alkali soil with
gypsum, pressmud and Zinc Sulphate. Journal of the
Indian Society of Soil Science, 46: 155-157.
[6] Singh, G. B. (2009). Salinity Related Desertification and
Management Strategies: Indian Experience Land
Degradation and Development, 20, 367–385.
[7] Yadav MS, Yadav PPS, Yaduvanshi M, Verma D Singh AN
(2010) Sustainability assessment of sodic land
reclamation using remote sensing and GIS. J. Indian Soc.
Remote Sens. 38: 269-278.
© 2021, IRJET | Impact Factor value: 7.529 | ISO 9001:2008 Certified Journal | Page 4050You can also read