Genetic diversity analysis in Jackfruit selections of Kuttanad region using RAPD technique
←
→
Page content transcription
If your browser does not render page correctly, please read the page content below
International Journal of Scientific and Research Publications, Volume 5, Issue 4, April 2015                                                  1
ISSN 2250-3153

          Genetic diversity analysis in Jackfruit selections of
              Kuttanad region using RAPD technique
                             Anu G. Krishnan, Thushara Susan Sabu, Sible G. V and Lindamol Xavier

                                            Regional Agricultural Research Station, Kerala Agricultural University
                                                               Kumarakom, Kottayam, Kerala

   Abstract- Artocarpus heterophyllus Lam (Jackfruit) which                                    II. MATERIALS AND METHODS
belongs to the Moraceae family , is believed to be indigenous to
the south western rain forest of India. There exists a lot of                         Sample collection
variability among jack trees since most of them are raised from
seedlings. A survey has been conducted in Kuttanad region to                          An extensive survey has been conducted in Kuttanad region to
find out promising jack types during 2010-12 and selected six                         find out promising jack types during 2010-12 and selected six
superior trees based on physico-chemical characters and                               superior trees based on physico-chemical characters and
organoleptic properties. Hence a study was undertaken to realize                      organoleptic properties. All these six genotypes were firm flesh
the genetic relationship among these jackfruit selections during                      types and regular bearing. Sampling and the molecular
2012-2014, using RAPD technique. DNA was isolated from                                characterization was conducted during 2013-2014. Random
young leaves of six A. heterophyllus selections . Out of the thirty                   sampling strategy was followed for collection of leaf samples.
RAPD primers used for the analysis only ten produced maximum                          The leaf samples were collected in sterile plastic covers and
reproducible polymorphic bands (OPA-1, OPA-2, OPA-4,                                  brought to the laboratory in ice buckets. About five healthy and
OPA9, OPC7, OPD19, OPN-05, OPM- 16, OPG-03 and OPG-                                   undamaged young, but fully developed leaves were picked from
10) . The primer OPA-1 gave the maximum number of bands and                           each of the trees. The leaves were washed gently with distilled
OPN-05 produced least. An UPGMA dendrogram was                                        water to remove all surface particles, air dried and placed in
constructed and the statistical analysis was done using                               sterile plastic covers with labels and stored in -80̊◦c .
NTSYSPC-2.02i.                                                                        DNA extraction
                                                                                      The veins of the leaves were removed prior to the isolation. The
   Index Terms- Jackfruit, RAPD , genetic diversity                                   genomic DNA was extracted using the CTAB method slightly
                                                                                      modified after the protocol described by Doyle and Doyle
                                                                                      (1987). A 10% CTAB isolation solution was used for the
                                                                                      extraction. A 250ml CTAB working solution which contained
                            I. INTRODUCTION                                           50ml 10% CTAB, 70ml 5M NaCl, 10ml 0.5M EDTA, 25ml 1M
                                                                                      Tri HCl and 95ml distilled H2 O.About 7ml CTAB isolation
Artocarpus heterophyllus Lam. (Jackfruit) is a member of the                          buffer was preheated to 60°C in a water bath and 0.3% β-
family Moraceae. It is considered to be a native species of the                       mercaptoethanol was added. About 1 gm of the deveined leaf
rainforests of the western Ghats of India . It comprises nearly 60                    tissue was ground well into powder after freezing with liquid
species with jackfruit as the most cultivated one. Jackfruit                          nitrogen. Preheated CTAB isolation buffer was added to the
being an important component of homestead gardens in Kerala ,                         ground tissue and the slurry was transferred to centrifuge tubes.
there exists a lot of variability since most are raised from                          The tubes were incubated at 60°C for 45min with intermittent
seedlings.Different marker systems are currently available for                        shaking. Equal volume of chloroform:isoamyl alcohol (24:1) was
monitoring and assessing genetic diversity. Random amplified                          added to each tube, mixed gently and centrifuged at 7500rpm for
polymorphic DNA (RAPD) markers established by Williams et                             10min at 15°C. The supernatant was transferred to a fresh tube
al. (1990) are DNA fragments from PCR amplification of                                and the centrifugation was repeated 4-5 times using chloroform-
random segments of genomic DNA with a single primer of                                isoamylalcohol. Equal quantity of choloroform: isoamylalcohol
arbitrary nucleotide sequences, which are able to differentiate                       was added again and centrifuged at 7500rpm. The supernatant
between genetically distinct individuals. This technique is                           was transferred to a fresh tube and equal volume phenol:
simple to use, and does not need any sequence information. The                        chloroform (1:1) was added, mixed by inversion and centrifuged
RAPD marker becomes one of the fewer molecular techniques                             at 7500rpm. The resultant supernatant was slightly yellowish in
for assessing genetic variation in Moraceae species ie; in                            color. 600µl chloroform was added to it and centrifuged again at
Jackfruit (Prasad et al 2014, Pushpakumara and Harris 2007), in                       7500rpm and icecold isopropanol (0.6 volume) was added gently
fig (Saleh 2013) and in Mulberry ( Srivastava et al 2004). The                        to the supernatant through the sides of the tube. 1/3rd volume 5M
present work was performed to investigate the genetic diversity                       sodium chloride was also added to the tubes. The DNA was
among the various superior Jackfruit sp of Kuttanad region                            precipitated and kept overnight at 4°C for complete precipitation.
using RAPD.                                                                           The tubes were taken next day, mixed gently and centrifuged at
                                                                                      10000rpm for 5min at -20°C.The supernatant was drained out
                                                                                      and the pellet was washed with 75% ethanol 3-4 times to remove

                                                                                                                                       www.ijsrp.org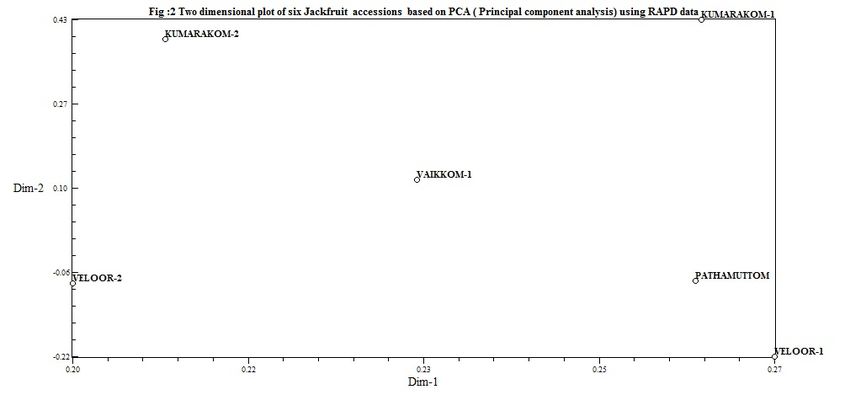
International Journal of Scientific and Research Publications, Volume 5, Issue 4, April 2015                                                  2
ISSN 2250-3153

the final contaminants. 20-25µl Rnase A was added , mixed by                          to get a reproducible profile. The amount of DNA was found to
inversion and incubated for 30min at 37°C. The pellet was air                         be optimum at 4µl (25ng/µl) as the fragments formed were clear.
dried completely and dissolved in 100µl TE buffer. The DNA                            A higher and a lower volume of DNA resulted in a smear effect
samples were stored at -20 °C for further analysis. The final                         or no amplification respectively. The concentration of the DNA
DNA quantity was determined by loading the sample on 0.8%                             isolated from all the samples were checked for their suitability
agarose gel and using Qubit Fluorometer 2.0 (Table 1).                                for amplification using Qubit fluorometer 2.0. The concentration
Primer screening                                                                      of the isolated DNA samples are given in the table 1 . Good
          About thirty primers were initially screened using the                      DNA concentration was obtained for all the samples.
selected varieties to determine the suitability of each primer to
the study. From these screened primers only 10 (OPA-1, OPA-2,                                   Preliminary screening facilitated the selection of
OPA-4, OPA-9, OPC-7, OPD-19, OPG-03, OPG-10, OPN-05,                                  primers producing a higher level of polymorphism and to reject
OPM-16) showed high polymorphism and were used for the                                primers with informations not enough for the analysis. The
characterization of the six genotypes .                                               present study proceeds through the random analysis of 30
PCR Amplification                                                                     Operon random ten-base long, single stranded primers. Among
          The DNA amplification was performed by Agilent                              these 10 primers generated amplification products for all the 6
surecycler 8800 using ten arbitrary 10-base RAPD primers                              jack genotypes with maximum numbers of clear-cut
(Table: 2) following the protocol where the reaction mix                              polymorphic bands with minimum smearing. The remaining 20
comprised with 25µl volume of 2.5µl of 1x buffer, 0.175µl of                          primers couldn’t amplify or gave monomorphic bands for our
1.5µM MgCl2, 1µl of 200µM dNTPs, 1.25µl of 1 unit Taq                                 selected genotypes and were omitted for further analysis. The
polymerase, 2µl of 10pmole Primer and 4µl of 25ng/µl of                               primers selected, no. of scorable bands and no. of polymorphic
template DNA. The reaction was performed using the PCR                                bands is given in table no.2. Among the selected 10 primers, the
profile with 1 cycle initial denaturation of 3min at 94°C, 39                         number of bands for each population for a single primer range
cycles of 30 sec at 94°C, 1min at 37°C, 1 min at 72°C and a final                     from about 1-9 bands. The band size ranged approximately
elongation of 15min. After amplification the products were                            from 100bp – 1000bp. The largest band was in the size range of
separated on 2% agarose gel, stained with ethidium bromide. The                       900- 1000bp and the smallest was approximately 100bp. In total
gels were documented with Biorad Geldoc EZ imager.                                    the 10 primers amplified 166 different reproducible bands.
Data Analysis
The amplification products for each DNA sample with primers                                   Out of 166 bands scored, 110 bands (66.27%) were
were considered as polymorphic when they were present in some                         found polymorphic and the rest of the bands (33.73%) were
individual and not in others. The prominent DNA bands were                            monomorphic in nature (Table 2). Saleh (2013) reported
scored visually on the basis of their presence (1) or absence (0)                     moderate polymorphism of 71.59% in Ficus sps (Moraceae).
for all of the samples studied. The sizes of fragments (molecular
weight in base pairs) were estimated by using 100-bp ladder                                     One probable reason for the polymorphism exhibited by
marker, which was run along with the amplified products. The                          the jack genotypes would be because the primers used in this
scores obtained using all primers in the RAPD analysis were then                      study had 60-70% GC content. The maximum number of bands
used for constructing a single matrix. The total number of bands,                     per     lane (9) was produced by primer OPA-1(86.66%
polymorphic bands and the percent of polymorphism were                                polymorphism) and minimum (1) was for OPN-05.The average
calculated. The Polymorphism information content (PIC) values                         number of bands per primer was 16.6 and average numbers of
for each RAPD primer was calculated using the formula PIC =                           polymorphic bands per primer was found to be 11.0. All such
2fi(1-2fi) (Powell et al 1996). Jaccard’s similarity coefficient was                  polymorphic bands were considered to be potential source of
used to generate pairwise similarity matrices (Jaccard 1908)using                     markers for estimation of genetic diversity of A.heterophyllus .
the SIMQUAL format of NTSYS-pc version 2.02i (Rohlf                                   The agarose gel profiles (2%) of amplified products obtained by
2002).Based on the similarity matrix a dendrogram was                                 all the 10 primers used for the amplification of 6 jack genotypes
constructed using UPGMA with the SAHN module of NTSYS-                                was done. The primer OPA1 gave 4-9 bands per lane while
pc (Sneath and Sokal 1973). A two dimensional plot of six                             OPA2 gave 3-7 bands per lane. OPA-4 gave a maximum of 6
accessions of the Jackfruit was obtained using EIGEN procedure                        bands and a minimum of 3 per lane. OPA9 also gave 3-7 bands
in the NTSYSpc version 2.02i.                                                         per lane. OPC7 had a maximum of 7 bands and a minimum of 3.
  III. RESULTS AND DISCUSSION                                                         OPD19 gave a 5-7 bands while OPG03 ,OPG10 and OPN05
Tender leaf samples were used for the isolation of DNA because                        gave 2-3 bands and OPM16 with 4-6 bands. Prasad et al (2014)
mature leaves were not useful as they were rich in phenols and                        has reported the primers OPA 9 (25 bands) and OPA 8(32 bands)
polysaccharides. The protocol used resulted in dull white                             gave the highest polymorphic bands in Jackfruit. The PIC value
translucent DNA pellets, which were easily dissolved in TE                            was significantly good ranging from 0.222(OPA9 and OPM16)
buffer, if the purification process was not proper the pellet                         to 0.250 (OPA-1) with an average value of 0.239 proving the
resulted in slight yellowish color. The DNA purified using the                        usefulness of RAPD primers in detecting polymorphism across
protocol was homogenous and did not degrade. It was also                              the selected accessions. A study conducted in the analysis of
amplifiable using Taq DNA polymerase. This pellet when ran on                         apricot genotypes using RAPD primers showed that the PIC
0.8% agarose for checking the presence of DNA, bands were not                         value ranges from 0.08 to 0.5 with an average of 0.33 (Mir et al
seen as the polyphenols might have suppressed the precipitation                       2012).
of DNA. The components for the amplification was varied so as

                                                                                                                                       www.ijsrp.org
International Journal of Scientific and Research Publications, Volume 5, Issue 4, April 2015 3
ISSN 2250-3153
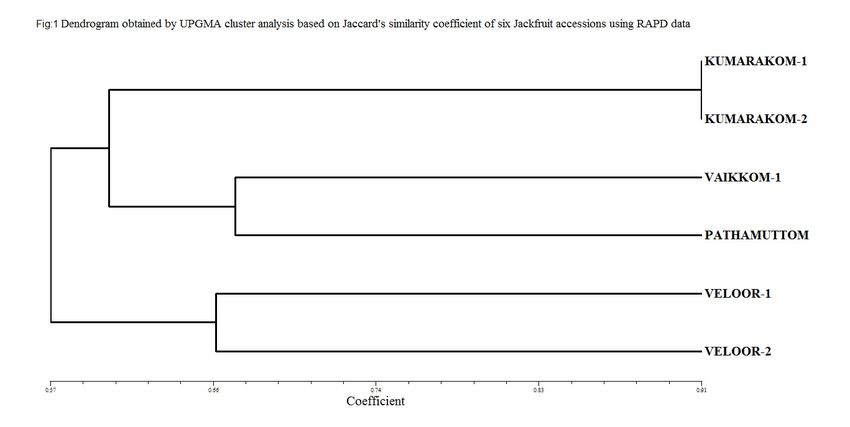
A dendrogram was constructed using the binary data of in apricot (Prunus armeniaca L.) germplasms using RAPD
RAPD primers based on UPGMA clustering and showed four markers. Vol 11. Indian Journal of Biotechnology. 2012 , pp
major clusters, which followed geographical separation (Fig: 1). 187-190
Kumarakom-1 (SP1) and Kumarakom-2 (SP6) represented the
1st cluster, Pathamuttom (SP2) and Vaikkom-1 (SP3) represents J.G.K Williams, A.R Kubelik , K.J Livak, J.A Rafalski, S.V.
two separate clusters and the last cluster was represented with Tingey ,DNA Polymorphisms amplified by arbitrary primers are
Veloor-1 (SP4) and Veloor-2(SP5) .The pairwise similarity useful as genetic markers. In Nucleic Acids Research, vol. 18, no.
matrix values using Jaccard’s similarity coefficient (Table 3) 22, 1990, pp. 653l‒6535.
between genotypes ranged from 0.48 to 1.00. The highest level
of genetic similarity(0.91) was noticed between Kumarakom-1 J.J. Doyle , J.L. Doyle, A rapid DNA isolation procedure for
and Kumarakom- 2 accessions and the least (0.53) was observed small quantities of fresh leaf tissue. In Phytochemical Bulletin,
between Veloor-1 and Veloor-2. The accessions Vaikkom-1 and vol. 19, 1987, pp. 1 1–15.
Pathamuttom showed a genetic similarity of 0.67.The results of
PCA analysis were comparable to the cluster analysis (Fig:2). M. P Prasad, Kirti Prasad, M. Ceera, Phytochemical, antioxidant
This clearly shows that significant genetic exists among these activity and determination of genetic diversity in Artocarpus
Jack selections. The high genetic diversity present among these heterophyllus using RAPD molecular markers. Vol 3. (10)
cultivars clearly suggests that they must have originated from 2014,International Journal of Science and Research (IJSR) ISSN
genetically divergent parents. (Online): 2319-7064
IV.CONCLUSION Marcela Díaz-Matallana, Ingrid Schuler-García, Manuel Ruiz-
García, Elizabeth Hodson de Jaramillo, “Analysis of diversity
The present study has revealed the genetic diversity in the six among six populations of Colombian mango(Mangifera indica L.
local Jackfruit genotypes using RAPD which were found cvar. Hilacha) using RAPDs markers”, Electronic Journal of
superior on the basis of organoleptic and other physico- Biotechnology Vol.12 No.3, 2009, ISSN: 0717-3458
chemical characters. The powerful capability of molecular
technique to distinguish closely related cultivars based on their P Jaccard ,Nouvellesrecherchessur la distribution florale. Bull
RAPD patterns has been brought out by this study. A similar Soc Vaud Sci Nat 44,1908, pp 223–270
study on the genetic diversity of six populations of Colombian
mango was done by Marcella Diaz et al (2009).Characterization P.H.A. Sneath, R.R. Sokal Numerical taxonomy: the principles
of diversity is a necessary requirement for the improvement, use and practice of numerical classification. W.H.Freeman &
and conservation of plant genetic resources (Krishna and Singh, Company, San Francisco, 1973, p 573
2007).Being horticulturally superior and genetically distinct, the
Jackfruit cultivars are conserved in the RARS farm and are used Prem P Srivasatava, Kunjipillai Vijayan, Aravind K Aswathi,
for the multiplication and commercial exploitation. ,Beera Saratchandra, Genetic analysis of Morus alba through
RAPD and ISSR markers . Indian Journal Of Biotechnology.
vol 3, 2004, pp 524-532
V. REFERENCES
W . Powell, M. Morganate, C .Andre, M. Hanafey, J. Vogel , S
.Tingey, A. Rafalski, The comparison of RFLP RAPD AFLP and
D.K.N.G. Pushpakumara, S.A. Harris, Potential of RAPD SSR markers for germplasm analysis. Mol. Breed. 2, 1996, pp
markers for identification of fruit types of Artocarpus 225-238
heterophyllus Lam. (jackfruit) J. Natn ScL Foundation Sri Lanka AUTHORS
35(3),2007, pp 175-179
First Author – Anu G. Krishnan, Ph.D (Hort), Kerala
Agricultural university, dranugk@gmail.com
F.J. Rohlf NTSYS-pc: numerical taxonomy system ver. 2.1.
Second Author – Thushara Susan Sabu. M.Phil
Exeter Publishing Ltd, Setauket ,2002.
(Biotech), susanthushara@gmail.com
Third Author – Sible G.V, Ph.D, Kerala Agricultural
H. Krishna, S.K. Singh, Biotechnological advances in mango
university, siblegv@gmail.com
(Mangifera indica L.) and their future implication in crop
Fouth Author – Lindamol Xavier (student)
improvement: a review, Biotechnology Advances.; vol. 25, no. 3,
2007, p. 223-243.
Correspondence author- Anu G. Krishnan, Ph.D (Hort), Kerala
Agricultural university, dranugk@gmail.com, +919447467714
J. I . Mir, N Ahmed, Rizwan Rashid, Shabir H Wani, M .A.
Sheikh, H. Mir, I. Parveen and S. Shah Genetic diversity analysis
www.ijsrp.orgInternational Journal of Scientific and Research Publications, Volume 5, Issue 4, April 2015 4
ISSN 2250-3153
APPENDIX
Table 1: Concentration of the DNA samples isolated from the 6 Jackfruit genotypes (Qubit fluorometer 2.0)
No. Sample ID Concentration of
DNA at 260nm
(ng/ml)
1 Kumarakom 1 60
2 Kumarakom 2 58.1
3 Pathamuttom 60.2
4 Vaikkom 1 63.4
5 Veloor 1 59.8
6 Veloor 2 68.1
Table 2: Details of bands by 10 random primers in 6 Jack genotypes
Primers Sequence(5’-3’) Total Number Numbe % of
Number of of r of poly PIC
fragments monomo polym mor
scored rphic loci orphic phis
loci m
OPA1 CAGGCCCTTC 15 2 13 86.6 0.25
6 0
OPA2 TGCCGAGCTG 16 5 11 68.7 0.24
5 8
OPA4 AATCGGGCTG 20 6 14 70.0 0.22
0 2
OPA9 GGGTAAACGC 13 4 9 69.2 0.24
C 3 5
OPC7 GTCCCGACGA 16 6 10 62.5 0.24
0 8
OPD19 CTGGGGACTT 13 4 9 69.2 0.24
3 5
OPG03 GAGCCCTCCA 16 6 10 62.5 0.24
0 8
OPG10 AGGGCCGTCT 19 7 12 63.1 0.23
6 1
OPN05 ACTGAACGCC 18 7 11 61.1 0.24
1 0
OPM16 GTAACCAGCC 20 9 11 55.0 0.22
0 2
TOTAL 166 56 110
Average 16.6 33.73 11.0 0.23
9
% of 66.27
polymorphi
c loci
www.ijsrp.orgInternational Journal of Scientific and Research Publications, Volume 5, Issue 4, April 2015 5
ISSN 2250-3153
www.ijsrp.orgInternational Journal of Scientific and Research Publications, Volume 5, Issue 4, April 2015 6
ISSN 2250-3153
Table 3: Jaccard’s matrix of six Jackfruit accessions using RAPD
KUMARAKOM-1 VELOOR-1 VAIKKOM-1 VELOOR-2 PATHAMUTTOM KUMARAKOM-2
1.0000000
0.4800000 1.0000000
0.6200000 0.5400000 1.0000000
0.5800000 0.6600000 0.5800000 1.0000000
0.5500000 0.6500000 0.6700000 0.6300000 1.0000000
0.9100000 0.5300000 0.6700000 0.6100000 0.5800000 1.0000000
www.ijsrp.orgYou can also read