9TH SCIENTIFIC STATEMENT RECENT IRISH WEATHER EXTREMES AND CLIMATE CHANGE - RAY MCGRATH, ROWAN FEALY AND TOM SHERIDAN
←
→
Page content transcription
If your browser does not render page correctly, please read the page content below
9th Scientific Statement

Recent Irish weather extremes and climate change
     Ray McGrath, Rowan Fealy and Tom Sheridan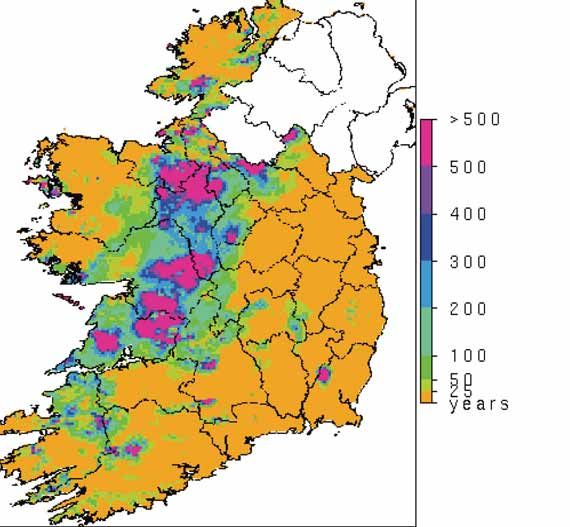
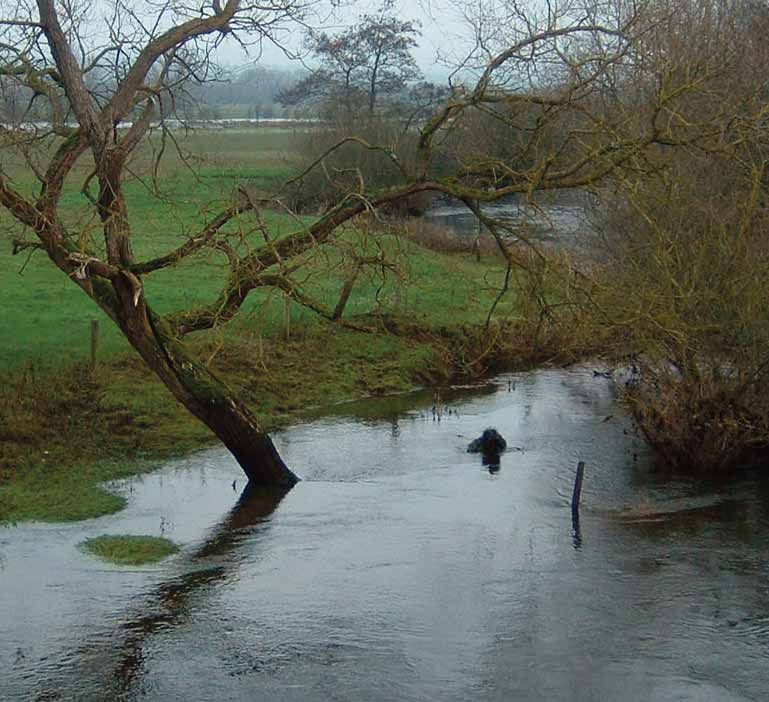
I                                                    November 2009 Floods
          n November 2009 Ireland experi-
          enced unusually wet weather that
          caused widespread flooding. It was              The November floods followed a very wet
     followed by a cold spell from mid-De-                period that began in mid-October and ex-
     cember that culminated in exceptionally              tended through most of November. Persist-
     wintry conditions in the early days of               ent and often heavy rain falling on
     2010. Both events have led to specula-               saturated ground caused widespread flood-
     tion that this is a manifestation of man-            ing, exacerbated in places by changes in
     made climate change, a foretaste of                  land use. Rainfall amounts for the month
     what is to come. Is there any substance              were the highest on record for most of Met
     to this view or are the events explainable           Éireann’s observing stations (more than
     in terms of natural, as opposed to an-               400 in number). Notable statistics for the
     thropogenic (human-induced), variability             month:
     of the Irish climate?
                                                          • 360mm of rainfall fell during the month at
     Climate models suggest that extreme                  Valentia Observatory, the highest reported
     rainfall events, such as occurred in late            value since observations began in the area
     2009, are likely to become more fre-                 in 18661.
     quent in the future, with additional                 • More than twice the average monthly
     changes in the average rainfall. These               rainfall amounts were recorded at almost all
     changes will be projected on the natural             stations.
     variability of the climate system, a funda-          • At some locations the amounts were more
     mental feature that can produce large                than three times the average.
     departures from the average. It is not
     possible to attribute any specific weather           It was also a record-breaking month for
     events to either of these components.                rainfall in the UK due to the same weather
     The November 2009 rainfall was likely                systems.
     to be part of natural variability, supple-
     mented with a small expected increase                Record floods were noted during the month
     in rainfall due to anthropogenic climate             on many river catchments including the
     change.                                              Shannon, the Suck (Co. Galway), the Fer-
                                                          gus (Co. Clare), the Erne, the Bandon (Co.
     Similarly, the 2009/2010 winter cold                 Cork), the Clare (Co. Galway), the
     spell was consistent with the natural cli-           Dunkellin (Co. Galway) and the Laune (Co.
     mate variability displayed in the climate            Kerry), amongst others (OPW, 2009). In
     records.                                             many cases this type of flood event would
                                                          be expected to have a return period2 of
                                                          100 years or more.

             1
              Several weeks later, on 12 January 2010, the Observatory recorded its wettest January day
                                            since records began in the area.
2
    The average recurrence interval over an extended period. For example, a 50-year flood has a 0.02 or 2% chance
                                          of being exceeded in any one year.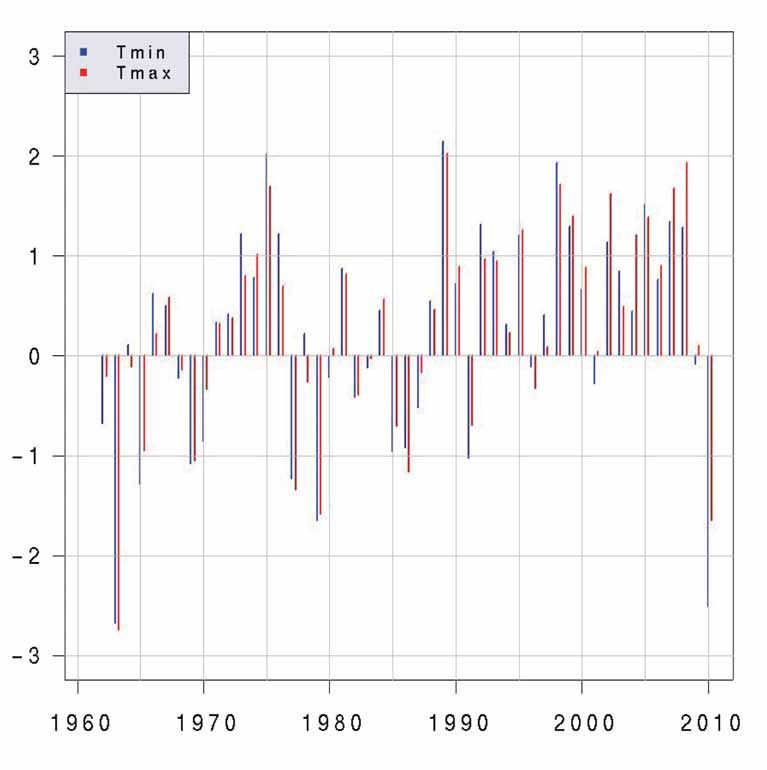
Other notable flooding events have oc-
                                                          Rainfall trends
curred in Ireland in recent years. In July
2008, severe flooding was experienced in
                                                 Trend analysis of rainfall data, particularly
the Newcastlewest area of Co. Limerick
                                                 for extreme events, is notoriously difficult as
and in August of the same year, several
                                                 rainfall displays a high degree of variability,
areas in the east of the country (e.g. Dublin
                                                 both over space and time. Research on this
and North Kildare) experienced significant
                                                 topic (WMO, 2009; Frei and Schär,
flooding. These events have occurred
                                                 2001) suggests that long records (e.g.
against a backdrop of very poor (i.e. wet)
                                                 >100 years) may be required to detect
summers over three consecutive years
                                                 changes in the occurrence of relatively mod-
(2007-2009).
                                                 est extreme events.

Are these events a signal that the climate is
                                                 In Met Éireann, basic trend analysis has
changing? Aside from the scientific interest,
                                                 been performed on a number of high-quality
this is a particularly relevant issue for man-
                                                 rainfall stations. Some stations show an in-
aging potential flood risk which may in-
                                                 crease in the frequency of wet (>10mm) /
volve substantial investment by the State in
                                                 very wet (>20mm) days over the past
flood relief schemes.
                                                 decades but there is large regional variation
                                                 and occasionally conflicting trends from sta-
                                                 tions that are geographically relatively close.

                                                                     FIGURE 1.
                                                                     Return period (years)
                                                                     estimates for 25-day
                                                                     rainfall ending at
                                                                     0900 on 26th
                                                                     November 2009.
                                                                     Note that the analysis
                                                                     is referenced on
                                                                     rainfall data for the
                                                                     period 1941-2004
                                                                     which are assumed to
                                                                     have constant
                                                                     statistical properties.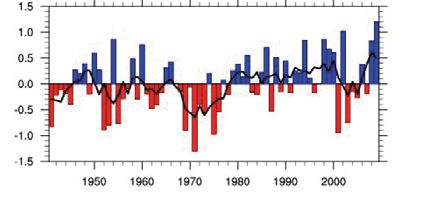
A major study (Fitzgerald, 2007) of Irish rain-      The cold spell, which started in December
fall, based on data from 1941 to 2004,               and ran into January 2010, was particu-
provides a statistical framework for calculat-       larly severe. It was the coldest December
ing return periods of specified rainfall             for 28 years over most of the country and
amounts for any station in Ireland. Applied          the coldest of any month since February
to the November 2009 rainfall (Figure 1), it         1986 at a few stations. Air and ground
indicates that, at some sites, the return pe-        frost were locally severe during the second
riod for the observed rainfall exceeds 500           half of December, particularly around the
years (i.e. probability of occurring in any          Christmas period when Mullingar meas-
year is less than 1 in 500). However, such           ured its lowest December air temperature
extreme figures may not be reliable. Never-          for many years (-10.0°C). In general, tem-
theless, the results suggest that the rainfall ex-   peratures for the month were 2 to 3 de-
perienced in November 2009 was indeed                grees below normal. The cold spell
extreme. A more complete description and             continued into the first 10 days of January
analysis of the rainfall for this period can be      2010; in most areas it was the coldest Jan-
found in Walsh (2010).                               uary since 1985, but in the Dublin area, it
                                                     was the coldest since 1963.
Technical analysis of the 1941-2009 rain-
fall data, detailed in the Appendix, shows
that while there is evidence of a shift to in-
creased annual precipitation amounts since
                                                        The cold spell in
the mid 1970s, there is no evidence of a              historical perspective
trend in the November rainfall in recent
years, although the 2009 event does stand            We can characterise the recent cold spell
out as extreme.                                      using measures that include the intensity and
                                                     duration of the cold, and the quantity and
                                                     persistence of the snow. The 2009-2010
The recent cold spell                                spell was noteworthy for the former rather
                                                     than for any particularly large quantities of
Over the winter months of 2009/2010,                 snow. It was the most extreme since 1963,
cold polar air moved southwards towards              generally comparable in severity with cold
the lower latitudes resulting in below aver-         spells in 1946/1947, 1962/1963,
age temperatures being recorded through-             1978/1979 and 1981/1982.
out much of Europe and above average
temperatures at more northern latitudes. This        In summary, it was exceptionally cold, but
particular situation is associated with a            not unprecedented in the recent past: the
phenomenon called the Arctic Oscillation             1946/1947 and 1962/1963 winters, for
and results from a reversal in the normal            example, were more extreme. Such cold
pressure distribution for the region.                spells may be described as recurring over
                                                     a time scale of decades.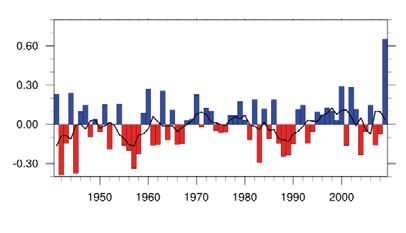
This is confirmed in Figure 2 which shows the temperature anomalies (differences relative to the
 baseline period), based on gridded observational data averaged over land areas for the
 period 1961-2010. Note that the averaging of temperatures over the three winter months does
 not capture the severity of short-period cold spells such as occurred in January 1982.

                                         F I G U R E 2:
Maximum (red) and minimum (blue) temperature anomalies (Celsius) 1961-2010. The data are based on
      average values for the winter season (December, January, February) derived from gridded
                  observational data i.e. representative of the country as a whole.
pogenically driven climate change. More
research is needed in this area to evaluate
Link with global the contributions from natural variability and
warming? anthropogenic influences; planned climate
simulations by Met Éireann and ICHEC (the
Climate models suggest that short duration Irish Centre for High-End Computing) with
extreme events will become more frequent the EC-Earth model (Hazeleger et al.,
in the future and that we will have wetter 2010) will shed further light on these issues
winters and drier summers in Ireland. For for the Irish climate.
example, the average forecast from the EN-
SEMBLES project (van der Linden and The recent cold spell may appear to be at
Mitchell, 2009), based on 12 climate sim- odds with global warming. However,
ulations, is for an increase in the late au- while January 2010 was cooler than nor-
tumn (November) rainfall over Ireland of mal not just over Ireland but over much of
about 8% in the period 2021-2050, rising Europe, on a global scale the month was
to about 15% in the period 2071-2100 the fourth warmest January on record since
(both figures relative to the reference climate 18803. The planet continues to warm.
period of 1961-1990). However, com-
pared with the expected temperature The climate forecasts from the ENSEMBLES
changes, there is less confidence in future project, based on 12 climate simulations,
projections of rainfall and this is reflected suggest an increase in the minimum winter
in a rather large spread, particularly at re- temperatures over Ireland of about 1°C in
gional level, between the individual simu- the period 2021-2050, rising to about
lation forecasts. Note that these are 2.5°C in the period 2071-2100 (relative
forecasts concerning the climate over sev- to the reference climate period of 1961-
eral decades and that natural climate vari- 1990). The models also suggest that cold
ability, which may occasionally throw up a spells will be less intense and shorter in du-
run of wet summers, will continue to play a ration in the future. However, just as for the
part in the future as in the present. rainfall, these are predictions for average
changes over several decades and they do
Although climate models suggest that not refer to individual events.
events such as the extreme rainfall in No-
vember 2009 are likely to become more The cold spell that Ireland experienced is
frequent in the future (IPCC, 2007; Chapter not inconsistent with climate model projec-
11), this single event neither confirms such tions and is easily explained as a feature of
forecasts nor does it set a benchmark for fu- the natural variability of the climate system
ture rainfall. It is likely to be linked to natural superimposed on an underlying warming
climate variability, combined with a small trend.
expected increase in rainfall due to anthro-
3
See National Climatic Data Center for details
(http://www.ncdc.noaa.gov/sotc/?report=global&year=2010&month=1)Report of the Intergovernmental Panel on
Climate Change [Solomon, S., D. Qin, M.
Manning, Z. Chen, M. Marquis, K.B. Av-
Acknowledgements eryt, M. Tignor and H.L. Miller (eds.)].
Cambridge University Press, Cambridge,
Observations and rainfall maps were sup-
United Kingdom and New York, NY, USA,
plied by Séamus Walsh (Met Éireann); the
996 pp.
EOF analysis and plots in the Appendix
were provided by Shiyu Wang (ICHEC -
Kiely, G., 1999: Climate change in Ireland
the Irish Centre for High-End Computing)
from precipitation and streamflow observa-
through an EPA STRIVE Fellowship pro-
tions. Advances in Water Resources, 23,
gramme.
141-151.
ENSEMBLES data: funded by the EU FP6
OPW, 2009: Flooding in November
Integrated Project ENSEMBLES (Contract
2009. Internal report by OPW Hydrometric
number 505539).
Section.
van der Linden P., and J.F.B. Mitchell (eds.)
References 2009: ENSEMBLES: Climate Change and
its Impacts: Summary of research and re-
Fitzgerald, D., 2007: Estimation of Point sults from the ENSEMBLES project. Met Of-
Rainfall Frequencies. Final Report, Work fice Hadley Centre, FitzRoy Road, Exeter
package 1.2, Flood Studies Update (avail- EX1 3PB, UK. 160pp.
able from Met Éireann as Technical Note
No. 61). von Storch, H., and F.W. Zwiers, 1999:
Statistical Analysis in Climate Research.
Frei, C., and C. Schär, 2001: Detection Cambridge University Press, ISBN 0 521
Probability of Trends in rare Events: Theory 45071 3, 494 pp.
and Application to Heavy Precipitation in
the Alpine Region. J. Climate, 14, 1568- Walsh, S., 2010: Report on Rainfall of
1583. November 2009. Climatological Note
No. 12, Met Éireann.
Hazeleger, W. et al., 2010: EC-Earth: A
Seamless Earth System Prediction Approach WMO, 2009: Guidelines on analysis of
in Action. Bull. Amer. Meteor. Soc. extremes in a changing climate in support
of informed decisions for adaptation. Cli-
IPCC, 2007: Climate Change 2007: The mate Data and Monitoring, WCDMP -
Physical Science Basis. Contribution of No. 72.
Working Group I to the Fourth AssessmentAppendix manner and the monthly anomalies (relative
to the mean of the monthly values for the
period) are analysed using the EOF tech-
Further insight can be gained by looking at
nique. Figure 3 shows the time variation of
trends in the rainfall patterns using an Em-
the PC for the dominant mode (the spatial
pirical Orthogonal Function (EOF) tech-
pattern is not shown) which accounts for
nique (von Storch and Zwiers, 1999). The
71% of the total variance of the data. It
central idea behind the method is to reduce
shows that there is no evidence of a trend
the complexity while retaining as much as
in the pattern in recent years although it
possible of the variation present in the
does highlight the exceptional nature of the
data; it effectively describes the data in
2009 event.
terms of products of fixed EOF patterns (or
modes), and time-varying values (Principal
If the focus is shifted to annual rainfall (Fig-
Components – PCs). Most of the variance
ure 4), a similar analysis is suggestive of a
in the original data may be represented by
shift to wetter weather (increasing rainfall)
a small number of modes; occasionally, the
in recent decades with the change point
dominant, or first mode, describes the
around 1978. This is consistent with the
essential features with its PC revealing pos-
findings from a previous study based on
sible significant changes over time.
data from a selected number of stations
(Kiely, 1999).
In this case, the station rainfall data for No-
vember months (1941-2009) are interpo-
lated to a regular fine grid in a consistent
FIGURE 3: FIGURE 4:
Empirical Orthogonal Function (EOF) analysis of As for Figure 3 but for annual rainfall.
November monthly Irish rainfall (1941-2009). The
time evolution of the Principal Component for the first
mode, which accounts for 71% of the variance, is
shown below together with a 5-year running trend
line (black colour). The left hand scale is the relative
amplitude (units: mm, red for negative, blue for
positive values).The last value corresponds to
November 2009.You can also read