JP Morgan 2021 Global High Yield and Leveraged Finance Conference - Virtual - March 2, 2021 - Venator

Page created by Rene Mann
 
CONTINUE READING
JP Morgan 2021 Global High Yield and Leveraged Finance Conference - Virtual - March 2, 2021 - Venator
JP Morgan 2021 Global High
Yield and Leveraged Finance
Conference - Virtual
March 2, 2021
JP Morgan 2021 Global High Yield and Leveraged Finance Conference - Virtual - March 2, 2021 - Venator
Safe Harbor Statement and Other Matters

This presentation includes “forward-looking statements” within the meaning of Section 27A of the U.S. Securities Act of 1933, as amended, and Section 21E of the U.S. Securities
Exchange Act of 1934, as amended. These forward-looking statements include statements concerning our plans, objectives, goals, strategies, future events, future revenue or
performance, capital expenditures, financing needs, plans or intentions relating to acquisitions, business trends and other information that is not historical information. When used in this
presentation, the words “estimates,” “expects,” “anticipates,” “projects,” “plans,” “intends,” “believes,” “forecasts,” or future or conditional verbs, such as “will,” “should,” “could,” or “may,”
and variations of such words or similar expressions are intended to identify forward-looking statements. All forward-looking statements, including, without limitation, management’s
examination of historical operating trends and data, are based upon our current expectations of future events and various assumptions which may not be realized or accurate. Our
expectations, beliefs and projections are expressed in good faith, and we believe there is a reasonable basis for them. However, there can be no assurance that management’s
expectations, beliefs and projections will be achieved. We undertake no obligation to update or revise forward-looking statements which may be made to reflect events or circumstances
that arise after the date made or to reflect the occurrence of unanticipated events.

There are a number of risks and uncertainties that could cause our actual results to differ materially from the forward-looking statements contained in this presentation. Such risks,
uncertainties and other important factors include, among others: the impacts and duration of the global outbreak of the Coronavirus Disease 2019 pandemic on the global economy and
all aspects of our business, including our employees, customers, suppliers, partners, results of operations, financial condition and liquidity, global economic conditions, our ability to
maintain sufficient working capital, our ability to access capital markets on favorable terms, changes to our plans or strategies due to any changes to our Board or management following

any significant change in ownership of our shares, our ability to transfer technology and manufacturing capacity from our Pori, Finland manufacturing facility to other sites in our
manufacturing network, the costs associated with such transfer and the closure of our Pori facility, our ability to realize financial and operational benefits from our business improvement
plans and initiatives, changes in raw material and energy prices, or interruptions in raw materials and energy, industry production capacity and operating rates, the supply demand

balance for our products and that of competing products, pricing pressures, technological developments, legal claims by or against us, changes in government regulations, including
increased manufacturing, labeling and waste disposal regulations and the classification of TiO2 as a carcinogen in the EU, the impacts of increasing climate change regulations,
geopolitical events, cyberattacks and public health crises and other risk factors as discussed in our filings with the US Securities and Exchange Commission, including our Annual Report

on Form 10-K for the year ended December 31, 2020.

This presentation contains financial measures that are not in accordance with generally accepted accounting principles in the U.S. ("GAAP"), including EBITDA, adjusted EBITDA,
adjusted EBITDA margin, free cash flow and net debt and certain ratios and other metrics derived therefrom. We have provided reconciliations of non-GAAP financial measures to the
most directly comparable GAAP financial measures in the Appendix to this presentation.
JP Morgan 2021 Global High Yield and Leveraged Finance Conference - Virtual - March 2, 2021 - Venator
Venator Snapshot
   Leading global chemical company

                                                                                                                                 FY20
                                                                                        Revenue (mm)                            $1,938
                                                                                        Adj. EBITDA (mm)(1)                       $136
                                                                                        % margin(1)                                7%

                                                    Titanium Dioxide                                                                  Performance Additives
Segment

                                                                                                        FY20                                                                                   FY20
                 Revenue (mm)                                                                          $1,431   Revenue (mm)                                                                   $507
                 Adj. EBITDA (mm)(1)                                                                    $127    Adj. EBITDA (mm)(1)                                                              $55
                  % margin(1)                                                                             9%     % margin(1)                                                                    11%
                                                                                                                                                         Ag. &   Other
                                              Fibres & Ag. & Other                                                                               Fibres
                                                                                                                                                        Water            Architectural
                                                       Water 2%                                                                    Personal Care,& films          2%
                            Personal Care, Food, films                                                                                                    4%               coatings
                                                        1%                                                                             Food,       3%
                             Pharma. & Active 6%                        Architectural                                                                                        14%
                                                                          coatings                                                Pharma. & Active
End Markets(2)

                                 Materials
                                    4% Inks                                 27%                                                      Materials                                     Industial
                                           4%                                                                                           6%                                         coatings
                                                                                                                                                                                     11%
                                                                                                                                      Plastics
                                                                                                                                       16%

                                                                          Industial
                                                                          coatings
                                        Plastics                            14%
                                         41%                         Construction                                                                                  Construction
                                                                         1%                                                                                           44%
Representative
 Customers

                 (1)   See Appendix for reconciliations and important explanatory notes
   3             (2)   2020 Revenues
JP Morgan 2021 Global High Yield and Leveraged Finance Conference - Virtual - March 2, 2021 - Venator
Titanium Dioxide
Gradual recovery from COVID-19; Longer-term industry fundamentals remain intact

                                     End Markets                                                                      Quarterly Adjusted EBITDA History(1)                                                                          2020
2020 Revenues                                                 Source: Management Estimates                $ in millions
                                       Ag. &
                                       Water Other
                         Fibres & films 1% 2%                                                                                      31% 31% 32%                                                                                 Segment
      Personal Care, Food, 6%                                                                                                    29%
    Pharma. & Active Materials                                       Architectural
                                                                       coatings
                                                                                                                                        18 23                                                                                  Revenues
              4%
                      Inks
                       4%
                                                                         27%                                               23% 20
                                                                                                                                       33            19%                                                                          $1.4
                                                                                                                            15                                                                                                      billion
                                                                                                                                                             14%14%
                                                                                                                     12%                                            13%13%   11%10%
                                                                                                               9%                           125 124               -
                                                                                                                                 107                           -      - - 8%
                                                                                                                                                                                                         7%
                                                                                                                          7 78         86
                                                                                                                                                        75
                                                                                                                                                                                                    6%                     Segment
                                                                                                                10                                            52 61 55 51                46                           Adjusted EBITDA(1)
                                                                                                                      41                                                                       35
                                                                         Industial                              24                                                                  30              21 26
                                                                                                                                                                                                                                 $127
                                                                         coatings
                                                                           14%
                       Plastics
                        41%                                      Construction
                                                                     1%                                                                                                                                                            million
                                                                                                                     Adj. EBITDA ex. Pori          Pori EBITDA Adjustment           Adj. EBITDA Margin

                                    TiO2 Capacity                                                                         Annual Adjusted EBITDA History(1)
2020 Nameplate Capacity; based on management estimates                                                    $ in millions

                                                           Tronox
                                                            13%                                                           30%
                                                                      INEOS
                                                                        3%                                                127                                                 24%        25%                                                 COATINGS
                                                                                                                                 22%

              Others                                                         Venator                          17%
                                                                               7%
               47%                                                                                                               100                                                     41     12%
                                                                                                                                                                               75
                                                                                                               63         572                                                                             9%
                                                                                                                                            6%     7%
                                                                                                                                 349                                 4%                  376
                                                                                                                                                                               312
                                                                             Chemours                         243                           33      50       (1%)                                197
                                                                               14%                                                          84      84                49                                  127                                  INKS
                                                                                                                                                              50
                                                                                                                                                             (58)     12

                                                                Kronos                                        2010 2011 2012 2013 2014 2015 2016 2017 2018 2019 2020
                                               Lomon              7%
                                               Billions                                                              Adj. EBITDA ex. Pori                                          Adj. EBITDA Margin
                                                                                                                                                  Pori EBITDA Adjustment
                                                 9%
        (1)     See Appendix for reconciliations and important explanatory notes
4       (2)     Adjusted to include the Oct. 1, 2014 acquisition of the Performance Additives and Titanium Dioxide businesses of Rockwood Holdings, Inc. as if consummated at the beginning of the period, based upon their management’s
                representation; excludes the related sale of our TR52 product line – used in printing inks – to Henan Billions Chemicals Co., Ltd. in December 2014; and excludes the allocation of general corporate overhead by Rockwood
JP Morgan 2021 Global High Yield and Leveraged Finance Conference - Virtual - March 2, 2021 - Venator
Market Leader in High-Value Specialty TiO2
   Favorable application mix

             Venator has more than half of its sales volume in high value and technically demanding TiO2 categories

                                                                                                                         Venator Focus

                                                                                                                                                 Specialties
                            Price

                                                                                                                  Differentiated

                                                                                   Functional
Legend:                               Low Quality
% Total global TiO2
industry demand                              18%                                         41%                            32%                       9%
% Venator TiO2 sales
                                                 0%                                      42%                            47%                      11%
volume(1)

                                                 1,000                   2,000                 3,000   4,000               5,000               6,000
                                                                                                                            Estimated World Demand (kmt)(2)
       Indicative EBITDA
                                                                              1x                                        2x                      3x+
       margins
                                                       Functional coatings (architectural)              Industrial coatings                 Catalysts
       Applications
                                                       Functional plastics                              Performance plastics                Food
                                                       Paper                                            Differentiated Inks                 Pharma &
                                                                                                                                               Cosmetics
                                                                                                                                              Fibers &
                                                                                                                                               Films
                                                                                                                                              Solar
                                                                                                                                              Specialty
                                                                                                                                               Inks
            (1)   2020 volumes
   5        (2)   Source: Management estimates
JP Morgan 2021 Global High Yield and Leveraged Finance Conference - Virtual - March 2, 2021 - Venator
Performance Additives
2020 $8 million improvement despite COVID pandemic

                              End Markets                                                                  Quarterly Adjusted EBITDA History(1)                                                                 2020
2020 Revenues                   Ag. &              Source: Management Estimates             $ in millions
                                        Other
                        Fibres Water
                                         2%        Architectural
                        & films 4%
                                                     coatings
    Personal Care, Food, 3%                            14%                                                                                                                      17%                        Segment
     Pharma. & Active                                                                                                                       14%13%
                                                                                                 13%                    14%
         Materials
            6%                                                                                12%
                                                                                                                           13%
                                                                                                                                                                                                 12%
                                                                                                                                                                                                           Revenues
                                                                   Industial                        12%                                                                               11%
                                                                   coatings
                                                                     11%
                                                                                                     $22
                                                                                                                  9%              10%
                                                                                                                                     10%
                                                                                                                                                      8%
                                                                                                                                                                11%
                                                                                                                                                                   12%
                                                                                                                                                                       10%                                   $0.5
          Plastics                                                                             $18                      $22 $21
                                                                                                                                            $24 $23
                                                                                                                                                                                $22                            billion
           16%
                                                                                                            $16                                                          4%                 4%
                                                                                                                  $13
                                                                                                                                  $15 $15
                                                                                                                                                      $12
                                                                                                                                                          3% $15 $16 $13              $13
                                                                                                                                                                                                 $15

                                                                                                                                                           $3              $4               $5
                                                                                                                                                                                                            Segment

                                                                                              1Q16
                                                                                              2Q16
                                                                                              3Q16
                                                                                              4Q16
                                                                                              1Q17
                                                                                              2Q17
                                                                                              3Q17
                                                                                              4Q17
                                                                                              1Q18
                                                                                              2Q18
                                                                                              3Q18
                                                                                              4Q18
                                                                                              1Q19
                                                                                              2Q19
                                                                                              3Q19
                                                                                              4Q19
                                                                                              1Q20
                                                                                              2Q20
                                                                                              3Q20
                                                                                              4Q20
                                                                                                                                                                                                       Adjusted EBITDA(1)
                                            Construction
                                               44%                                                                                                                                                            $55
                                                                                                                                                                                                               million
                              Competitors                                                                  Annual Adjusted EBITDA History(1)(2)
                                                                                            $ in millions
                        Functional Additives
                                                                                                                                      $72
                                                                                                   $69                  $69
                                                                                                                                                       $62
                                                                                                                                                                                      $55
                            Color Pigments                                                                                                                           $47
                                                                                                                                                                                                       CONSTRUCTION

                                                                                                  12%                   12%           12%
                                                                                                                                                                                  11%
                                                                                                                                                       10%
                                                                                                                                                                     9%

                     Timber and Water Treatment

                                                                                                  2015                  2016          2017            2018          2019          2020
                                                                                                                                                                                                                   COATINGS
                                                                                                            Segment Adj. EBITDA                         Segment Adj. EBITDA Margin

    (1)   See Appendix for reconciliations and important explanatory notes
6   (2)   Adjusted to include the Oct. 1, 2014 acquisition of the Performance Additives and Titanium Dioxide businesses of Rockwood Holdings, Inc. as if consummated at the beginning of the period, based upon their management’s
          representation; excludes the related sale of our TR52 product line – used in printing inks – to Henan Billions Chemicals Co., Ltd. in December 2014; and excludes the allocation of general corporate overhead by Rockwood
Performance Additives
Product overview

    FY20
 LTM EBITDA(1)
    % split            Product                                     Characteristics & Uses                   Competition   Benefit

 Functional          Barium and Zinc Additives                       Fillers that enhance the gloss and                   Strong EBITDA margins
                                                                      flow of paints and the mechanical
 Additives                                                                                                                 Complementary and common
                                                                      properties of plastics
                                                                                                                            process technology
      25%                                                            Specialty soft white pigments
                                                                                                                           Similar customer base to TiO2

                     Iron Oxides                                     Highly durable red, yellow, black
                                                                      and tan pigments
                                                                     Colorants for paint, plastics and
                                                                      concrete
                                                                                                                           High cash conversion margins
                     Ultramarines                                    Unique blue-shade pigments
      Color                                                          Violet and pink variants                             Good geographic balance
    Pigments                                                                                                               Similar customer base to TiO2
      42%            Specialty Inorganics                            Weather-resistant, chemically                        Common process technology
                     Chemicals                                        stable pigments
                                                                     Distinct color shades

                     Driers                                          Controls the drying rate of a paint
                                                                      or ink

                     Residential construction (ACQ,                  Protects wood from decay and
                     ECOLIFETM and Copper Azole)                      fungal or insect attack
                                                                                                                           Limited number of major
Timber and                                                                                                                  competitors
                     Industrial construction                         Prolongs service life of wood
  Water                                                                                                                    Stable demand profile
                     (Chromated Copper Arsenate)
Treatment
                                                                                                                           High cash conversion
      33%            Polyaluminium chloride                          Clarifies water by promoting the
                     based flocculants                                sedimentation of particles

        (1)   See Appendix for reconciliations and important explanatory notes
7
Driving Further Cost Reduction
~$55mm EBITDA improvement delivered by end of 2022(a)

                          2020 BIP Highlights                           Timing (a)
                                                $ in millions
                                                                                     ~$75
 Delivered $57mm savings in 2020 which
  included $27mm of COVID savings                                        ~$65
                                                                                             Non-recurring
                                                                                             savings

                                                                                             2020
 2020 Business Improvement Program on                           $57                         Business
                                                                                             Improvement
  track                                                                               ~$55
                                                                                             Program

                                                                                             2019
                                                                                             Business
                                                                 $27                         Improvement
 Agreement with German employee                                COVID     ~$45               Program

  representatives reached in December
  2020 in relation to our German
  restructuring program
                                                                 $16

 $40-45 million of estimated future cash                                ~$20         ~$20
  restructuring costs
                                                                 $14

                                                                 2020    2021        2022

    (a) Compared to 2019 baseline
8
Free Cash Flow Considerations
      Generated $13 million positive free cash flow in 4Q20

$ in millions
                                                                             Actual

                                                                   4Q20                   2020                                                                           Comments

 Adjusted EBITDA                                                     $25                  $136                     Total liquidity(a) of $471mm as of December 31, 2020
                                                                                                                    – $220mm of cash
 Capital expenditures(b)                                             (13)                  (67)                         – $251mm available under the ABL

 Cash interest                                                       (4)                   (39)
                                                                                                                   No significant debt maturities until 2024(d)

 Primary working capital change                                       45                    39
                                                                                                                   Expected 2021 capital expenditures of $75 – 85mm

 Restructuring                                                       (3)                   (10)
                                                                                                                   Continued focus on working capital management
                                                                                                                    – Expected 2021 cash use consistent with rising prices
 Pension and Other                                                   (29)                  (78)

 Cash income taxes                                                   (3)                    (3)

 Pori cash expenses, net(c)                                           (5)                   (8)

 Total free cash flow                                                $13                  $(30)

                  See Appendix for reconciliations and important explanatory notes
            (a)    Defined as cash and availability under the ABL
      9     (b)
            (c)
                   Includes capital expenditures related to the transfer of specialty and differentiated products and excludes ~$2 million of capital expenditures at the Pori site in 2020
                   Includes ~$2 million of capital expenditures at Pori unrelated to the transfer program in 2020
            (d)    Scheduled maturities of our Term Loan, Snr Unsecured and Snr. Secured bonds in 2024, 2025 and 2025, respectively. Excludes debt to affiliates, ABL refinancing in 2022 and existing short-term borrowings or repayments under the ABL
Focused on Maximizing Shareholder Value

                               Maximize Shareholder Value

                     Focus on                                    Improve
   Customer-                               Enhance
                    specialty &                                 free cash          Portfolio
    tailored                              competitive
                   differentiated                                  flow           optimization
   approach                                position
                     products                                  generation

 Aligning         Growth in higher    Driving             Reduce cash        Potential sale of
  production to     value products       operational          uses and            color pigments
  meet customer     supported by         efficiencies and     improve working     business on hold
  commitments       innovation           cost                 capital
                                         improvements         management

  10
Appendix

11
Pro Forma Adj. EBITDA Reconciliation

$ in millions                                                        2014           2015              2016         2017         2018           2019     1Q20               2Q20        3Q20           4Q20           2020

Net (Loss) / Income                                                 $ (162)        $ (352)        $     (77)   $    144     $    (157)     $    (170)       $    8     $    (17)   $       (39)   $       (57)   $       (105)
Net income attributable to noncontrolling interests                      (2)                (7)        (10)         (10)             (6)          (5)           (1)          (2)           (3)            (1)             (7)
Net income of discontinued operations                                     –                (10)         (8)          (8)              –            –             –            –             –              –               –
Interest                                                                  2                 30          44           40              40           41            10           12            15             15              52
Income tax expense / (benefit)                                          (17)               (34)        (23)          50              (8)         150            (2)           2             3              9              12
Depreciation and Amortization                                            93                100         114          127             132          110            28           28            29             29             114
EBITDA                                                              $   (86)   $       (273)      $     40     $    343         $     1    $     126    $       43     $     23        $    5         $    (5)       $    66
Business acquisition and integration expenses                            45                 44           11            5           20             (1)            1            3             –              (3)              1
Separation (gain) expense, net                                            –                  –            –            7            2             (3)            –            –             –             (10)            (10)
U.S. income tax reform                                                    –                  –            –          (34)           –              –             –            –             –               –               –
Purchase accounting adjustments                                          13                  –            –            –            –              –             –            –             –               –               –
Loss / (gain) on disposition of businesses/assets                        (1)                 1          (22)           –            2              1             2            –            (6)             (1)             (5)
Certain legal expenses / settlements                                      3                  3            2            1            –              4             –            –             –               6               6
Amortization of pension and postretirement actuarial losses              11                  9           10           17           15             14             3            4             3               3              13
Net plant incident costs (credits)                                        –                  4            1            4         (232)            20             1            2             2               2               7
Restructuring, impairment, and plant closing and transition costs        62                220           35           52          628             33             7            5            13              33              58
Adjusted EBITDA                                                     $    47            $     8    $     77     $    395     $       436    $     194    $       57     $     37    $       17     $       25     $       136
Corporate and other                                                      29                 53          53           64              43           50            11           11             9             15              46
Operating Segment Adjusted EBITDA                                   $    76        $        61    $    130     $    459     $       479    $     244    $       68     $     48    $       26     $       40     $       182

                                    (a)
Titanium Dioxide Segment EBITDA                                         134                 (8)          61         387             417          197             46          35            21              25            127
                                     (a)
Performance Additives Segment EBITDA                                     91                 69           69          72              62           47             22          13             5              15             55
Public company standalone costs                                         (29)               (53)         (53)        (64)            (43)         (50)           (11)        (11)           (9)            (15)           (46)
Adjusted EBITDA                                                     $ 196                  $ 8        $ 77     $ 395            $ 436          $ 194        $ 57           $ 37        $ 17           $ 25           $ 136
Pori related EBITDA adjustment                                          (50)               (50)         (49)         (75)           (41)           –             –            –             –               –               –
Pro forma Adjusted EBITDA                                           $ 146           $ (42)            $ 28     $ 320            $ 395          $ 194        $ 57           $ 37        $ 17           $ 25           $ 136

                (a) Adjusted to include Rockwood pro forma
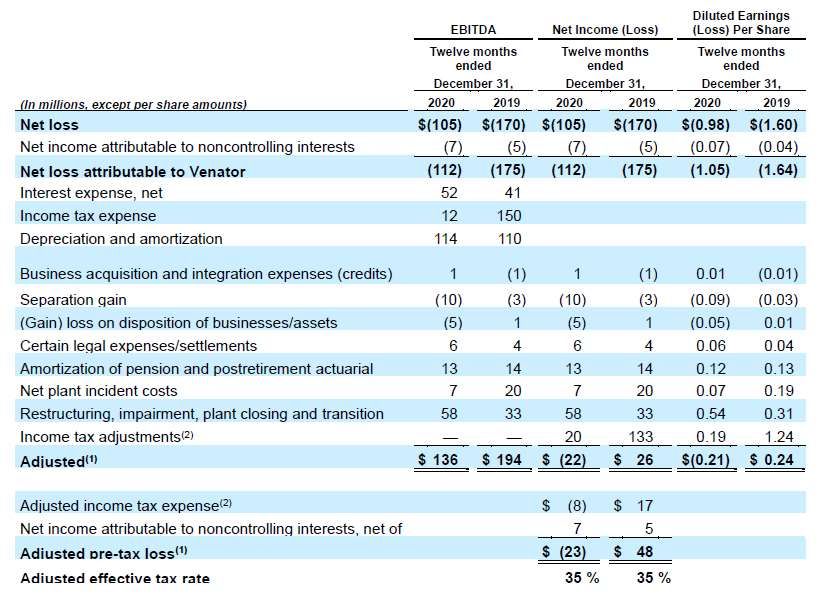
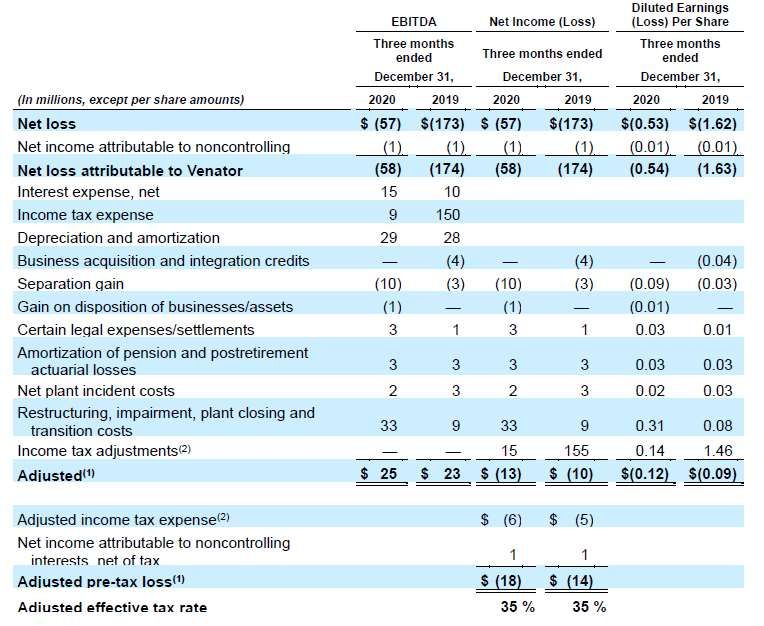
         12
Reconciliation of U.S. GAAP to Non-GAAP
Measures

     See Appendix for reconciliations and important explanatory notes
13
Reconciliation of U.S. GAAP to Non-GAAP
Measures

     See Appendix for reconciliations and important explanatory notes
14
You can also read