Commercial Vehicles February 2021 - Mavyn
←
→
Page content transcription
If your browser does not render page correctly, please read the page content below
Commercial Vehicles February 2021
Highlights
CV sales decline due to axle norms, liquidity crunch and weak freight demand.
Sales of MHCV increased, while LCV vehicles decreased on-year during the month.
Read more about the commercial vehicle monthly sales performance.
Contents
Sections
Review ......................................................................................................................................................... 1
Annexures .................................................................................................................................................... 8CV industry witnessed decline in sales in January 2021
Wholesale offtake of goods carrying commercial vehicle in the month of January 2021 is estimated to have
decreased by ~6% on-year due to decline in LCV volumes as well as weak retail offtake. Retail sales, declined
by ~27% on-year in January 2021, as freight demand continues to remain low.
Y-o-Y growth in domestic goods category
Note: E- Estimated.
Source: CRISIL Research, SIAM
1Outlook: Wholesale offtake of MHCVs improved in January 2021 Outlook: Domestic commercial vehicles goods segment Note: F- Forecast, E - Estimated Source: CRISIL Research Domestic CV industry sales review in January 2021 Note: E-Estimated Source: Media report, CRISIL Research Nikkei manufacturing PMI rose in January-20 The Nikkei India Manufacturing Purchasing Managers’ Index rose to 57.7 in January from December's 56.4, above the 50-level separating growth from contraction for the sixth month straight . In December 2020, India's factory output, which is measured in terms of Index of Industrial Production (IIP), witnessed a growth of 1 per cent. A lot of economic revival seen in the previous few months as factories continued to ramp-up production at an above-trend pace. 2
MHCV Domestic sales (Goods) and Y-o-Y growth in IIP

Source: Ministry of Statistics & Programme Implementation (MoSPI), CRISIL Research

Domestic sales: MHCV goods category (y-o-y growth)

Note: T denotes tonnes
Source: SIAM, CRISIL Research

                                                                                     3
MHCV goods vehicles: Domestic monthly sales trend Note: There were no sales volume in April 2020 due to nationwide lockdown owing to COVID -19 outbreak Source: SIAM, CRISIL Research Domestic sales: Player-wise market share (MHCV segment) Source: SIAM, CRISIL Research 4
Domestic sales: LCV goods category (y-o-y growth)

Note: T denotes tonnes
Source: SIAM, CRISIL Research

LCV goods vehicles: Domestic monthly sales trend

Note: There were no sales volume in April 2020 due to nationwide lockdown owing to COVID-19 outbreak
Source: SIAM, CRISIL Research

                                                                                                       5
Domestic sales: Player-wise market share (LCV segment) Source: SIAM, CRISIL Research Buses sales declined significantly in 9MFY21 Passenger vehicle industry estimated to have witnessed sharp decline in sales in 9MFY21. Demand continues to remain poor due to minimal inter-city movement and workplaces are yet to resume back to pre-COVID levels; also, school demand is negligible as most schools are shut. Demand for ambulances is expected to be the key segment in focus for OEMs. Domestic sales: Passenger category Source: SIAM, CRISIL Research 6
Domestic sales: Player-wise market share (Bus segment)

Source: SIAM, CRISIL Research

Exports declined sharply in 9MFY21
Export of CVs remain impacted owing to lower production. Exports is estimated to have fallen by over 34.7%
on year in 9MFY21.

Exports: Goods and passenger vehicles

Source: SIAM, CRISIL Research

                                                                                                         7
Annexures
Note: Commercial vehicles sales data is only available at a quarterly basis in fiscal 2021
Commercial vehicles: Company-wise sales (including exports)
Segment Player 2020-21 2019-20 Growth 2020-21 2019-20 Growth
Nos. Oct-Dec Oct-Dec (Y-o-Y) Apr-Dec Apr-Dec (Y-o-Y)
(per cent) (per cent)
LCV Ashok Leyland Ltd. 16824 13083 28.6 31125 38095 -18.3
Force Motors Ltd. 1786 5187 -65.6 4667 15083 -69.1
Hindustan Motors Ltd. 0 0 n.m 0 0 n.m
Isuzu Motors India Pvt Ltd. 1863 1162 60.3 3073 2403 27.9
MTBL 56055 59540 -5.9 121622 164448 -26.0
Maruti Suzuki India Ltd. 12332 6605 86.7 20707 19814 4.5
Piaggio Vehicles Pvt. Ltd. 0 13 n.m 30 251 n.m
SML Isuzu Ltd. 792 846 -6.4 1419 4510 -68.5
Tata Motors Ltd. 59971 61570 -2.6 108649 168187 -35.4
VECVs - Eicher 3366 3641 -7.6 7307 11379 -35.8
LCV Total 152989 151647 0.9 298599 424170 -29.6
M&HCV Ashok Leyland Ltd. 16580 18121 -8.5 25496 61654 -58.6
AMW Motors Ltd. 0 0 n.m 0 0 n.m
Mahindra & Mahindra Ltd. 1116 1456 -23.4 1823 5037 -63.8
SML Isuzu Ltd. 815 739 10.3 1377 3515 -60.8
Tata Motors Ltd. 28951 30130 -3.9 45493 96677 -52.9
VECVs - Eicher 8849 8400 5.3 14994 24932 -39.9
VECVs - Volvo 421 451 -6.7 637 1010 -36.9
JBM Auto Ltd 78 0 n.m 78 76 n.m
M&HCV Total 56810 59297 -4.2 89898 192901 -53.4
Grand Total 209799 210944 -0.5 388497 617071 -37.0
n.m : Not meaningful; LCV: Light commercial vehicle; MHCV: Medium and heavy commercial vehicle; Y-o-Y:
Year-on-Year
Note: 1) As SIAM revises cumulative figures, there might be marginal difference between SIAM and CRISIL figures.
2) In addition, SIAM has reclassified figures from April 2011 onwards resulting in difference between figures. Figures
include sales of the < 5 T and < 13 seating capacity in the LCV PV segment, which was added under
commercial vehicles as per new SIAM classification
3) M&M bought out the remainder 49 per cent stake in the Mahindra Navistar JV in February 2013.
4) Mahindra Navistar Automotives Ltd (MNAL) has been renamed as Mahindra Trucks and Buses Ltd (MTBL).
MTBL includes shares of M&M & MNAL
5) SML Isuzu Limited was formed in 2010 through a joint venture between Swaraj Mazda and Isuzu Limited
SIAM has only published quarterly data for commercial vehicles and is expected to continue to do so.
Source: SIAM, CRISIL Research
8Commercial Vehicles: Company-wise domestic sales
Segment Player 2020-21 2019-20 Growth 2020-21 2019-20 Growth
Nos. Oct-Dec Oct-Dec (Y-o-Y) Apr-Dec Apr-Dec (Y-o-Y)
(per cent) (per cent)
LCV Ashok Leyland Ltd. 15991 12574 27.2 29629 36855 -19.6
Force Motors Ltd. 1675 5131 -67.4 4429 14848 -70.2
Hindustan Motors Ltd. 0 0 n.m 0 0 n.m
Isuzu Motors India Pvt Ltd. 703 897 -21.6 731 2129 -65.7
Mahindra & Mahindra Ltd. 52493 55658 -5.7 114775 153348 -25.2
Maruti Suzuki India Ltd. 12076 6287 n.m 19917 18188 n.m
Piaggio Vehicles Pvt. Ltd. 0 10 -100.0 0 215 -100.0
SML Isuzu Ltd. 711 777 -8.5 1268 4239 -70.1
Tata Motors Ltd. 55208 56891 -3.0 101150 154204 -34.4
VECVs - Eicher 2935 3251 -9.7 6063 10350 -41.4
Volvo Group India Pvt Ltd 52 198 n.m 87 430 n.m
LCV Total 141844 141674 0.1 278049 394806 -29.6
M&HCV Ashok Leyland Ltd. 14472 16259 -11.0 22155 56229 -60.6
AMW Motors Ltd. 0 0 n.m 0 0 n.m
Mahindra & Mahindra Ltd. 1064 1326 -19.8 1678 4755 -64.7
SML Isuzu Ltd. 747 723 3.3 1294 3413 -62.1
Tata Motors Ltd. 26594 27560 -3.5 41304 88294 -53.2
VECVs - Eicher 7823 7218 8.4 13008 22111 -41.2
VECVs - Volvo 421 451 -6.7 637 1010 -36.9
Volvo Buses India Pvt. Ltd. 0 0 n.m 0 0 n.m
JBM Auto Ltd 78 0 n.m 78 76 n.m
M&HCV Total 51199 53537 -4.4 80154 175888 -54.4
Grand Total 193043 195211 -1.1 358203 570694 -37.2
n.m : Not meaningful; LCV: Light commercial vehicle; MHCV: Medium and heavy commercial vehicle
Note: 1) As SIAM revises cumulative figures, there might be marginal difference between SIAM and CRISIL figures
2) In addition, SIAM has reclassified figures from April 2011 onwards resulting in difference between figures.
Figures include sales of the < 5 T and < 13 seating capacity in the LCV PV segment, which was added under
commercial vehicles as per new SIAM classification
3) Mahindra Navistar Automotives Ltd (MNAL) has been renamed as Mahindra Trucks and Buses Ltd (MTBL).
MTBL includes shares of M&M & MNAL
4) SML Isuzu Limited was formed in 2010 through a joint venture between Swaraj Mazda and Isuzu Limited
SIAM has only published quarterly data for commercial vehicles and is expected to continue to do so.
Source: SIAM
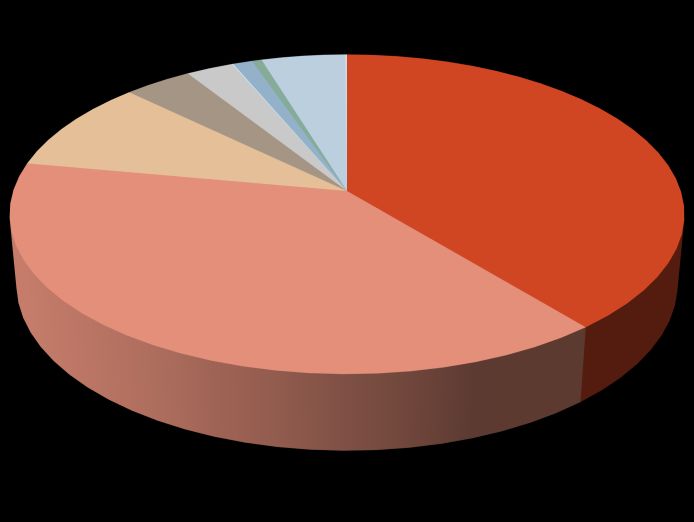
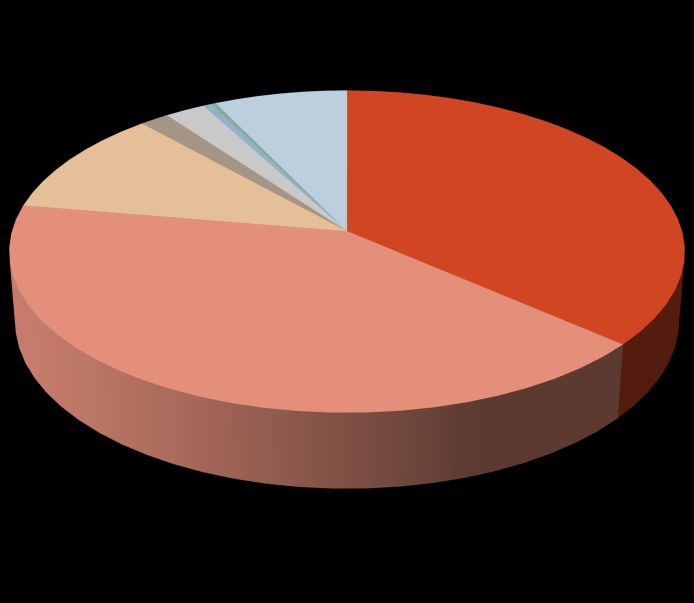
9MHCV Domestic market share
Apr-Dec 21
Mahindra & Mahindra Ltd.
2.1%
SML Isuzu Ltd. Others
1.6% 0.9%
VECVs - Eicher
16.2%
Tata Motors Ltd.
51.5%
Ashok Leyland Ltd.
27.6%
Apr-Dec 20
Mahindra & Mahindra Ltd.
2.7%
SML Isuzu Ltd. Others
1.9% 0.6%
VECVs - Eicher
12.6%
Tata Motors Ltd.
50.2%
Ashok Leyland Ltd.
32.0%
10LCVs: Domestic market share
Apr-Dec 20
Maruti Suzuki India Ltd.
7.2%
Swaraj Mazda Ltd.
Piaggio Vehicles Pvt. Ltd. 0.5%
0.0%
VECVs - Eicher Isuzu Others
2.2% 0.3% 0.0%
Force Motors Ltd.
1.6%
Ashok Leyland Ltd.
10.7% Tata Motors Ltd.
36.4%
Mahindra &
Mahindra Ltd.
41.3%
Apr-Dec 19
Swaraj Mazda Ltd.
1.1% Maruti Suzuki India Ltd.
Piaggio Vehicles Pvt. Ltd.
0.1% 4.6%
Isuzu
VECVs - Eicher 0.5%
2.6% Others
0.1%
Force Motors Ltd.
3.8%
Ashok Leyland Ltd.
9.3% Tata Motors Ltd.
39.1%
Mahindra &
Mahindra Ltd.
38.8%
11Trend in freight rates and diesel prices
(₹ per tkm)
140.0 120.0
120.0
100.0
100.0
80.0
80.0
60.0
60.0
40.0
40.0
20.0
20.0
0.0 0.0
Nov-17
Nov-18
Nov-19
Jul-17
Jan-20
Jan-18
Mar-18
Jul-18
Jan-19
Jul-19
Mar-19
Sep-17
Sep-18
May-19
Sep-19
May-18
Average diesel prices Average freight rates (R.H.S)
12Our Capabilities
Making Markets Function Better
Economy and Industry Research
Largest team of economy and industry research analysts in India
Acknowledged premium, high quality research provider with track record spanning two decades
95% of India's commercial banking industry by asset base uses our industry research for credit decisions
Coverage on 86 sectors: We provide analysis and forecast on key industry parameters including demand,
supply, prices, investments and profitability, along with insightful opinions on emerging trends and impact of
key events
Research on sectors and clusters dominated by small and medium enterprises covering analysis of relative
attractiveness, growth prospects and financial performance
High-end customised research for many leading Indian and global corporates in areas such as market sizing,
demand forecasting, project feasibility and entry strategy
Funds and Fixed Income Research
Largest and most comprehensive database on India's debt market, covering more than 18,000 securities
Largest provider of fixed income valuations in India
Provide valuation for more than Rs.81 trillion (USD 1,275 billion) of Indian debt securities
Sole provider of fixed income and hybrid indices to mutual funds and insurance companies; we maintain 37
standard indices and over 100 customised indices
Ranking of Indian mutual fund schemes covering 75% of assets under management and Rs.9 trillion (USD
144 billion) by value
Business review consultants to The Employees' Provident Fund Organisation (EPFO) and The National
Pension System (NPS) Trust in monitoring performance of their fund managers
Equity and Company Research
Assigned the first IPO grade in India; graded more than 100 IPOs till date
Due Diligence and Valuation services across sectors; executed close to 100 valuation assignments
Due Diligence, IPO Grading and Independent Equity Research for SME companies planning to list or already
listed in NSE Emerge platform
First research house to release exchange-commissioned equity research reports in India; covered 1,488 firms
listed and traded on the National Stock Exchange
Executive Training
Conducted 1200+ training programs on a wide spectrum of topics including credit, risk, retail finance,
treasury, and corporate advisory; trained more than 24,000 professionals till date
Training programs being conducted in India, Sri Lanka and Bangladesh through an extensive network of well-
qualified financial professionalsAbout CRISIL Limited CRISIL is a leading, agile and innovative global analytics company driven by its mission of making markets function better. It is India’s foremost provider of ratings, data, research, analytics and solutions with a strong track record of growth, culture of innovation, and global footprint. It has delivered independent opinions, actionable insights, and efficient solutions to over 100,000 customers through businesses that operate from India, the US, the UK, Argentina, Poland, China, Hong Kong and Singapore. It is majority owned by S&P Global Inc, a leading provider of transparent and independent ratings, benchmarks, analytics and data to the capital and commodity markets worldwide. About Research CRISIL Research is India's largest independent integrated research house. We provide insights, opinion and analysis on the Indian economy, industry, capital markets and companies. We also conduct training programs to financial sector professionals on a wide array of technical issues. We are India's most credible provider of economy and industry research. Our industry research covers 86 sectors and is known for its rich insights and perspectives. Our analysis is supported by inputs from our network of more than 5,000 primary sources, including industry experts, industry associations and trade channels. We play a key role in India's fixed income markets. We are the largest provider of valuation of fixed income securities to the mutual fund, insurance and banking industries in the country. We are also the sole provider of debt and hybrid indices to India's mutual fund and life insurance industries. We pioneered independent equity research in India, and are today the country's largest independent equity research house. Our defining trait is the ability to convert information and data into expert judgements and forecasts with complete objectivity. We leverage our deep understanding of the macro-economy and our extensive sector coverage to provide unique insights on micro-macro and cross-sectoral linkages. Our talent pool comprises economists, sector experts, company analysts and information management specialists. CRISIL Privacy Notice CRISIL respects your privacy. We may use your contact information, such as your name, address, and email id to fulfil your request and service your account and to provide you with additional information from CRISIL. For further information on CRISIL's privacy policy please visit www.crisil.com. Disclaimer CRISIL Research, a division of CRISIL Limited (CRISIL) has taken due care and caution in preparing this Report based on the information obtained by CRISIL from sources which it considers reliable (Data). However, CRISIL does not guarantee the accuracy, adequacy or completeness of the Data / Report and is not responsible for any errors or omissions or for the results obtained from the use of Data / Report. This Report is not a recommendation to invest / disinvest in any company covered in the Report. CRISIL especially states that it has no financial liability whatsoever to the subscribers/ users/ transmitters/ distributors of this Report. CRISIL Research operates independently of, and does not have access to information obtained by CRISIL’s Ratings Division / CRISIL Risk and Infrastructure Solutions Limited (CRIS), which may, in their regular operations, obtain information of a confidential nature. The views expressed in this Report are that of CRISIL Research and not of CRISIL’s Ratings Division / CRIS. No part of this Report may be published / reproduced in any form without CRISIL’s prior written approval. Argentina | China | Hong Kong | India | Poland | Singapore | UK | USA | UAE CRISIL Limited: CRISIL House, Central Avenue, Hiranandani Business Park, Powai, Mumbai – 400076. India Phone: + 91 22 3342 3000 | Fax: + 91 22 3342 3001 | www.crisil.com
You can also read