Opioids in Virginia - C2ER
←
→
Page content transcription
If your browser does not render page correctly, please read the page content below

Opioids in Virginia
Robert M. McNab and Barbara A. Blake
Dragas Center for Economic Analysis and Policy
Strome College of Business
Old Dominion University, Norfolk, Virginia

June 6, 2019
Reintegration into the Workforce: Bringing in Labor off the Sidelines
C2ER 59th Annual Conference, 2019

Presentation Agenda

1. Measuring the impact of opioids

2. Who consumes opioids and
   why?

3. Potential labor market impacts
   of opioids

4. The Path Forward

Opioids-What we know

Opioids are the
leading cause of
accidental death
in the United
States and the
Commonwealth
of Virginia.                                      The Most Common Opioids

                       Methadone           Vicodin, Lorcet,         Dilaudid
                                               Lortab           (hydromorphone)
                                           (hydrocodone)

                   Percocet, Percodan,   Demerol (pethidine)   Duragesic (fentanyl)
                       OxyContin
                      (oxycodone)
                                                                             3
Estimated Consumption of Narcotics
                                               Daily Doses Per Million Inhabitants Per Day, 2017
                              45,000
                                       40,240
                              40,000

                              35,000
  Daily Doses Per 1 Million

                              30,000              28,862
                                                                      26,029
                              25,000
                                                                                          21,109               19,960
                              20,000                                                                                               19,204

                              15,000

                              10,000                                                                                                                    8,537
                                                                                                                                                                            6,513
                               5,000
                                                                                                                                                                                             1,413
                                  0
                                        U.S.         DEU                CAN                  AUS                  BEL                SWE                  FRA                  FIN           JPN
                                                                                                                                                                                                   4
Source: International Narcotics Control Board Annual Report, 2018. Narcotics include codeine, fentanyl, hydrocodone, hydromorphone, methadone, morphine, oxycodone, pethidine, and others.
Estimated Consumption of Selected Narcotics
                                           Daily Doses Per Million Inhabitants Per Day, 2017
                              20,000
                                                        17,832
                              18,000
                              16,000
  Daily Doses Per 1 Million

                              14,000
                              12,000
                              10,000
                               8,000
                                                                                                    6,435                       6,203
                               6,000
                               4,000
                               2,000                                                                              1,581
                                                                                    825
                                  0
                                       Fentanyl             Hyrdocodone             Hydromorphone     Methadone      Morphine     Oxycodone
                                                    U.S.            Germany            Canada         Austria     Belgium
                                                                                                                                          5
Source: International Narcotics Control Board Annual Report, 2018. Table XIV.1.a.
Age-Adjusted Drug Overdose Deaths Per 100,000
                                                   United States, 1999 - 2017
                       30                                                                                                                                     29.1

                       25
                                                                                                                                                               21.7
  Deaths Per 100,000

                       20

                       15
                                                                                                                                                              14.4
                       10   8.2

                       5 6.1
                            3.9
                       0
                            1999     2001                2003                2005                2007                2009                2011   2013   2015   2017
                                                                           Total                     Men                     Women
                                                                                                                                                               6
Source: Centers for Diseases Control and Prevention (2018). NCHS Data Brief Number 329, Drug Overdose Deaths in the United States 1999-2017.
Age-Adjusted Drug Overdose Deaths by Opioid Category
                                                United States, 2000 – 2018*
                        35,000                                                                                                                                                                  30,511
                        30,000
   Deaths Per 100,000

                        25,000

                        20,000
                                                                                                                                                                                                14,759
                        15,000

                        10,000                                                                                                                                                                  12,562
                         5,000

                            0                                                                                                                                                                    3,048
                                 2000         2002               2004              2006               2008               2010               2012               2014               2016          2018
                                   Heroin                 Natural and Semisynthetic                                           Methadone                           Synthetic
Source: Centers for Diseases Control and Prevention (2018). NCHS Data Brief Number 329, Drug Overdose Deaths in the United States 1999-2017. *2018 data represent year-on-year change and are      7
preliminary data through October 2018.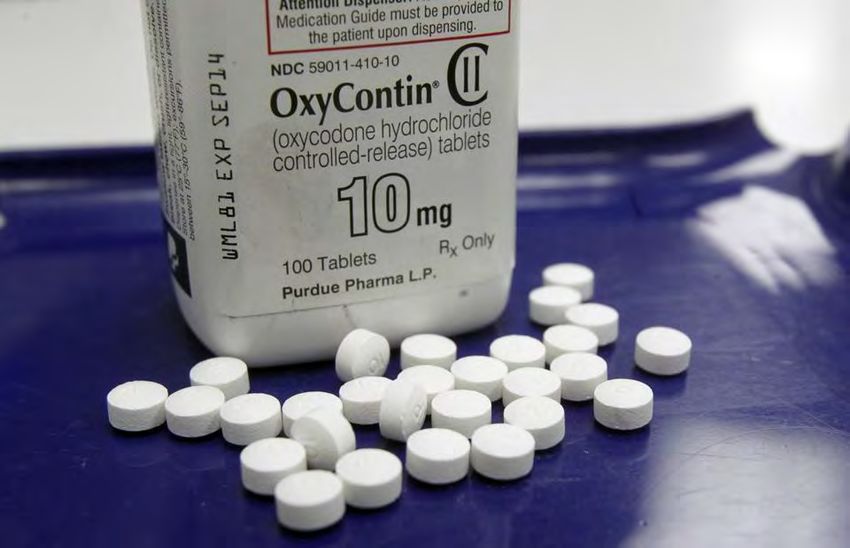
Age-Adjusted Drug Overdose Deaths Per 100,000
                                         United States and Selected States, 2006 and 2017
                       70.0

                       60.0                                                                                                                                                                 57.8

                       50.0
  Deaths Per 100,000

                                                                                                                                                                                46.3
                                                                                                                                                           44.3
                       40.0                                                                                                           36.3

                       30.0
                                                                                                                 24.1
                                                                                            21.7
                                                   17.9                 19.4
                       20.0

                       10.0    8.1

                        0.0
                              NE                  VA                   NY                  U.S.                 NC                  MD                    PA                  OH            WV
                                                                                                                                                                                                 8
Source: Centers for Diseases Control and Prevention (2018). NCHS Data Brief Number 329, Drug Overdose Deaths in the United States 1999-2017. Standard errors available in the CDC tables.
Overdoses from Selected Opioids in Virginia
                                                              2007 - 2018
            1200

                                                                                                                                                                                                   977
            1000

             800
   Deaths

             600
                                                                                                                                                                                                   457
                           401
             400

             200           148

                 0
                          2007           2008           2009           2010            2011           2012                  2013           2014            2015            2016             2017   2018
                              Fentanyl and/or Heroin                                           Prescription Opioids (Excluding Fentanyl)
                                                                                                                                                                                                         9
Source: Virginia Department of Health, Office of the Chief Medical Examiner, Fatal Drug Overdose Quarterly Report,   4 th   Quarter 2018. Published April 2019. Data subject to revision.
Leading Methods of Unnatural Death in Virginia
                                                           2007 - 2018
            1,600                                                                                                                                                                                   1,484
            1,500
            1,400
            1,300
            1,200          1,124
   Deaths

            1,100                                                                                                                                                                                  1,036
            1,000
             900            836                                                                                                                                                                    958
             800
             700
             600             721
                           2007           2008           2009           2010           2011           2012                  2013           2014            2015            2016             2017   2018
                                   Motor Vehicle Related                                       Gun Related                                   Fatal Drug Overdose
                                                                                                                                                                                                      10
Source: Virginia Department of Health, Office of the Chief Medical Examiner, Fatal Drug Overdose Quarterly Report,   4 th   Quarter 2018. Published April 2019. Data subject to revision.
Opioid Consumption
Survey Responses on Rationale for Opioid Consumption
                                                   United States, 2017
              60%
                                                                                                                                                                           49% 51% 47%
              50%

              40%
    Percent

              30%                                                             26% 27% 24%

              20%                                   16%
                               12%
                                           8%                                                                               10% 9% 10%
              10%

              0%
                             Pain from illness                           Post-surgical pain                                  Chronic pain                             Never (knowingly)
                                                                                                                                                                        taken opioids
                                                                         Total                      Female                            Male
Source: Statista Survey, February 2017 of 1,029 respondents. "What was the main reason for taking opioids the last time you took them?“ Approximately 2% of respondents were “other” and another   12
2% declined to respond to the survey question.
Self-Reported Health Status
Males Age 25-54, United States
40%
36.3%
35.1%
35%
29.2% 31.9%
30%
19.5% 25.4%
25% 24.4%
Percent
20.0% 20.6%
20% 17.4%
13.9%
15% 12.3%
10.7%
10%
5% 2.3%
1.2%
0%
Excellent Very Good Good Fair Poor
Men - Employed Men - Unemployed Men - Not in Labor Force
Source: American Time Use Survey Responses. Employed (7,277), Unemployed (468), and Not in Labor Force (683). Sample is Well-Being Module (2010, 2012, 2013) using Well-Being Module Weights. 13
Credit original analysis: Alan B. Kreuger (2016). “Where Have All the Workers Gone?” Code available upon request.Respondents Who Took Pain Medication the Previous Day
Males Age 25-54, United States
70%
60% 57.7%
Percent Taking Medication
50%
43.5%
40%
32.4%
30%
20.2% 18.9%
20%
12.4%
10%
0%
Employed Unemployed Not in Labor Force
All Men Disabled Men
Source: American Time Use Survey Responses. Employed (7,277), Unemployed (568), and Not in Labor Force (683). For disabled men, Employed (191), Unemployed (25), and Not in Labor Force (276). 14
Sample is Well-Being Module (2010, 2012, 2013) using Well-Being Module Weights. Credit original analysis: Alan B. Kreuger (2016). “Where Have All the Workers Gone?” Code available upon request.Self-Reported Health Status
Females Age 25-54, United States
40%
37.0% 36.3%
35%
30.9%
30% 25.6% 28.0%
25% 24.0%
21.0% 16.3%
Percent
18.1% 19.3%
20%
16.6%
15%
12.2%
10.0%
10%
5% 3.7%
1.1%
0%
Excellent Very Good Good Fair Poor
Women - Employed Women - Unemployed Women - Not in Labor Force
15
Source: Alan B. Kreuger (2016). “Where Have All the Workers Gone? American Time Use Survey Responses. Employed (7,453), Unemployed (637), and Not in Labor Force (2,265)Respondents Who Took Pain Medication the Previous Day
Females Age 25-54, United States
80%
70% 67.5%
Percent Taking Medication
60%
50.3%
50%
40%
33.7% 32.0%
30% 27.3% 25.9%
20%
10%
0%
Not in Labor Force Unemployed Employed
All Women Disabled Women
Source: American Time Use Survey Responses Employed (7,453), Unemployed (637), and Not in Labor Force (2,265). For disabled women, Employed (394), Unemployed (50), and Not in Labor Force
(175). Sample is Well-Being Module (2010, 2012, 2013) using Well-Being Module Weights. Credit original analysis: Alan B. Kreuger (2016). “Where Have All the Workers Gone? Code available upon 16
request.Respondents Who Took Pain Medication the Previous Day
Males and Female Veterans Age 25-54, United States
60%
50.1%
50%
Percent Taking Medication
45.4%
41.3%
40%
31.7% 32.3%
30% 27.5%
20%
10%
0%
Employed Unemployed Not in Labor Force
Male Veterans Female Veterans
17
Source: American Time Use Survey Responses. Male veterans (2,770). Female veterans (272). Sample is Well-Being Module (2010, 2012, 2013) using Well-Being Module Weights. Code available upon
request.Labor Markets
Labor Force Participation Rate, United States
                                                          January 2007 – April 2019
                              70% 69.4%
                              69%
                                                                                                                                          65.9%
                              68%
  Labor Force Participation

                                    66.7%
                              67%
                              66%
                              65%    64.6%
                              64%                                                                                                         62.8%
                              63%
                              62%
                              61%                                                                                                         62.5%

                              60%
                                 2007        2009                      2011                        2013             2015           2017   2019
                                              Black or African American                               Hispanic or Latino   White
                                                                                                                                          19
Sources: Bureau of Labor Statistics and Dragas Center for Economic Analysis and Policy. Seasonally adjusted data.
20
Unemployment and Fatal Opioid Overdoses
A simple bivariate analysis
suggests that there is a
causal relationship between
the unemployment rate and
the fatal opioid overdose
rate in Virginia.
A lack of economic
opportunities may lead
individuals to seek solace in
a variety of substances,
including opioids.
This is likely an endogenous
relationship, so we would
need a viable instrument to
explore in more detail.
21ED Visits and Disability Rates
A prevailing hypothesis is
that increases in disability
rates correspond to
increases in opioid use.
A bivariate examination
suggests a causal
relationship between the
disability rate and
emergency department
opioid overdose visits.
As with unemployment, this is
likely endogenous, so we
would need to obtain a
viable instrument to explore
in more detail.
22The Path Forward: Opioids and Employment
Lack of skilled labor, an aging labor
                force, and close to record low
                unemployment rates make finding
                quality labor a challenge.

Complications   Failing Drug Tests-In 2017, positive tests
                for illegal drugs in the U.S. workforce
for Employers   remained at their highest level in more
                than a decade.

                According to Detox’ Drugging at Work
                Survey, nearly 7 in 10 Americans have
                used drugs including opiates,
                amphetamines and cocaine while they
                were at work.

                                                        24
Has your company hired individuals with any of the following
backgrounds?
25
Source: Workers with Criminal Backgrounds, 2018, https://www.shrm.org/hr-today/trends-and-forecastingDr. Nora Volkow, Director, National Institute on Drug
Abuse (NIDA), National Institutes of Health (NIH)
The Biggest Challenges
We lack health system and healthcare provider capacity to identify and engage
individuals, and provide them with high-quality, evidence-based opioid addiction
treatment, in particular the full spectrum of medication-assisted treatment (MAT). It is
well-documented that the majority of people with opioid addiction in the U.S. do not
receive treatment, and even among those who do, many do not receive evidence-
based care. Accounting for these factors is paramount to the development of a
successful strategy to combat the opioid crisis.
There is a need for more rigorous research to better understand how existing programs
or policies might be contributing to or mitigating the opioid epidemic.Looking Forward: A New Look At Pain Management
I have come to believe that an
uncompromising “abstinence-only” model is
a holdover from the very beginnings of the
recovery movement, almost 100 years ago,
and our understanding has greatly evolved
since then. The concepts of addiction and
recovery that made sense in 1935, when
Alcoholics Anonymous was founded, and
which have been carried on by tradition,
might not still hold true in the modern age of
neurochemistry and functional MRIs.
Peter Grinspoon, M.D
Faculty, Harvard Medical School
(11 years clean-Opioids)
Source: Does addiction last a lifetime? Harvard Medical School. October 08, 2018
27Substance Use Prevention and
Treatment Initiative
The Pew Charitable Trusts
• Reduce the inappropriate use of prescription
opioids while ensuring that patients have access
to effective pain management.
• Expand access to effective treatment for
substance use disorders, including through the
increased use of FDA-approved medications
and behavioral health therapies.
28WHAT ROLE CAN EMPLOYERS PLAY IN THIS CRISIS?
Provide Education, Access to Help and Support
Recovery Friendly
Environment- Substance use
disorder is a disease and we
wouldn’t talk about zero
tolerance for other diseases.
Worker Education Programs-
training such as early signs for
managers could provide
crucial intervention assistance
for employees.
Employee Wellness Programs
create a workplace culture
that minimizes the stigma of
addiction.
29Employers can maintain a safe work
environment and combat
prescription drug abuse by taking
the following measures:
Revise the company's drug policy
to address prescription drug use in
addition to illegal drugs.
Educate employees about the
dangers of prescription painkiller
use and misuse.
Include prescription medications
in their drug-testing program.
Partner with their health care and
2018 Society for Human Resource Management workers' compensation insurance
(SHRM) and the Charles Koch Institute (CKI) WORKERS providers to prevent and manage
WITH CRIMINAL RECORDS Member Survey opioid abuse.
74% of managers believe the cost of hiring individuals with
criminal records is the same as or lower than that of hiring
individuals without criminal records.
30“Collateral Consequences”-Dropping out of the workforce
•Discrimination and barriers to employment with a felony history
•Food and financial assistance through the Supplemental Nutrition
Assistance Program (SNAP) and Temporary Assistance for Needy
Families (TANF)benefits are difficult to receive for anyone with a past
that includes a drug felony (12 states have a lifetime ban)
•Barriers to Education include no access to financial aid or grants for
people with drug convictions
•An inability to return to work for at least five years if a drug felony was
committed and the person was employed in the medical field
31Resources to Combat SUDs
National focus on remedying barriers and
opening up the playing field to those who
Substance Use-Disorder
move forward despite addiction, criminal Prevention that Promotes Opioid
convictions, etc.
Recovery and Treatment
(SUPPORT) for Patients and
Communities Act
First Step Act of 2018
Certificates of Rehabilitation
32Next Steps
The foremost need is to acquire more and better information concerning
opioid addiction:
• Better practices to reduce the “burden of
hurt” for individuals and the inappropriate
use of opioids.
• New research that advances our
understanding of pain and addiction and
the development of pioneering
treatments.
• Increase the availability and distribution
of overdose-reversing drugs.
• Increase public health data reporting and
collection.
33All of our presentation materials can be found at our website: www.ceapodu.com
Dragas Center for Economic Analysis and Policy To receive updates from the Dragas Center for Economic Analysis and Policy, please leave your card with us You may also text CEAPODU to 66866 to join our email list and follow DragasCenterODU on Facebook, LinkedIn, and Twitter. You can also visit www.ceapodu.com You will not only receive access to our reports and presentations but as we launch new products, you will be included in the distribution list.
36
You can also read