Autofacts EU Market Update & Mobility Outlook ECG Conference Brussels 20-10-2017

Page created by Marcus Walsh
 
CONTINUE READING
Autofacts EU Market Update & Mobility Outlook ECG Conference Brussels 20-10-2017
www.autofacts.com

                   Autofacts®
                   EU Market Update & Mobility Outlook
                   ECG Conference Brussels
                   20-10-2017

Strictly private
and confidential

October 2017
Autofacts EU Market Update & Mobility Outlook ECG Conference Brussels 20-10-2017
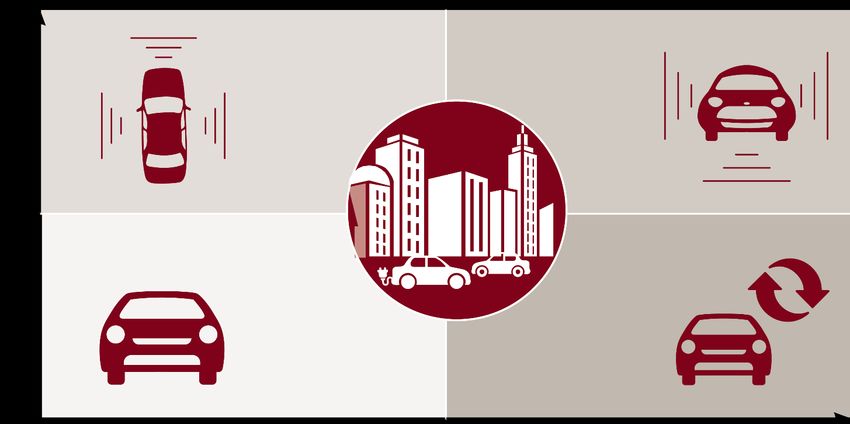
Growth of new car registrations is beginning to slack off in Q3 – worse to be expected in Q4
After a strong start in the first quarter, registrations started to mellow in Q2. Incoming results of Q3 suggest that growth stalled over the three months, due to almost 9% decline in the
UK and Ireland, and top-line weakness in the German market which is shaken severely by doubts about the viability of Diesel cars. Nevertheless, Italy, France and Spain continued on
their recovery path, topped only by Poland and the Netherlands.

EU+EFTA: New Car Registrations by Top 12 Markets
YTD-Sep 2016 vs YTD-Sep 2017 (millions)
3,0                                                                                                                                                                                    30%

 2,5                                                                                                                                                                                   20%

 2,0                                                                                                                                                                                   10%

 1,5                                                                                                                                                                                   0%

 1,0                                                                                                                                                                                   -10%

 0,5                                                                                                                                                                                   -20%

 0,0                                                                                                                                                                                   -30%
           Germany              United   Italy       France         Spain        Belgium         Poland      Netherlands     Sweden         Austria        Ireland     Switzerland
                               Kingdom                        YTD-Sep 2016          YTD-Sep 2017           YOY Change (R-Axis)
Source: ACEA, Autofacts Analysis

PwC Autofacts ®                                                                                                                                                                               2
Autofacts EU Market Update & Mobility Outlook ECG Conference Brussels 20-10-2017
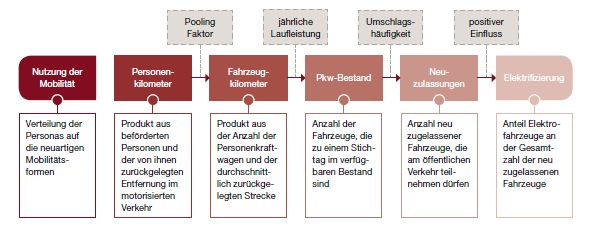
Economic sentiment is approaching a historical high while growth may soften
GDP growth forecasts are forecasted to slow down in 2018, especially UK, Spain and Germany. In the UK, net investment activity has plunged by more than 30% in 2017, leaving its
show an overall acceleration in the Euro Zone, while several main countries mark on the current year as well as short-and mid-term growth prospects. Italy and France, however, are
expected to accelerate further, in line with high economic sentiment.

EA & Top 5: Real GDP Annual Growth                                                            EA & Top 5: Economic Sentiment Indicator
2016 – 2018F (percentage change)                                                              Sep 2014 – Sep 2017 (101 = long run average)

                                                                                              120
   United
  Kingdom

      Spain
                                                                                              110

        Italy

                                                                                              100
 Germany

     France                                                                                    90

Euro Area

                                                                                               80
                -           0,5%          1,0%           1,5%    2,0%    2,5%   3,0%   3,5%         Sep    Dec     Mar     Jun    Sep    Dec     Mar     Jun    Sep    Dec    Mar     Jun    Sep
                                                                                                    2014   2014    2015   2015    2015   2015    2016   2016    2016   2016   2017   2017    2017
                                              2016       2017F   2018F                                            EA             DE             FR             IT         ES                UK
Source: IHS Markit, European Commission (October 2017)

PwC Autofacts ®                                                                                                                                                                                     3
Europe’s new passenger car market shows an increasing slow-down since Q2 2017
On a rolling 12-month average base, it seems that the European market has hit is cyclical high in summer 2017, and is moving towards a reversal of dynamics as the year continues. This
seems contradictory to recently-updated macroeconomic growth statistics and expectations, but is explicable through increasing insecurity about regulatory changes with ensuing
impacts on residual value expectations and – therefore – cost of financing.

EU+EFTA: Rolling 12 Months Car Registrations                                                  EU+EFTA: New Car Registration Variance
Sep 2008 – Sep 2017 (millions)                                                                1990 – 2017F (millions)
17                                                                                            5
                                                                                                                                                                           28-year high
                                                                                                                                                                           (1990-2017)
16
                                                                                              4
                                                                                                                                                                                   2017F
15
                                                                                                                                                                                   2016

                                                                                              3                                                                            28-year low
14                                                                                                                                                                         (1990-2017)

13
                                                                                              2

12

                                                                                              1
11

10                                                                                            0
  Sep           Sep       Sep     Sep     Sep        Sep   Sep      Sep       Sep     Sep         Germany       France      United        Italy       Spain      Poland       Czech
 2008           2009     2010    2011     2012      2013   2014     2015      2016    2017                                 Kingdom                                           Republic
                  Rolling 12-Month Car Registrations        Annual Registrations
Source: ACEA, Autofacts Analysis

PwC Autofacts ®                                                                                                                                                                            4
Strong growth can appear due to totally different reasons
The Fiat and Mercedes-Benz brands both achieved sales of approximately 500k units year-to-date, and managed to grow at over 7% - only Fiat did so without any new product launch,
while Mercedes’ home market of Germany showed increasing weakness. Fiat, however, was bolstered by increasing demand in its core markets Italy, France and Spain, while Mercedes
continued to churn out new and upgraded products against weaker competition.

EU Top 5 Markets: Brands Sales Volume and Growth Rate*                                                                         EU Top 5 Markets: Market Share*
YTD Sep 2016 vs. YTD Sep 2017 (thousands)                                                                                      YTD Sep 2016 vs. YTD Sep 2017 (percentage share)
1.000
                                                                                                                                                                                               Volkswagen
                                                                                                                                                                    10,6%
                                        Volkswagen                                                                                                                                             Renault
   800                                                                                                                                                                               7,4%
                                                                                                       Renault                                                    11,2%                        Ford
                                                   Ford                                                                                 35,0%
                                                                                                                                                                          7,3%                 Opel-Vauxhall
                                                                                                                                                34,1%
   600         Opel-Vauxhall                                                                                          Mercedes-Benz                                                     7,3%
                                                                                        Peugeot                                                                                                Mercedes-Benz
                                                                                                                                                                               7,5%

                                                                                                                                 2017 Sep-      2016 YTD-                                      Peugeot
                                                       Audi                                               Fiat
                                                                                                                                 YTD            YTD                            6,9%     6,3%
   400                                                             BMW                                                                                                                         Fiat
                                                                                                                                                    4,0%                  5,9%
                                                                                                                                                                                               Audi
                                                                                                     Citroen                                           5,4%            6,0%          6,1%
   200                                                                                                                                       4,0%          5,9% 5,8%                           BMW

                                                                                                                                                    5,3%                      6,1%
                                                                                                                                                                                               Citroen
                                                                                                                                                           5,8%   6,1%
                                                                                                                                                                                               Other
      0
       (8%)          (6%)          (4%)           (2%)            0%             2%              4%             6%      8%

Source: ACEA, Autofacts Analysis   *Only brands with official sales data included, commercial vehicles not included

PwC Autofacts ®                                                                                                                                                                                                5
Due to incoming actuals, Autofacts has adjusted to full-year forecast for EU to just 2.4% growth
The cyclical slowdown is now expected to continue into 2019 due to adjustments of the fuel and powertrain mix and technical compliance increasing vehicle prices. With weakening
residual values, financing costs for new vehicles will increase even in the absence of a central bank rate hike, pushing some incremental demand back into the used-car market. The
development in the United Kingdom remains a wild-card requiring close monitoring and quick reactions.

EU+EFTA: New Light Vehicle Registrations
2009 – 2023F (millions)
  20                                                                                                                                                                            10%

  18

  16                                                                                                                                                                            6%

  14

  12                                                                                                                                                                            2%

  10

   8                                                                                                                                                                            (2%)

   6

   4                                                                                                                                                                            (6%)

   2

    -                                                                                                                                                                           (10%)
             2009            2010   2011   2012       2013         2014          2015      2016       2017F    2018F      2019F     2020F      2021F      2022F      2023F
                                                             Car Registrations          LCV Registratons      YOY Change (R-Axis)
Source: ACEA, Autofacts Analysis

PwC Autofacts ®                                                                                                                                                                         6
New products and continuous investments in plants are expected to keep utilization above 80%
The European light vehicle assembly is expected to remain strong as domestic and non-domestic OEMs launch new products and invest in plant upgrades and expansions, which could
push volumes to over 20m units by 2020. In 2016, European light vehicle assembly grew by 3.4% to 18.7m units and is assumed to grow more than 250k units to 19.0m units in 2017,
keeping overall plant utilization at a sustainable level of more than 80% in 2017 and for the foreseeable future.

EU: Light Vehicle Assembly
2009 – 2023F (millions)
 25                                                                                                                                                                        100%

                                                                                                                                   3,4      3,6        3,6        3,6
                                                                                                            3,5        3,9
                                                                                         3,7       3,5
 20                                                                             3,6                                                                                        80%
                             4,7             4,1    5,4                4,5
                                                           4,7
             5,8

 15                                                                                                                                                                        60%

 10                                                                                                                   19,6        20,4      20,5       20,5       20,4     40%
                                                                                        18,7       19,0    19,4
                                                                                18,1
                            16,2             16,9   16,0   16,1       16,8
             14,7

   5                                                                                                                                                                       20%

   -                                                                                                                                                                       0%
            2009            2010             2011   2012   2013       2014     2015     2016      2017F   2018F      2019F        2020F    2021F      2022F      2023F
                                                                  Assembly Volume      Excess Capacity     Utilisation (R-Axis)
Source: Autofacts 2017 Q4 Forecast Release

PwC Autofacts ®                                                                                                                                                                    7
The enlarged PSA Group still has a long way to realize possible synergies
With expected 3.1 million units production in 2017 and strong growth outlook due to the expansion of the SUV/ Crossover product portfolio, the PSA group is one of the most active
market movers in Europe. Still, as product portfolio and operations are not yet aligned, the economics of the take-over remain challenging. Both Daimler and BMW are expected to
increase their product portfolio and output over the next 5 years, while overseas manufacturers seem locked into their current European footprint.

EU: Top 10 Alliance Groups
2016 vs 2023F (millions)
 6                                                                                                                                                                                        5%
                     5,4
          5,1
 5                                                                                                                                                                                        4%

 4                                                                                                                                                                                        3%
                                             3,5
                                  3,1
 3                                                                                                                                                                                        2%
                                                          2,3       2,3
                                                                                            1,9
 2                                                                                 1,8                             1,8                                                                    1%
                                                                                                           1,5                   1,5
                                                                                                                           1,2            1,1   1,2
 1                                                                                                                                                    0,7               0,7               0%
                                                                                                                                                            0,6   0,5         0,5   0,4

 0                                                                                                                                                                                        -1%
                VW                   PSA*                   RNM**                   Daimler                     BMW          FCA            Ford      Hyundai       Tata       Toyota
                                                                                          2016                     2023F           CAGR (R-Axis)
Source: Autofacts 2017 Q4 Forecast Release   *PSA incl. GM Europe (Opel-Vauxhall) **Renault-Nissan-Mitsubishi

PwC Autofacts ®                                                                                                                                                                                8
The mix of powertrains installed in the EU is going to align further to global standards
In order to meet emission requirements, downsizing and electrified vehicles are expected to gain market share in the near future. Since performance is still a valid consumer need,
Autofacts expects manufacturers and technology partners to focus further on turbocharged engines. Further, by 2023 almost 20% of all vehicles, compared to 3.2% in 2016, are
forecasted to have an electrified powertrain – increasing growth of the hybrid figure depends on further decline of Diesel engines.

 Average Engine Displacement                                                   Technology Outlook                                                 Vehicle Propulsion
2016 – 2023F (cubic centimeters)                                               2016 vs 2023F (percentage share)                                   2016 vs 2023F (percentage share)
1.800                                                                          100%
                                                                                                                                                                           1,3%
                                                                                        74,7%                   74,4%
                                                                                75%
1.700
                                                                                50%                                                                                                           48,8%
                                                                                                                                                                           2016
1.600                                                                                                                                                         47,9%
                                                                                25%                        16,4%
                                                                                                8,0%                           9,6% 10,9%
1.500                                                                            0%
            2016 2017F 2018F 2019F 2020F 2021F 2022F 2023F                                      2016                           2023F
                                                                                    Single Turbo       Twin-Turbo           Naturally Aspirated
                                                                                                                                                                                     5,2%
                                                                                                                                                                           5,8%
 Engine Share by Cylinder Number                                               Trans. Share by Gear Count
 2016 – 2023F (percentage share)                                               2016 – 2023F (percentage share)                                                       8,7%
 100%                                                                          100%

   75%                                                                          75%                                                                                                                      46,0%

   50%                                                                          50%                                                                                         2023F

   25%                                                                          25%

    0%                                                                           0%                                                                                  34,4%
             2016     2017F 2018F 2019F 2020F 2021F 2022F                              2016 2017F 2018F 2019F 2020F 2021F 2022F 2023F
                I2     I3     I4     I5      I6/H6/V6        V8        Other            4   5   6      7    8      9   10    Electric   CVT                     Diesel            Hybrid*     PHEV
Source: Autofacts 2017 Q4 Forecast Release    *Includes mild & full hybrids
                                                                                                                                                                Electric          Fuel Cell   Gasoline

PwC Autofacts ®                                                                                                                                                                                                  9
Alternative drivetrains will become the most important growth area in upcoming years
The installation of alternative drivetrains in light vehicles that are manufactures in the EU is forecasted to grow substantially in numbers by more than 510% or 3.4m units, summing up
to more than 4.0m units by 2023. Fully electric and hybrid powertrains are regarded as necessary to achieve the European CO2 emission targets by lowering fuel consumption –
especially as declining Diesel sales make the challenge even more daunting. Regulations beyond 2021 are still under discussion.

EU Powertrain: Alternative Engine Type Distribution                                                                                            EU Powertrain: Hybrid Distribution**
2016 vs. 2023F (thousands)                                                                                                                     2016 vs. 2023F (thousands)
 5.000                                                                                                                                         5.000
                                                                                                                                       4.023

                                                                                                                             891
 4.000                                                                                                                                         4.000

                                                                                                                                                                                         2.968
                                                                                                         973                                                                   2.083
 3.000                                                                                                                                         3.000

                                                                           1.448

 2.000                                                                                                                                         2.000

                                                                                                                                                                     443
 1.000                                                                                                                                         1.000
                      606                        106
                                                                                                                                                          442

        -                                                                                                                                          -
                     2016                     Increase                  Increase                   Increase                 Increase   2023F             2016      Increase   Increase   2023F
                                             Full Hybrid               Mild Hybrid              Plug-In Hybrid             BEV/FCV*                                 Diesel    Gasoline
                                                                                                                                                                    Hybrid     Hybrid
Source: Autofacts 2017 Q4 Forecast Release    *BEV = Battery Electric Vehicle, FCV = Fuel Cell Vehicle   **excl. BEV/FCV

PwC Autofacts ®                                                                                                                                                                                  10
“It’s gonna be so eascy”
                                     shared

                  autonomous                       connected
                                       s
                                 a            c
                  electrified   e              y     yearly
                                                    updated

PwC Autofacts ®                                                11
The user will be able to choose from a menu of mobility forms
grouped between the coordinates vehicle driver vs. vehicle owner

                                          The four form of mobility of the future

                                Machine
                                                                Autonomous             Autonomous
      The primary use-case                                      private-vehicle        shared-vehicle              Autonomous vehicles will
      is car sharing in urban                                                                                      have a positive impact on
      areas.                    Driver                                                                             sharing-concepts.

      An increasing amount of                                                                                      Autonomous and shared
      young people living in                                                                                       mobility will expand the scope
      cities do not own a car                                                                                      of application for electric
      and use the car sharing                                                                                      vehicles.
      concept in combination
      with public transport.                                   Personally-driven      Personally-driven
                                                               private-vehicle        shared-vehicle
                                  Man

                                          Private                            Vehicle Owner                Shared

Source: PwC eascy-Study

PwC Autofacts ®                                                                                                                                     13
The basis for modelling the results is the forecast of the person-
kilometres and the pooling factor

                                                              Pooling                   Annual                    Turnover                   Positive
                                                               factor                   mileage                     rate                     effects

                             Usage of        Passenger-                    vehicle-                                              New
                                                                                                     vehicle-                                       Electrification
                             Mobility        kilometres                   kilometres                                         registrations
                                                                                                      Stock

                          Distribution of   Result of the               Result of the             Amount of              Amount of new              Electric
                          the personas      transported                 amount of                 vehicles that          registered                 vehicles share
                          to                passengers                  vehicles and              have been in           vehicles that              of the total
                          the new           and their                   their average             stock on a             are allowed to             number of
                          mobility forms    driven distance             mileage                   certain day            participate in             new-registered
                                            in motorized                                                                 the public                 vehicles
                                            traffic                                                                      traffic

Source: PwC eascy-Study

PwC Autofacts ®                                                                                                                                                       16
Despite current scepticism, it is estimated that 40% of all vehicle
kilometres will be driven autonomously or shared in 2030
Germany: Distribution of mobility forms                                                                     Germany: Vehicle kilometres
2017-2030 (in percent)                                                                                      2017-2030 (in billion kilometres)
 100%                                                                                                       900

  90%                                                                                                       800

  80%
                                                                                                            700

  70%
                                                                                                            600

  60%
                                                                                                            500
  50%
                                                                                                            400
  40%

                                                                                                            300
  30%

                                                                                                            200
  20%

  10%                                                                                                       100

   0%                                                                                                         0
     2017     2018    2019   2020   2021   2022   2023   2024   2025   2026   2027     2028   2029   2030         2017     2018   2019     2020   2021   2022   2023   2024   2025   2026   2027   2028   2029   2030

                                            Personally-driven                        Personally-driven                   Autonomous                              Autonomous
Source: PwC eascy-Study                     private-vehicle                          shared-vehicle                      private-vehicle                         shared-vehicle
PwC Autofacts ®                                                                                                                                                                                                         18
In Germany, vehicle stocks could drop by 20% by 2030 - but new
registrations would rise by almost 20 percent in total
Germany: Stock by mobility forms                                                                               Germany: Registrations by mobility forms
2017-2030 (in million)                                                                                         2017-2030 (in thousand)
 50                                                                                                            6.000

 45

                                                                                                               5.000
 40

 35
                                                                                                               4.000

 30

 25                                                                                                            3.000

 20

                                                                                                               2.000
 15

 10
                                                                                                               1.000

  5

  0                                                                                                               0
       2017    2018       2019   2020   2021   2022   2023   2024   2025   2026   2027    2028   2029   2030           2017   2018   2019   2020   2021   2022   2023   2024   2025   2026   2027   2028   2029   2030
                                                Personally-driven                        Personally-driven               Autonomous                               Autonomous
Source: PwC eascy-Study                         private-vehicle                          shared-vehicle                  private-vehicle                          shared-vehicle
PwC Autofacts ®                                                                                                                                                                                                          19
In Germany, hybrid drives will play an important role in the
short-term - until 2025 electric vehicles are gaining importance
Germany: Registrations by drive types                                                                              Germany: Stock of drive types
2017-2030 (in percent)                                                                                             2017-2030 (in million)
 100%                                                                                                              50

  90%                                                                                                              45

  80%                                                                                                              40

  70%                                                                                                              35

  60%                                                                                                              30

  50%                                                                                                              25

  40%                                                                                                              20

  30%                                                                                                              15

  20%                                                                                                              10

  10%                                                                                                               5

   0%                                                                                                               0
     2017     2018    2019   2020   2021    2022    2023      2024    2025      2026   2027   2028   2029   2030        2017   2018   2019   2020    2021      2022   2023     2024   2025       2026   2027   2028   2029   2030

                                           Combustion      Hybrid    Electric                                                                               Combustion       Hybrid   Electric

                                                                                        Combustion                  Hybrid                          Electric
Source: PwC eascy-Study

PwC Autofacts ®                                                                                                                                                                                                                     20
In 2030, the transition to electrified and (partially) autonomous
vehicles will be in full swing – starting with new registrations
Europe: Vehicle stock                                                                        Europe: Drive types distribution on new registrations
2017-2030 (in million)                                                                       2017-2030 (in million)
 350                                                                                         25

 300
                                                                                             20

 250

                                                                                             15
 200

 150
                                                                                             10

 100
                                                                                              5
   50

    0                                                                                         0
         2017 2018 2019 2020 2021 2022 2023 2024 2025 2026 2027 2028 2029 2030                    2017 2018 2019 2020 2021 2022 2023 2024 2025 2026 2027 2028 2029 2030
                  Personally-driven   Personally-driven   Autonomous        Autonomous
                                                                                                                      Combustion   Hybrid   Electric
                  private-vehicle     shared-vehicle      private-vehicle   shared-vehicle
Source: PwC eascy-Study

PwC Autofacts ®                                                                                                                                                           21
Contact

                  Christoph Stürmer
                  Global Lead Analyst
                  PwC Germany (Europe)
                  T: +49 69 9585 6269
                  E: christoph.stuermer@de.pwc.com

PwC Autofacts ®                                      22
Autofacts – Dedicated to the Automotive Industry

                                                                                 Scan and download the free Autofacts App

                                                                                                             Autofacts                                ®

                  The information contained in this report represents the culmination of proprietary research conducted by Autofacts, an analytical group within PwC. All material contained in this report was developed independently of any
                  PwC client relationship and does not represent the firm’s view as an auditor to any legal business entity. While every effort has been made to ensure the quality of information provided, no representation or warranty of any
                  kind (whether expressed or implied) is given by PwC as to the accuracy, completeness or fitness for any purpose of this document. As such, this document does not constitute the giving of investment advice, nor a part of
                  any advice on investment decisions. Accordingly, regardless of the form of action, whether in contract, tort or otherwise, and to the extent permitted by applicable law, PwC accepts no liability of any kind and disclaims all
                  responsibility for the consequences of any person acting or refraining from acting in reliance on this document.
                  ©2016 PwC. All rights reserved. “PwC” refers to PricewaterhouseCoopers LLP (a Delaware limited liability partnership) or, as the context requires, other member firms of PricewaterhouseCoopers International Ltd., each of
                  which is a separate and independent legal entity. “Autofacts” is a globally registered trademark of PwC.

PwC Autofacts ®                                                                                                                                                                                                                                      23
You can also read