A variety of "Beauty Contest" games - UPF-ICREA These slides are adapted from slides originally prepared by Rosemarie Nagel 2009
←
→
Page content transcription
If your browser does not render page correctly, please read the page content below
A variety of “Beauty Contest”
            games

   These slides are adapted from
    slides originally prepared by
          Rosemarie Nagel
            UPF-ICREA
                 2009

                                    1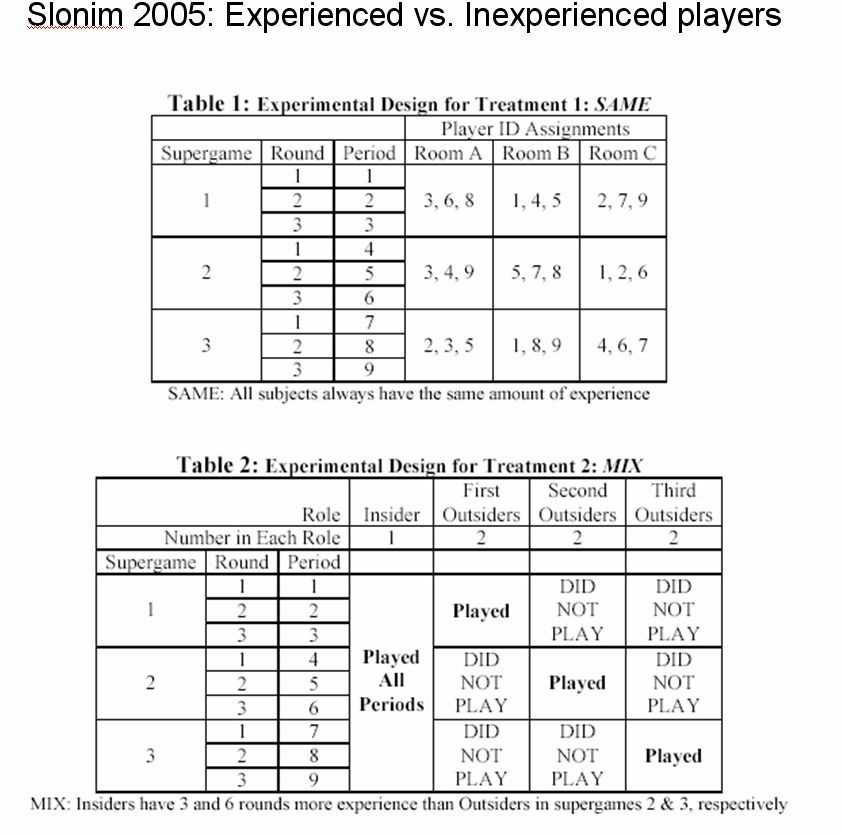
Nagel et al. on the guessing game/beauty contest
1. Nagel, Rosemarie “Unraveling in Guessing Games: An Experimental
   Study,” American Economic Review, 1995, Vol. 85 (5), pp 1313-1326.
2. Duffy, John and Rosemarie Nagel “On the Robustness of Behavior in
   Experimental Beauty-Contest Games,” Economic Journal, Nov. 1997,
   Vol.107, pp 1684-1700.
3. Bosch-Domenech A, Montalvo JG, Nagel R, Satorra A “One, Two,
   (Three), Infinity…: Newspaper and Lab Beauty-Contest Experiments”,
   American Economic Review, Dec. 2002, Vol. 92 (5), pp 1687-1701
4. Grosskopf, Brit and Rosemarie Nagel "The Two-Person Beauty
   Contest,“ Games and Economic Behavior 62 (2008) 93–99
5. Corecelli, Giorgio and Rosemarie Nagel “Beauty Contest in the Brain:
   the Neural Basis of Strategic Thinking” working paper, 2008.
6. Chou, Eileen, Margaret McConnell, Rosemarie Nagel and Charles R.
   Plott “The control of game form recognition in experiments:
   understanding dominant strategy failures in a simple two person
   “guessing” game,” Experimental Economics, forthcoming (2009).
                                                                      2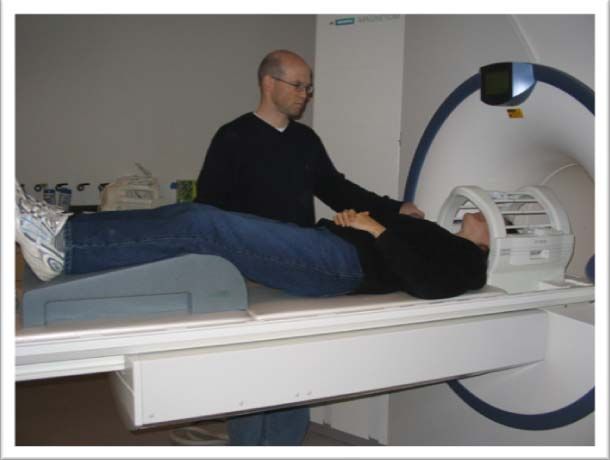
Some other experiments building on Nagel ‘95
• Ho, T.-H., Camerer, C. & Weigelt, K. (1998). Iterated dominance
  and iterated best response in experimental "p-beauty contests".
  American Economic Review, 88, 947-969
• Weber, Roberto A. “'Learning' with no feedback in a competitive
  guessing game,” Games and Economic Behavior, 44,1,134-
  144, JUL 2003
• Slonim, Robert L. “Competing against experienced and
  inexperienced players,” EXPERIMENTAL ECONOMICS, 8,1, 55-
  75, 2005
• Kocher MG, and Sutter M “The decision maker matters:
  Individual versus group behaviour in experimental beauty-
  contest games,” ECONOMIC JOURNAL, 115, 500, 200-223,
  JAN 2005
• Kocher M.G. & Sutter, M. (2006). Time is money – Time
  pressure, incentives, and the quality of decision-making. Journal
                                                                 3
  of Economic Behavior & Organization, 61,375-392.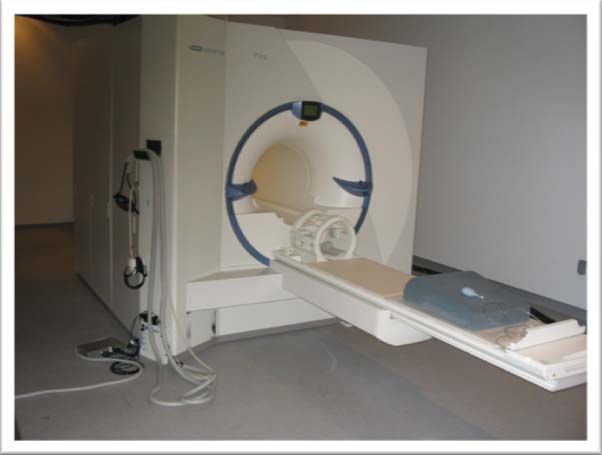
“Beauty Contest” Game
“…professional investment may be likened to those newspaper
competitions in which the competitors have to pick out the six
prettiest faces from a hundred photographs, the prize being
awarded to the competitor whose choice most nearly
corresponds to the average preferences of the competitors as a
whole; so that each competitor has to pick not those faces which
he himself finds prettiest, but those which he thinks likeliest to
catch the fancy of the other competitors, all of whom are looking
at the problem from the same point of view. It is not a case of
choosing those which, to the best of one’s judgment, are really
the prettiest, nor even those which average opinion genuinely
thinks the prettiest. We have reached the third degree where we
devote our intelligences to anticipating what average opinion
expects the average opinion to be. And there are some, I
believe, who practice the fourth, fifth and higher degrees.”
Keynes (1936, p. 156)
                                                                     4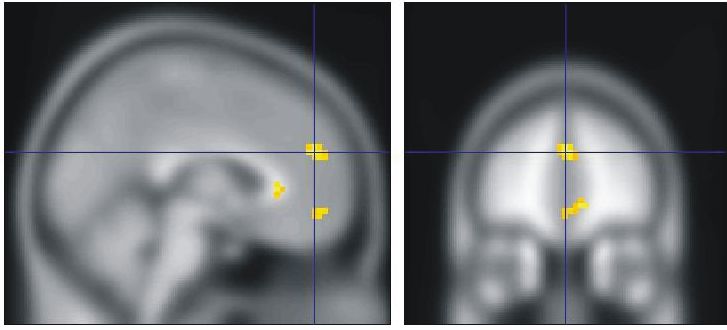
Rules
  Choose a number between 0 and 100. The
  winner is the person whose number is
  closest to 2/3 times the average of all
  chosen numbers

For our exercise today, let’s interpret
 “average” to be the median.

After we’ve collected the results, we’ll graph
  them.                                        5
What happened?
• Hypotheses?

• Are players rational?
  – What does “rationality” imply in this game?
  – How should a rational player behave in a
    population in which not everyone is perfectly
    rational?

                                                    6
I. Basic Beauty Contest Game
• The rules of the basic beauty-contest game:
• N participants are asked to guess a number from the
  interval 0 to 100.
• The winner is the person whose guess is closest to 2/3
  times the mean of the choices of all players.
• The winner gets a fixed prize of $20. In case of a tie the
  prize is split amongst those who tie.
• The same game may be repeated several periods
• History: subjects are informed of the mean, 2/3 mean
  and all choices in each period.
• Time to think: up to two weeks
• Participants: students, theorists, “newspaper readers” etc

                                                               7
Rules, theories, and data for the basic game
                                                            3 Newspaper experiments (Spektrum, Financial
Rules                                                                    Times, Expansion)
      Choose a number
                                                    0,10
      between 0 and 100.
      The winner is the                             0,08

      person whose                                  0,06                               average: 23.08
      number is closest to                          0,04
      2/3 times the                                 0,02
      average of all
      chosen numbers                                0,00
                                                                         22   33
                                                                                      50
                                                                                                               100

 1 . ite ra te d e lim in a tio n o f d o m in a te d s tra te g ie s
 E q u ilib riu m                                           ← ⎯ ⎯ ⎯ ⎯ IT E R A T IO N

     ...    ... E (4 ) E (3 )       E (2 )              E (1 )                     E (0 )

 0         1 3 .1 7 1 9 .7 5 2 9 .6 3        4 4 .4 4              6 6 .6 6                     100

2. iterated best response
   ... ... E(3) E(2) E(1)                                   E(0)

  0          14.89 22.22          33.33                    50                                   100        8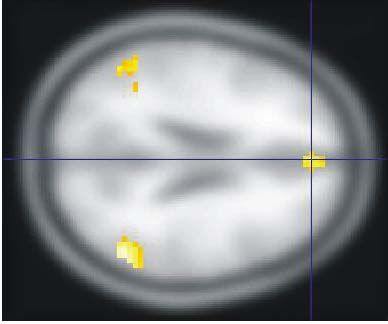
2/3-mean, gametheorists and
                                  2/3-mean lab-students                                                                                 experimenters

                0.20
                                                                                                                                                mean: 18.98
                                                                                                                                              2/3-mean: 12.65
                0.15
relative frequencies

                                              mean: 36.73                                    0.20

                                                                                               relative freq u en ces
                                            2/3-mean: 23.49
                0.10                                                                         0.15

                                                                                             0.10
                0.05
                                                                                             0.05

                0.00                                                                         0.00
                        14   22 33          50            67                    100                                                       chosen numbers
                                                                                                  0                     14   22     33         50                   100
                                       chosen numbers

                       6. Newspaper experiments (15-17)

0.10
                                                                                            First period results with different
0.08                                                                                        populations (Nagel 1995, Bosch et al.
                                                               average: 23.08
0.06
                                                                                            2002)
0.04

0.02

0.00
                                  33                                                  100
                             22               50                                                                                                                9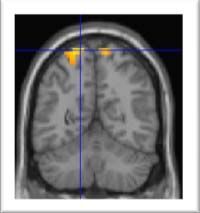
Iterated best reply model
                 characteristics
• Not an equilibrium model: strategies of players
  are not all best replies to each other
• No common knowlegde of rationality
• Limited reasoning
• Best reply to own belief (no consistent beliefs)
• Random behavior is also a strategy

                                                     10
Mean behavior over time
100 some variations
80 4/3-mean
60
mean
0.7-mean, 3 players
40
20 2/3-mean, 15-18
players
0 1/2-median
1 2 3 4 5 6 7 8 9 10
time
Nagel 1995, Camerer, Ho AER 1998)
11T a b le 6 .2
C h o ice C la ssifica tio n A cco rd in g to D ep th o f R ea so n in g k in 1 0 -R o u n d
S essio n s
_ _ _ _ _ _ _ _ _ _ _ _ _ _ _ __ _ _ _ _ _ _ _ _ _ _ _ _ _ _ _ _ _ _ _ _ _ _ _ _ _ __ _ _ _ _ _ _ _ _ _ _ _ _ _ _ _ _ _
1 /2 -M ed ia n S essio n
R ound 1 2 3 4 5 6 7 8 9 10
k> 3 0 0 0 0 .1 5 0 .0 8 0 0 .1 5 0 .2 3 0 .6 2 1 .0 0
k= 3 0 .0 8 0 .0 8 0 0 0 .0 8 0 .0 8 0 .3 1 0 .3 1 0 .2 3 0
k= 2 0 .3 8 0 .3 1 0 .6 2 0 .4 6 0 .3 1 0 .5 4 0 .5 4 0 .4 6 0 .1 5 0
k= 1 0 .5 4 0 .3 8 0 .3 1 0 .1 5 0 .0 8 0 .1 5 0 0 0 0
k= 0 0 0 .2 3 0 .0 8 0 0 .0 8 0 .0 8 0 0 0 0
k< 0 0 0 0 0 .2 3 0 .3 8 0 .1 5 0 0 0 0
1 /2 -M ea n S essio n
R ound 1 2 3 4 5 6 7 8 9 10
k> 3 0 0 0 0 0 .0 7 0 0 .1 4 0 .0 7 0 .0 7 0
k= 3 0 0 .1 4 0 0 0 .0 7 0 .1 4 0 .2 9 0 .1 4 0 .1 4 0
k= 2 0 .0 7 0 .1 4 0 .3 6 0 .2 9 0 .1 4 0 .3 6 0 .5 7 0 .2 9 0 .2 9 0 .5 0
k= 1 0 .7 1 0 .5 7 0 .4 3 0 .5 7 0 .7 1 0 .2 9 0 0 .2 9 0 .2 9 0 .2 9
k= 0 0 .1 4 0 0 .1 4 0 0 0 .1 4 0 0 .1 4 0 0
k< 0 0 .0 7 0 .1 4 0 .0 7 0 .1 4 0 0 .0 7 0 0 .0 7 0 .2 1 0 .2 1
1 /2 -M a x im u m S essio n
R ound 1 2 3 4 5 6 7 8 9 10
k> 3 0 0 0 0 0 0 0 0 0 0 .0 7
k= 3 0 .0 7 0 .1 3 0 0 0 0 0 0 0 0 .0 7
k= 2 0 .4 0 0 .5 3 0 .4 0 0 .1 3 0 .0 7 0 .2 7 0 0 .7 3 0 .0 7 0 .8 0
k= 1 0 .3 3 0 .3 3 0 .4 0 0 .8 7 0 .6 7 0 .7 3 0 .8 0 0 .2 7 0 .6 7 0 .0 7
k= 0 0 .2 0 0 0 .0 7 0 0 .2 0 0 0 .1 3 0 0 .0 7 0
k< 0 0 0 0 .1 3 0 0 .0 7 0 0 .0 7 0 0 .2 0 0
_ _ _ _ _ _ _ _ _ _ _ _ _ _ _ __ _ _ _ _ _ _ _ _ _ _ _ _ _ _ _ _ _ _ _ _ _ _ _ _ _ __ _ _ _ _ _ _ _ _ _ _ _ _ _ _ _ _ _
N o te. U n d erlin ed n u m b ers in tab le are m o d al freq u e n cies. R ep rin ted w ith
p erm issio n fro m D u ffy & N a g el (1 9 9 7 ). 12Models that have been applied/developed with the different
beauty contest data sets
In the first period:
• Iterated dominance
• Iterated best response model = level of reasoning model
(typically 1-3 levels) (Nagel, AER 1995; Stahl, GEB 1996; Camerer, Ho AER
1998)). See also: Costa-Gomes and Crawford AER 2006.
• Bayesian reasoning model (Stahl JEBO 1998)
• Cognitive hierarchy model (Camerer, Chung, Ho, QJE 2004): best reply
against probability distribution of all lower levels, one parameter to estimate)
• Mixture models (Bosch, Montalvo, Nagel, and Satorra 2005)
Behavior over time
• Directional learning model (Nagel AER,1995)
• Cournot model (Nagel, AER 1995)
• Variations of reinforcement model (Stahl, GEB 1996)
• Rule learning model (Stahl, GEB 1996)
• Bayesian learning model (Stahl JEBO 1998)
• Experienced weighted attraction model (Camerer and Ho, EMA 1999)
13How to design an experiment to
separate two hypotheses?
• (Many) people don’t play equilibrium
because they are confused.
• (Many) people don’t play equilibrium
because doing so (choosing 0) doesn’t
win; rather they are cleverly anticipating
the behavior of others, with noise.
14• Why do players not play equilibrium? Here are two
possible classes of explanations:
– No clue about equilibrium behavior.
– A fully rational player might realize what equilibrium
behavior looks like, however doubts that all choose it.
• Doubt about other players' rationality.
• Belief about other players' doubts about rationality of Co-
players…
• Hard to separate observationally, since equilibrium
strategies are not in general best replies to
(random) non-equilibrium choices of other players.
• Can we design an experiment to distinguish
between these two hypotheses?
152 person guessing games
Grosskopf & Nagel (GEB 2008)
2-person Beauty-Contest Games:
Each player pick a number from 0 to 100, the person closest
to 2/3 of the mean wins.
• Rational player chooses weakly dominant strategy 0.
• N=2 is very different from N>2 (dominant strategy
equilibrium vs iterated elimination of dominated strategies)
3 treatments:
• Full info: Learn choices of others in my group.
• Partial info: Only learn if won or not.
• No info
1617
18
What has this series of
       experiments done?
• the first paper identifies some phenomena,
  very different from equilibrium behavior,
  although approaching it over time.
• the newspaper studies show these
  phenomena are robust, not a simple
  artifact of the lab
• and the N=2 paper shows that it involves
  some real confusion, not just very rational
  people with different beliefs about others…
                                           19
More Variations
20Learning
• A number of experimenters have sought to
use the dominance-solvable structure of
the game as a particularly simple
environment in which to study how
learning proceeds over time and repeated
play.
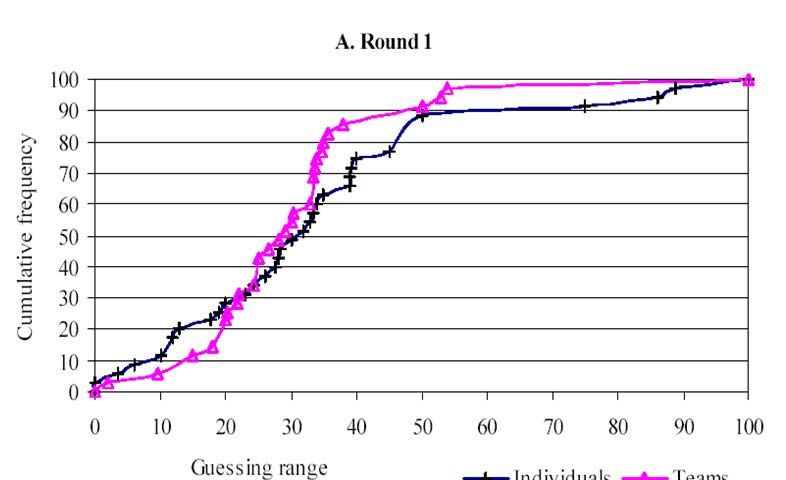
21Kocher MG, and Sutter M “The decision maker matters:
Individual versus group behaviour in experimental beauty-
contest games,” Economic Journal, 115, 200-223, JAN 2005
Abstract: Economics has devoted little attention to whether
the type of decision maker matters for economic
decisions. However, many important decisions like those
on monetary policy or a company's business strategy are
made by (small) groups rather than an individual. We
compare behaviour of individuals and small groups in an
experimental beauty-contest game. Our findings suggest
that groups are not smarter decision makers per se but
that they learn faster than individuals. When individuals
compete against groups, the latter significantly
outperform the former in terms of payoff.
Design: 17 individuals, and 17 groups of 3 people, all play
22
in one game: 4 sessions.Kocher and Sutter: Team (3 members determine a number) vs
Individual behavior within the same group: Cumulative frequency of guesses
23Slonim, Robert L. “Competing against experienced and
inexperienced players,” Experimental Economics, 2005, 55-75
Abstract: In certain markets success may depend on how well
participants anticipate the behavior of other participants who have
varying amounts of experience. Understanding if and how people's
behavior depends on competitors' level of experience is important
since in most markets participants have varying amounts of
experience. Examining data from two new experimental studies
similar to the beauty contest game first studied by Nagel (1995), the
results indicate that (1) players with no experience behave the same
against competitors with and without experience but (2) players
quickly learn to condition their behavior on competitors' experience
level, causing (3) behavior to stop moving toward the equilibrium
whenever new players enter the game and (4) experienced players
to earn more money than less experienced players. The paper
discusses the implications of the results for understanding and
modeling behavior in markets in which participants have different
amounts of experience.
2425
Slonim, Experimental Economics 2005

                                      26
Time is money, JEBO, Kocher and Sutter, 2006
27Weber, Roberto A. “'Learning' with no feedback in a
competitive guessing game,” Games and Economic
Behavior, 44,1,134-144, JUL 2003
Abstract: An assumption underlying current models of learning in
games is that learning takes place only through repeated
experience of outcomes. This paper experimentally tests this
assumption using Nagel's (1995, Amer. Econ. Rev. 85, 1313-
1326) competitive guessing game. The experiment consists of
several periods of repeated play under alternative feedback
conditions, including no-feedback conditions in which players
receive no information between periods. If learning takes
place only through reinforcement resulting from experienced
outcomes, choices in the no-feedback conditions should not
converge towards the Nash equilibrium. While less than under
full information, there is convergence towards the equilibrium
prediction in the no-feedback conditions. Varying priming
given to subjects between periods does not affect the results
2829
30
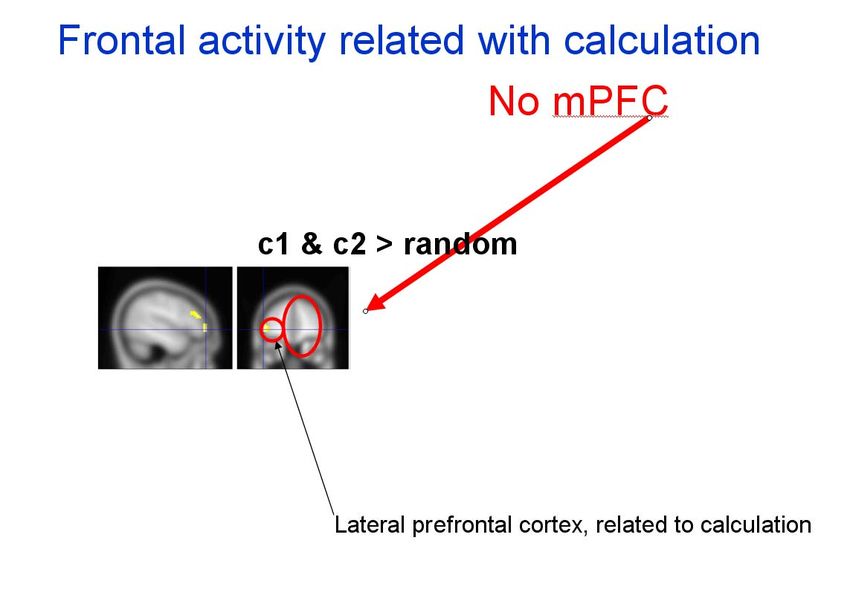
Neural correlates of depth of strategic reasoning in medial prefrontal
                                    cortex
                  by Giorgio Coricelli and Rosemarie Nagel

•    In the human condition, each participant of a group of 10 was asked
     to choose an integer between 0 and 100. In the computer condition
     one participant chose one number between 0 and 100 and a
     computer algorithm chose uniform randomly (and independently of
     the multiplier parameter) nine numbers between 0 and 100. The
     prize for the winner, whose number was closest to a known M (e.g.,
     M=2/3) times the average of all choices, was 10 euros .... The
     computer condition should invoke low levels of reasoning (at or near
     level 1) according to the iterative reply model. In contrast, in the
     human condition a higher variety of levels of reasoning should be
     observed since players might have different ideas what other
     players choose. To be able to identify brain activity related to mental
     calculation most likely involved when deciding in the game, we
     introduced calculation tasks in which subjects were asked to multiply
     a given parameter or the square of a parameter with a given integer.
                                                                             31
Motivation for neuro economics guessing game study
(from Coricelli, Nagel 2008)
• We offer an interesting task for neuro scientists to
think about thinking of others: interactive and with incentives
• Behavioral economists have developed
models of behavior (fairness, reasoning, choice, etc)
• Here:
– choices indicate levels of reasoning
– But differentiation between random behavior and levels of
reasoning may be difficult to detect
• Can neuro science techniques help us to
differentiate between
random vs low vs high levels of reasoning
• Lesion studies in our context (still to come)
32Example of MRI scanner
Scanner
a very powerful electro‐magnet
field strength of 3 teslas (T),
~60,000 times greater than the
Earth’s field
During the experiment:
subject lies in the scanner and is
exposed to the stimuli
scanner tracks the signal throughout
the brain
33Nature of fMRI activation
¾When a brain area is more active it consumes more oxygen
¾Changes in blood flow and blood oxygenation in the brain
are indirect measures of neural activity
(Blood Oxygenation Level Dependent (BOLD) signal)
• Data is usually transformed into
“activation” maps
• Activation maps show which parts of the
brain are involved in a particular mental
process
34Experimental design
Conditions
Guessing game (session 1)
Human Computer Random
Target number = 2/3 *(mean all Target number = 2/3 *(mean all
numbers) numbers) Choose a number between 0-100
Choose a number between 0-100 Choose a number between 0-100
Calculation task (session 2)
Calculate Calculate Random
2/3 * 2/3 * 66
2/3 * 66 Choose a number between 0-100
35Experimental design
– 10 participants in each “session” (2 groups)
– one after the other person in scanner
– A subject pronounced the numbers speaking into a
microphone in the scanner
– Parameters : 0.20, 0. 33,…. 1 …1.25, 1.66, 1.75
– 26 choices (13 human, 13 computer, 13 random)
– Contrast: Calculation tasks: 2/3 *40, ½*1/2*40
– NO info after a period
– Decision time measured
– All periods paid (10 euros per period)
36Time course
8 - 14 s
2s
Say a number
Human
Target number = 2/3 *(mean all
numbers)
Choose a number between 0-100
Press the button when ready
5s
Choice related
Human
neural activity
Target number = 2/3 *(mean all
numbers)
Choose a number between 0-100
37Classification of types
Low level Random play
High level
TYPES
High level N=6,
Low level N=10,
Random play N=4.
We measure the level of reasoning of a subject as the smallest quadratic
distance between actual play and the theoretical value (iterated best reply38
model).Human > Computer
random effect analysis N=20
x=0 y=48
z=24
We found enhanced activity in the medial prefrontal cortex (MPFC), ventral
anterior cingulate, [superior temporal sulcus (STS)] and bilateral temporo-parietal
junction (TPJ) in human vs. computer condition 39Dorsal and ventral MPFC:
high-low distinction
High level of reasoning Low level of reasoning
High level: Third person perspective Low level: Self referential thinking
(dorsal MPFC) & thinking about others as Anterior Cingulate Cortex (ACC), our
“like me” (ventral MPFC) interpretation thinking of others as
random players
4041
42
Strategic IQ
                                                              0.25

      m e a n p a ra m e te r e s tim a te s (0 ,4 8 ,2 4 )
                                                              0.20
                                                                                                    Each dot is mean of single subject
                                                              0.15

                                                              0.10

                                                              0.05

                                                              0.00
                                                                      0   500           1000            1500     2000
                                                              -0.05

                                                              -0.10

                                                              -0.15

                                                              -0.20
                                                                            distance to the winning number

                                                                            Increasing strategic IQ

   The activy in the MPfC is correlated (r = 0.67, P = 0.005) with our
measure of Strategic IQ (the mean quadratic distance between own
choices and winning number of each trial); the lower the QD the closer                                                             43
to the winning number.
Conclusions (neuro economics study) Sophisticated thinking and strategic IQ: level 2: best reply and belief that others also do best reply => differential activation in mPfC Thinking about others as random players does not activate mPfC, but instead ACC (level 1) TPJ and STS shows high activity for both level 1 and 2: thus a more general area of planning Calculation tasks don’t activate mPfC. ⇒Separation of types of thinking mapped in the brain. ⇒Experimenter does not induce type of thinking unlike in most neuro science studies ⇒Future work: designing experiments to find more different types (random and equilibrium types) 44
Main results of behavior in the different treatments
                         (Nagel)
in the first period:
• clear distinction between different types of players, heterogeneity
• clear differences in behavior for different parameters p (e.g.,½ and 2/3)
• clear differences for different group sizes (e.g., 3 players vs 15 players),
    team vs indiv., experiences vs. non-experienced players
• low levels of reasoning, between 0 and 3 in most treatments, few
    equilibrium choices in student groups (thus few types only!)
• differences between different subject pools (game theorists vs students,
   newspaper population seems to be a mixture of student group and game theorist
   group)

behavior over time:
• (slow) convergence towards equilibrium in most treatments
• differences in convergence for different p and group sizes
• feedback matters for convergence
• continuous low level of reasoning
• slower convergence when prize is variable instead of fixed
                                                                              45
• the behavior has been explained by various models
Importance for economics
(Nagel)
• How does the reasoning process come about: randomly,
cognitive process, deep vs low levels of reasoning.
– Purposeful thinking or randomness.
• Interesting differences of cognition between level 1 and
level 2 (made visual through brain data)
• Similar reinforcement learning, fictitious play vs Influence
learning (Hampton et al.) = level 1 vs level 2!
• Thus through fMRI we find interesting connections
between learning and reasoning. It does not matter
whether actual data of opponent is given or whether this
data is simulated by the subject.
• fMRI knowledge interesting to screen people?
– Correlation between cognition and behavior made visible
– Can people say what and how they think: e.g random behavior
46Homework
• Write a 1 page “referee” report on Chou et al. (which is in
the “Handouts” section of the course web page). Take a
large view, and focus on what you think this work (and
the work it refers to) tells us about the
usefulness/limitations of experiments generally to tell us
about theories of rationality, about the
usefulness/generality of such theories, of experiments,
etc.
– Chou, Eileen, Margaret McConnell, Rosemarie Nagel and
Charles R. Plott “The control of game form recognition in
experiments: understanding dominant strategy failures in a
simple two person “guessing” game,” Experimental Economics,
forthcoming (2009).
• Read the Handbook chapter on public goods, in
preparation for next week’s class. 47You can also read