Network Performance Data State Broadband Initiatives
←
→
Page content transcription
If your browser does not render page correctly, please read the page content below
Network Performance Data
           for
State Broadband Initiatives

            Best in Class
         Crowdsourced Data
                 for

  •   Broadband Effort Prioritization
  •   Remote Educational Connectivity
  •   Indoor Coverage / Public Safety
  •   Telecom Industry Negotiation
  •   Right-of-Way Planning

                                  Copyright 2021, Ookla, LLC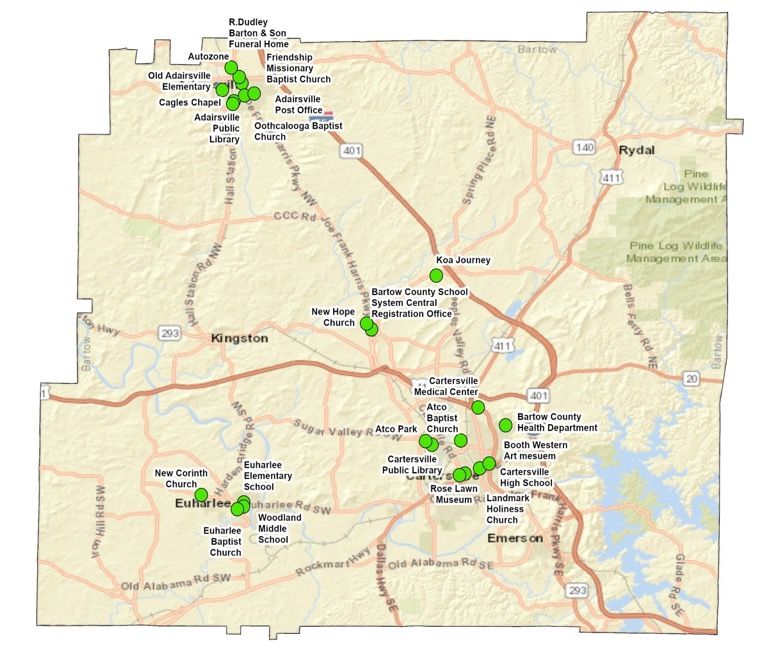
Ookla®
The global leader in mobile and broadband network intelligence,
testing applications and technology. Internet service providers,
mobile network operators, businesses and government agencies
alike rely on Ookla for unparalleled and immediate information
on the state of networks and online services.

Trusted by the Public
•   Hundreds of millions of users
•   10+ million tests taken every day (34+ billion tests to date)
•   Anonymized data ensures privacy and GDPR compliance
•   Clients include every major telecom provider in the United States

Speedtest has the most …
         Users             Tests              Data             Insight

                                                                         Copyright 2021, Ookla, LLC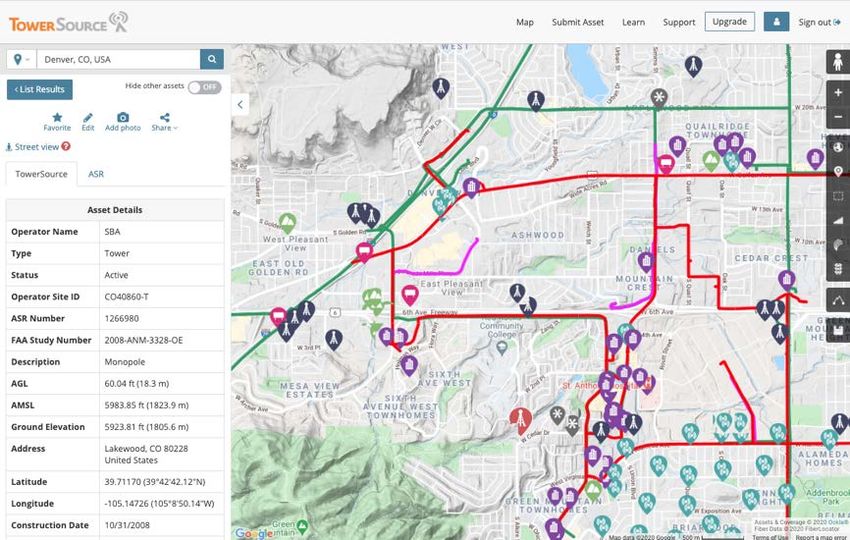
Speedtest Server Network™ has over 1,600
                                               servers in United States & U.S. Territories

 2020 Speedtest Stats
 for the United States

        293 million
       tests combined on
   fixed & wireless networks

            taken on

         58 million                                                                     as of Dec, 2020
        unique devices

      Key Stat

    includes 154 million
tests with GPS precision location

                                    Copyright 2021, Ookla, LLC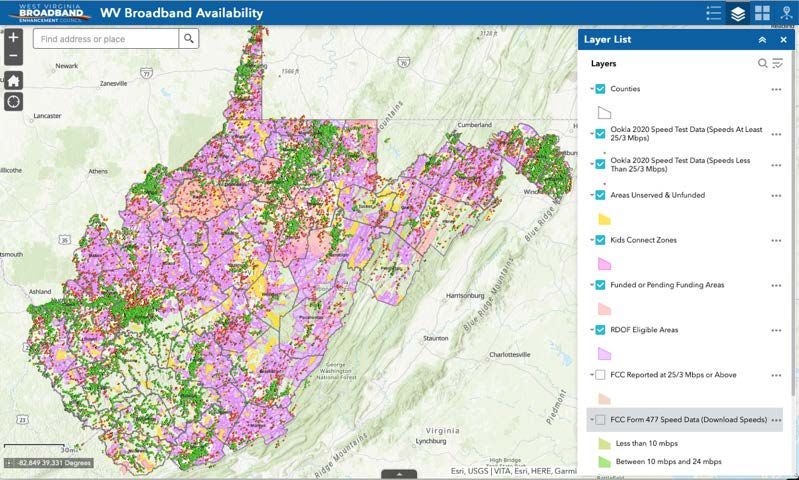
Industry Leadership & Partnerships
As the de facto internet intelligence standard, Ookla fixed and mobile data is used by the U.S.
Federal Communications Commission (FCC) for internal analysis, reports to Congress and
public documents on the status of the telecommunications marketplace.

Ookla supplies the National Telecommunications Information Agency (NTIA) with access to our
Speedtest measurement data for fixed and wireless networks as well as intelligence on wireless
network coverage to support their efforts to build the National Broadband Availability Map.

Ookla is the exclusive provider of global network performance data to GSMA Intelligence
(GSMAi), a trade body that represents the interests of mobile operators worldwide, uniting
more than 750 operators with almost 400 companies in the broader mobile ecosystem.

As official members of the ITU-T (Study Group 12), Ookla partners with leading global
operators, test and measurement companies, infrastructure and hardware providers, network
analytics providers and regulators to help develop and define quality of service (QoS) and
experience (QoE) standards.

                                                                                           Copyright 2021, Ookla, LLC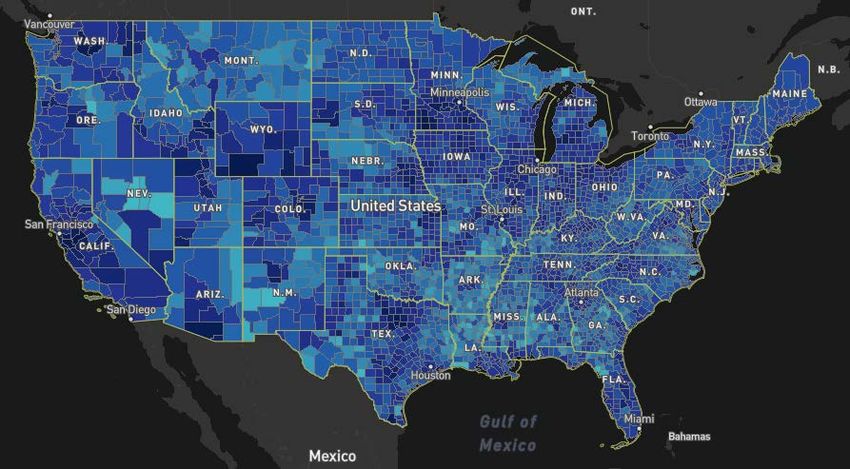
Problems / Challenges with Broadband Investment

 • Lack of dependable, consistent data sources
 • Federal data is out of date, incomplete and self-reported
 • Lack of location detail in data
 • Rural communities a patchwork of Have/Have Not
 • Defining Accessibility vs. Affordability
 • Variability in federal programs (CAF, RDOF, Rural 5G, etc.)
 • Ongoing operator compliance after subsidized build-out
How do Governments Use Speedtest Data?

Map service availability     View mobile network coverage

Define underserved areas     Hold operators accountable

Filter metrics by operator   Analyze high-traffic areas

Track network development    Inform policy decisions

                                                          Copyright 2020, Ookla, LLC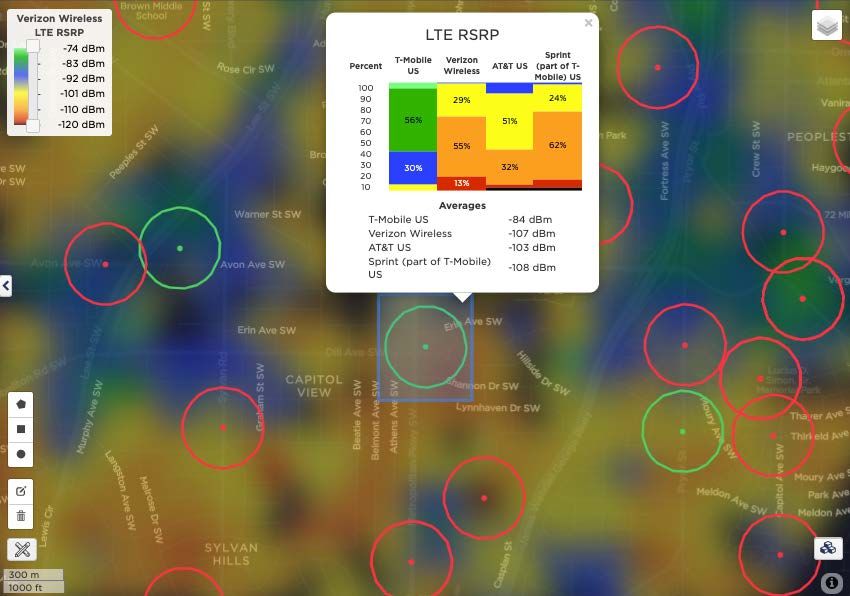
Federal
                        Communications
                        Commission
                                         Fixed Broadband Deployment
How Many
Americans Lack
Broadband?

FCC says
           21 million
Microsoft says
       162 million
The truth is
likely somewhere
in between.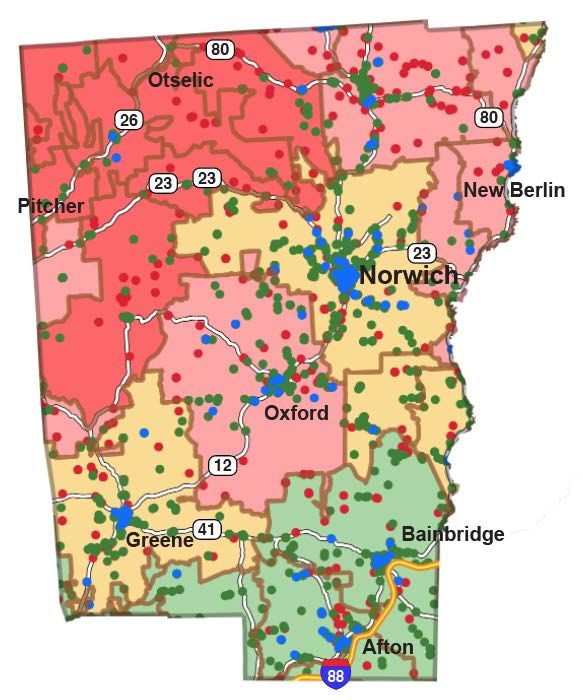
Examples of Local
Speedtest                           Collection Efforts
Intelligence®

Why do states need to
supplement their data
collection efforts?
                                     As of Jan 29, 2021     Maine        Minnesota           Washington           Wyoming
                                           Announced
•   Lack of historical data                               Nov 24, 2020   Aug 3, 2020         Jul 30, 2020          Jul 18, 2019
                                           launch date
•   Participation will decrease             Test count
    without constant enagement                              14,478          47,716              33,054†               2,754*
                                          since launch
•   Search engine results and app
    stores will not present your    Weeks operational         9.5            25.5                  26                    79
    test near top of 1st page
                                          Local Efforts
                                                             1,524           1,871                1,271                 35
•   Need for greater volume!         Average per week
    Speedtest® is collecting an      2020 Speedtest™
                                                           1,124,573      5,071,852            8,345,312             445,476
    average of 60x more tests          measurements
                                                Ookla
                                                            21,626         97,536               160,486               8,567
                                     Average per week
                                                                                                           †Test count as of 2/3/12
                                                                          *Likely out of date. Test count has not recently changed

                                                                                                                    Copyright 2021, Ookla, LLC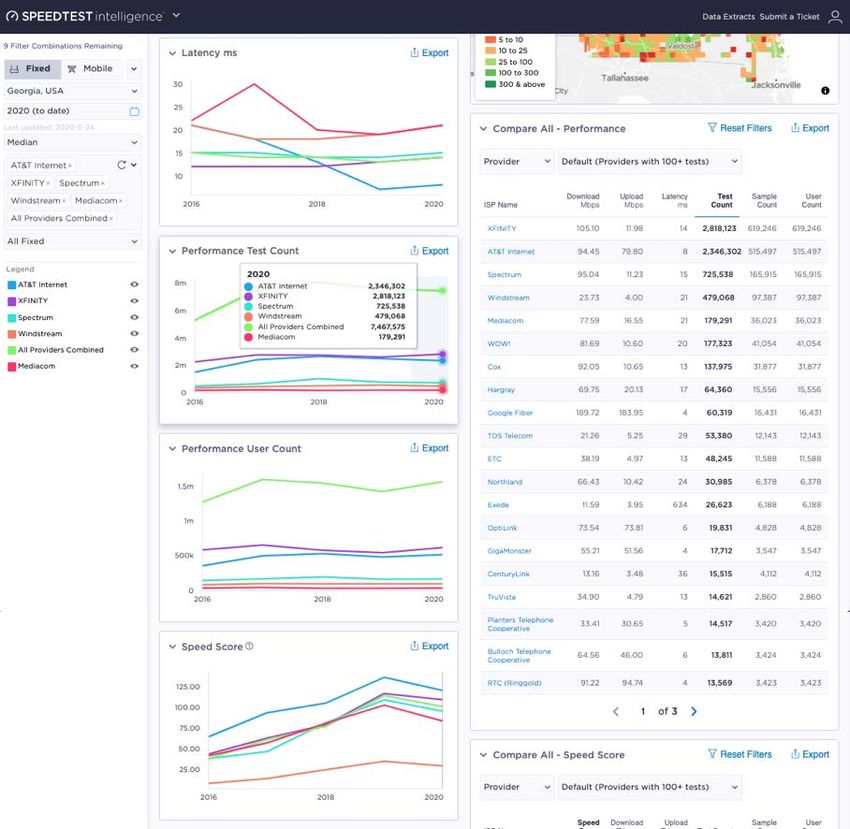
Public Adoption and Review Statistics

           App Name

                     Icon

             Publisher             NACo                       FCC                       Ookla

          User Rating

               Reviews               26                      1,634                    1,245,025
                 Installs         5,000+                  100,000+                 100,000,000+

                     Fact   The Speedtest by Ookla app is installed on iOS and Android devices
                            at a rate of 20 million times a quarter – close to 10,000 installs every hour.
Stats as of 12 Feb 2021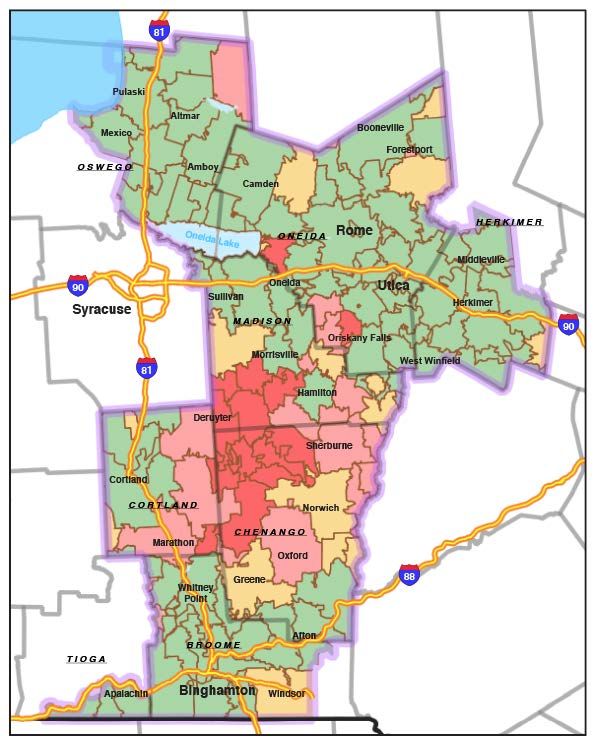
Better Data Means
Better Decisions

• A small investment in better data can
  inform better decisions
• Target areas where broadband is
  needed most
• Avoid over-building and harming
  existing businesses
• Analyze using your demographics —
  do the most good, for the most people
• Prioritize fiber in the Right-of-Way
Speedtest
Intelligence®
Portal

Example:

Georgia

All Fixed
Operators

YTD* 2020
    *As of Nov 25
Speedtest
Intelligence®
Portal
Example:
Georgia
All Fixed
Operators
YTD* 2020
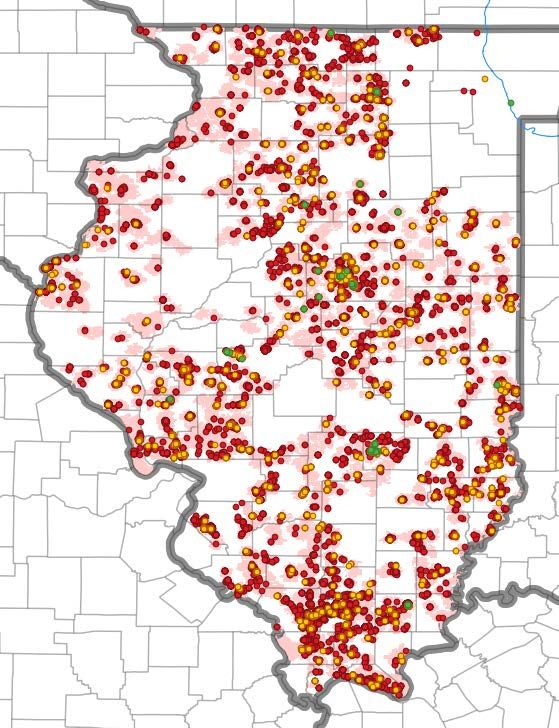
*As of Nov 25Example: Speedtest®
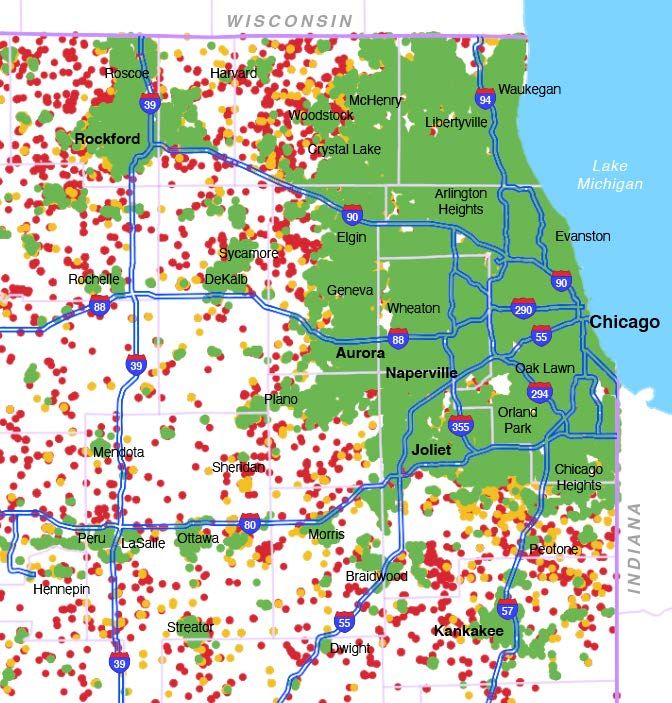
Northeast Illinois Measurements
Nov 2019 – Jan 2020
Less than 25 Mbps
Consumer-Initiated Fixed
Network Performance
• Fixed operators tested via
Android and iOS devices
• Filtered for records with GPS-
provided longitude and latitude
25 - 100 Mbps
100+ Mbps
Copyright 2021, Ookla, LLCExample:
Northeast Illinois
Nov 2019 – Jan 2020
Consumer-Initiated Fixed
Network Performance
• Fixed operators tested via
Android and iOS devices
• Filtered for records with GPS-
provided longitude and latitude
• Layering with highest speeds on
top allows underserved areas
(RED) to clearly show through
Speedtest®
Measurements
Less than 25 Mbps
25 - 100 Mbps
100+ Mbps
Copyright 2021, Ookla, LLCExample:
Northeast Illinois FCC Form 477
Nov 2019 – Jan 2020 Submission
Frontier DSL
Consumer-Initiated Fixed service area
Network Performance
• Fixed operators tested via
Android and iOS devices
• Filtered for records with GPS-
provided longitude and latitude
• Compare test results to each
ISP’s Form 477 footprints
Speedtest®
Measurements
Less than 25 Mbps
25 - 100 Mbps
100+ Mbps
Copyright 2021, Ookla, LLCSpeedtest
Intelligence® Download Speeds
Consumer-Initiated
Fixed Network Median Speeds
by Zip Code
Performance
Less than 10 Mbps
Example: 10 - 25 Mbps
25 - 50 Mbps
New York 50+ Mbps
Congressional District 22
All Operators
Jan – Jun 2020
Copyright 2020, Ookla, LLCSpeedtest
Intelligence® Download Speeds
Consumer-Initiated
Fixed Network
Performance
Example:
New York
Congressional District 22
All Operators Speedtest®
Jan – Jun 2020 Measurements
Less than 25 Mbps
25 - 300 Mbps
300+ Mbps
Copyright 2020, Ookla, LLCSpeedtest
Intelligence® 13155
13464 Download Speeds
13460
13832
13411
Consumer-Initiated 13136
13815
Fixed Network Median Speeds
13843 by Zip Code
Performance
Less than 10 Mbps
Example: 10 - 25 Mbps
13801 25 - 50 Mbps
Chenango County, NY 13870 50+ Mbps
All Operators 13778
13830
Jan – Jun 2020 Speedtest®
13733
Measurements
Less than 25 Mbps
13787 13730 25 - 300 Mbps
300+ Mbps
13813
Copyright 2020, Ookla, LLC2020 Tribal Lands
Broadband Performance
Median
Download Speed
Tribal
Lands
Copyright 2021, Ookla, LLCExample:
Idaho County, ID
Year 2020
• Identify where people are and where
they are not
National Forest or
Wilderness area
Tribal
Lands
Copyright 2021, Ookla, LLCExample:
Idaho County, ID
Year 2020
• Identify where people are and where
they are not
• Zip codes can represent extremely
large areas
• Pinpointing communities in need
helps prioritize funding
• Tribal lands offer additional funding
opportunities
Speedtest® Median Speeds
Measurements by Zip Code
< 10 Mbps < 10 Mbps
10 - 25 Mbps 10 - 25 Mbps
25 – 50 Mbps 25 - 50 Mbps
50 – 100 Mbps 50+ Mbps
100 – 300 Mbps No Zip Code
300+ Mbps assigned
Tribal
Lands
Copyright 2021, Ookla, LLCEducation Lessons from the Pandemic:
Using Crowdsourced Data to Improve:
• Remote Classrooms
• the Homework Gap
• the Digital Divide
“The Georgia Department of Education is using Ookla Cell Analytics to
assist our district with the placement of mobile cellular based Wi-Fi
transmitter devices. This tool takes away the guesswork of identifying areas
of placement with the highest cellular signal strength for the best student
experience possible. These Wi-Fi devices will give students in areas with no
home connectivity the ability to gather for instructional purposes while
practicing social distancing.”
— Chris Shealy, Director of Technology Services
Georgia State Department of EducationCell Analytics™
Signal strength
and quality
Performance, coverage and
signal measurement data
Unlike data collected by traditional
methods such as drive testing and walk
testing, the real-world measurements in
Cell Analytics are collected where
consumers are actually connecting to
networks — on streets, inside vehicles, at
home, at work and other locations — with
Tower locations
high location accuracy.
Combined with data on cell site locations,
tools to prioritize optimization and
deployment efforts, and competitor
comparisons, Cell Analytics provides a
comprehensive platform for mobile
network operators to understand their Indoor
networks and identify the areas that need coverage
improvement.Georgia Site Selection
Potential site locations were selected for evaluation as
follows, considering where the students were concentrated:
1. School, library, government-owned location
2. Church or other community gathering location
3. Areas lacking the above locations, determined by accessibility of parking
lots, crossroads and other open areas that allow for safe parking
Locations were then evaluated for cellular carrier performance characteristics using:
• Information from the Cellular Carriers
• CellAnalytics (Ookla)
• TowerSource (Ookla)
• Publicly available databasesCell Analytics™
Solving for
where Wi-Fi/LTE
hotspots will work
Schools
Libraries
Signal Strength
Strong
Medium
Weak
Copyright 2021, Ookla, LLCSite Evaluation Criteria
1. Previously recommended by a carrier
2. Within 1.5 miles of tower miles of tower miles of a tower
(carriers do not disclose which towers they are on therefore it could not
be determined whether or not the carrier had equipment on a particular tower)
3. Performance
a) Reference Signal Received Power (RSRP) — power received from a single device
• Typical range is around -44dbm (good) to -140dbm (bad)
• The closer the number is to 0, the better the signal
• Anything below -120 dBm was not considered
b) Downlink Throughput — speed in megabits per second (the higher the better)
• Best locations are those with speeds >20 Mbps
• Locations showing 10-20 Mbps should work
• Locations showingGeorgia Site Selection Each site location was defined with signal strength readings and network speeds for the network equipment being deployed.
Bartow County, Georgia
Deployment Site Map

Visualizing available locations
helped local authorities to define
and communicate the locations
that met the criteria and had the
highest chance of success.
TowerSource™

Wireless network
asset intelligence

TowerSource by Ookla® is the
U.S. tower industry’s largest
and most comprehensive
independent vertical asset
database. With views into tower
and other asset locations,
TowerSource’s easy to use SaaS
platform informs data-backed
decisions regarding site
evaluation and acquisition,
competitor benchmarking, and
site portfolio revenue
management.

                                  Copyright 2020, Ookla, LLC
scdigitaldrive.com
Areas of Need
Best Technology Available
County-by-County
Scorecard
County Broadband Atlas
Copyright 2021, Ookla, LLCWest Virginia Announces “Most Accurate Broadband Map to Date”
Excerpt – Nov 30, 2020
“Previous broadband availability maps —
such as those provided by the FCC — relied
on information from carriers and used the
speeds they were advertising in an area, not
the speeds actually received by consumers
Our first-of-its-kind map instead
uses actual speed data from
consumers, and the result is now
the most accurate, detailed map
of where broadband is and is not
in the state of West Virginia.”
— Delegate Daniel Linville
The map was completed recently with
financial support from the National
Telecommunications and Information
Administration, the West Virginia
Department of Commerce and state
Development Office’s Office of Broadband.
Thanks to a grant, the state partnered with
Ookla, the developers of www.speedtest.net
Copyright 2020, Ookla, LLCSpeedtest Custom® Use the power of Speedtest to engage directly with your citizens by encouraging data collection. This configurable, mobile-friendly, HTML5-based testing solution is the industry gold-standard used by major telecommunications companies around the world. • Put Speedtest directly on your own state or local website • Embed your test on up to 200 web pages • Use the global Speedtest Server Network™ • View Snapshot stats for the previous days • Download individual results • Link to your own broadband survey • Use survey to capture reports from no-service areas
Use Publicity and Social Media to Generate Additional Data
Enlist the public to supplement more
testing where needed
We have ready-to-use social media graphics to
help drive citizen engagement.
Promote the free Speedtest app on social media
platforms to encourage use.

•   Maximize the effect of the largest user community
•   Build on a massive existing database
•   City and county governments can encourage use
•   Advocacy groups can involve constituents

                                                        En Español

                                                                     Copyright 2020, Ookla, LLC
Outreach for Increased Testing
Dougherty County, Georgia (Albany)
82% Increase in Speedtest Measurements
comparing 1st wk Jun to 1st wk July
First week of July
First week of June
Albany Herald
July 5th
Governor’s Press Release — June 23rdNew Speedtest Feature – Video Testing
• Launched Monday, February 8th,
2021 for iPhones
• Coming soon to Android devices
• Plays video to specifically measure
performance of video streaming
• Tests at multiple bitrates from low
resolution to high definition
• Informs the user in easy to
understand examples how devices
will perform with their current level
of connectivity
Copyright 2021, Ookla, LLCDistance Learning & the Digital Divide
Major School District Trial Underway
Speedtest Powered — Mobile SDK
• Internet connectivity has become a paramount issue
for students to learn from home
• Trigger Speedtest measurements programmatically
on Android & iOS
• Prepare for what’s ahead and collect data while
respecting privacy and security lawsNetwork Performance Data for
State Broadband Initiatives
Bryan Darr Rob Perry
Vice President, Smart Communities Sales Director, Govt. Accounts
Bryan.Darr@Ookla.com Rob.Perry@Ookla.com
Copyright 2020, Ookla, LLCYou can also read