2020 Numisheet benchmark study uniaxial tensile tests summary
←
→
Page content transcription
If your browser does not render page correctly, please read the page content below
2020 Numisheet benchmark study uniaxial tensile tests summary

                              Evan Rust, William E. Luecke, Mark A. Iadicola 1

                                                       29 April 2020

1. Introduction
This report describes the test equipment, process, analysis, and data file formats for the 2020 Numisheet
benchmark study tensile testing of the four materials associated with the Numisheet conference
benchmarks. The four materials include two steel alloys, DP980 for Benchmark 1 and DP1180 for
Benchmark 2, and two 6000 series aluminum alloys, AA6xxx-T4 for Benchmark 1 and AA6xxx-T81 for
Benchmark 2, that will be referred to here as BM1-DP980, BM2-DP1180, BM1-6xxx-T4, and BM2-
6xxx-T81, respectively. The testing reported here was requested by the 2020 Numisheet Benchmark
Committee and was performed by the Center for Automotive Lightweighting (NCAL) in Gaithersburg,
MD. The tests were performed at NCAL from October 2019 through January 2020. The summary table
file, “Numisheet 2020 Uniaxial Tension Test Summary Table.csv”, contains the names of each data file
with key aspects of each test noted (see Table 2. Column descriptions for tensile test summary table file
(“Numisheet 2020 Uniaxial Tension Test Summary Table.csv”).). The data files described below contain
the processed results of Digital Image Correlation (DIC) measurements, and therefore this report
describes the basis for the parameters used for the DIC analyses. This report and the described data files
are available at doi:10.18434/M32202.
NOTE: In the summary table file and occasionally in this report there are unique identifiers used by the NCAL database to
identify specific tests or specimens. These are included so that any future inquiries regarding specific test results can be
efficiently traced back to the raw data files, images, stereo-DIC system hardware, calibrations used, etc. These identifiers
typically follow the format A######-AAA-### (potentially followed by additional numbers and letters) where the leading “A”
could be “L”, “E”, or “S”. In this report, these numbers will be delineated using a separate sans-serif font and brackets, e.g.,
[L191210-WEL-001].

2. Test Methods
The uniaxial tension tests were performed using a universal testing machine in the NCAL laboratory in
accordance with the ASTM E8 standard [2]. The testing machine has a lower moving hydraulic actuator
and a fixed upper crosshead where the loadcell is attached. Each specimen was taken to fracture of the
specimen into two pieces. The face of the test specimen, across the width and along the reduced parallel
section, is measured throughout the test using a stereo-DIC system. Tests were performed with
specimens fabricated from the sheet material at every 15° increment from the rolling direction to 90° to
the rolling direction. For each orientation and material three repeat tests were performed. In this report,
the results for all the tests are reported including each repeat test; there is no averaging between the repeat
tests.

2.1. Specimen
Figure 1 shows the ASTM E8 rectangular tension test specimen geometry used for these tests. Reported
dimensions are the average of three measurements made on the center and at each end of the reduced

1   please direct all questions regarding this data and report to Mark Iadicola: mark.iadicola@nist.gov

                                                                                                                          1 of 18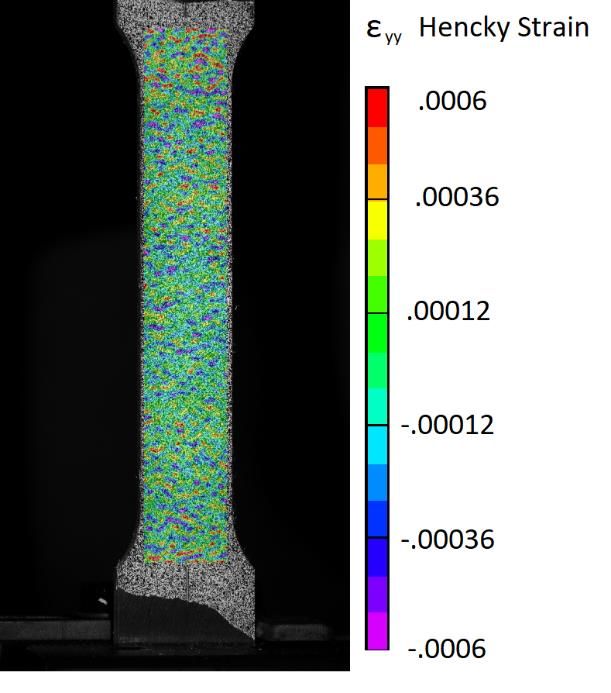
parallel section of the test specimen. The specimens were fabricated with an abrasive waterjet cutter from
sheet material.
Figure 1: ASTM E8 [2] rectangular tension test specimen used for uniaxial testing (nominal dimensions in mm).
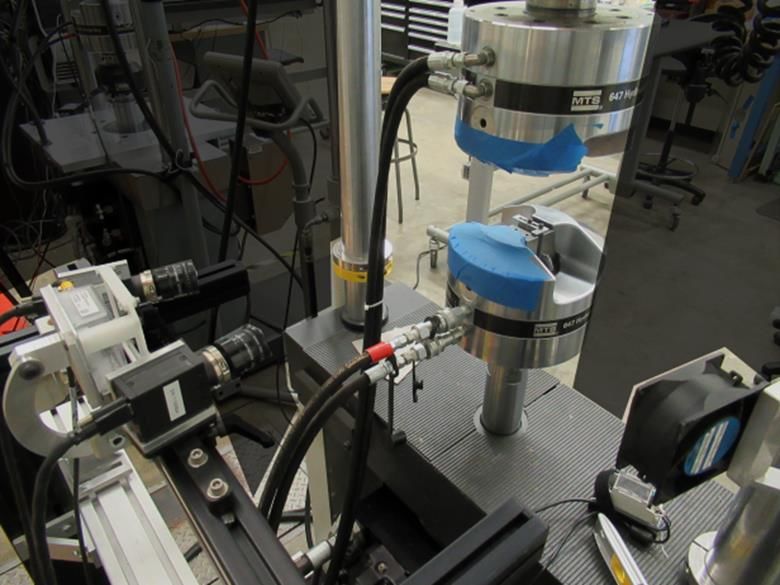
2.2. Mechanical testing equipment
Figure 2 shows the testing machine and the location of DIC cameras and lighting. The testing machine
alignment met ASTM E1012 Class 5. [1]
Figure 2: NIST uniaxial tension testing machine with stereo DIC camera system.
2.3. Test Protocol
Each test consists of two segments: a ramp in force control to bring specimen to zero force followed by a
tension ramp in displacement control until the specimen fractures. In most tests the image acquisition rate
was 2 images per second during the initial elastic loading segment, and then 1 image per second for the
subsequent plastic portion. Relevant test details are:
Actuator velocity: 0.855 mm/min
Nominal strain rate: 0.015 mm/mm/min = 0.00025mm/mm/s (ASTM E8 standard rate)
2.4. DIC test equipment and analysis
The local strains in the test specimen are measured using digital image correlation from a speckle pattern
applied to the face of the test specimen. To create the speckle pattern, the specimen is spray painted with
a matte white base coat, then a matte black paint is sprayed from one meter away onto the specimen until
approximately 50 % of the specimen is covered in black paint. The resulting pattern features are on
2 of 18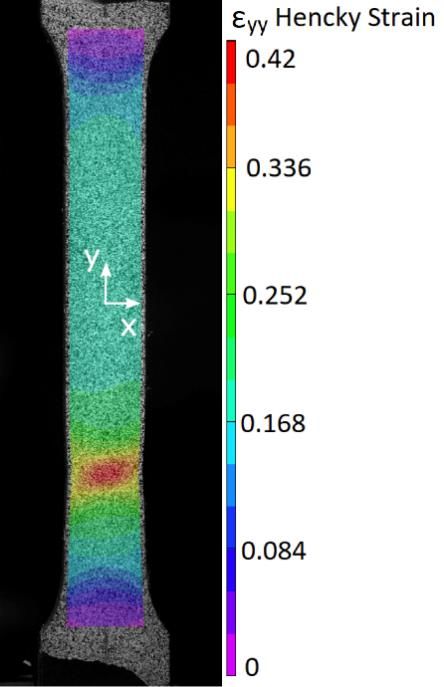
average approximately 4 pixel in size (based on a line intercept method with a minimum intensity
difference of 50 gray levels) or approximately 150 µm. The table in Section 4.4 summarizes the relevant
features of the digital image correlation equipment for the tests, as recommended by the International
Digital Image Correlation Society (iDICs) A Good Practices Guide for DIC [3]. All DIC analyses used
Correlated Solutions2 Vic-3D 8.2.4 build 525 digital image correlation software. A sensitivity study
yielded optimal DIC analysis parameters (see Section 4.5 for details). These parameters changed slightly
between tests due to changes of camera positioning between materials tested. The strain noise floor (see
Section 4.6) for each test is included in the summary table file (“Numisheet 2020 Uniaxial Tension Test
Summary Table.csv”). For most of the tests, the Hencky true strain noise floors were approximately ɛyy:
200 µm/mm and ɛxx: 250 µm/mm.
In all analyses, the coordinate system origin is positioned at the center of the specimen face with the y
axis aligned vertically along the specimen length. Figure 3 shows a typical Hencky strain distribution for
the ɛyy strain for a single image after necking. The colors designate different contours of strain.

       Figure 3: An example of a strain contour plot of a typical test after necking [E191210-ERR-331-1108].

The DIC correlation is run with each image being compared against an original reference image at the
start of the test. Near the end of the test in the high strain regions of the specimen, some points will not
correlate. When this starts to occur, the correlation mode is manually changed to 'incremental'; each
image is compared to the previous image instead of the original reference image. In most tests, about 10
of the final images are run in incremental correlation mode. For each test, the specific image number for
the transition to incremental correlation can be found in the summary table file (see Section 4.2). In some
cases the start of incremental correlation was not recorded and those are shown as ‘not recorded’ in the
file.

2 Certain commercial equipment, instruments, or materials are identified in this report in order to specify the
experimental procedure adequately. Such identification is not intended to imply recommendation or endorsement by
the National Institute of Standards and Technology, nor is it intended to imply that the materials or equipment
identified are necessarily the best available for the purpose.

                                                                                                           3 of 18
The output of each test is a strain profile of the local centerline Hencky strain at each individual time step.
The area of interest (AOI) encompasses the entire reduced parallel section of the test specimen plus a
small amount extending past each fillet. In all files, the X direction is horizontal. The Y direction is
vertical and is the tensile stretch axis. For each acquired image, the deformed coordinates (X, Y, Z) and
Hencky strain points (ɛxx, ɛyy, ɛxy) are written to an output file for 201 points spaced 0.25 mm apart along
the vertical centerline from an area of interest centered on the reduced parallel length of the specimen (see
Section 4.3). They were produced using the Vic-3D “Export metric node data” function.

3. Analysis
3.1. Engineering stress-strain diagrams
Engineering stress and strain diagrams are provided for reference only. The stress-strain curves shown in
this report were created by defining a virtual extensometer with a nominal gauge length, G = 50 mm,
centered on the reduced parallel length of the specimen. Engineering stress is calculated in the classic
method of dividing current force by initial area, based on the average width and thickness measured for
each specimen. For each material, the scales of the axes are the same for all seven orientations.

                                                                                                       4 of 18
3.1.1. BM1-DP980 engineering stress strain curves
5 of 183.1.2. BM2-DP1180 engineering stress strain curves
6 of 183.1.3. BM1-6xxx-T4 engineering stress strain curves
7 of 183.1.4. BM2-6xxx-T81 engineering stress strain curves
8 of 184. Appendixes
4.1. Naming Convention
DIC measured strain profile data are written in a comma-separated value file using a naming convention
that captures the deformation mode, orientation, material, and test specimen dimensions as explained in
Table 1.
4.2. Format of the uniaxial test summary table file
The uniaxial test summary table file (“Numisheet 2020 Uniaxial Tension Test Summary Table.csv”)
contains information about each test including file names, NCAL data base identifier, measured
geometry, noise floor, and DIC image numbers of note, see Table 2. Column descriptions for tensile test
summary table file (“Numisheet 2020 Uniaxial Tension Test Summary Table.csv”)..
4.3. Format of the local-strain files
Strain profiles are included that contain a strain trace running on the centerline of the specimen for each
experimental point on the stress-strain curve. Appendix 4.1 describes the naming convention. The strain
profile was exported using the Vic-3D function “Export metric node data”. The trace of sextuples (X, Y,
Z, ɛxx, ɛyy, ɛxy) was interpolated for X = 0 mm (i.e., along the vertical centerline) at 0.25 mm intervals in the
range -25 mm ≤ Y ≤ 25 mm, so the file contains ((50 mm/(0.25 mm/point)) + 1) x 6 = 1206 columns of
position and strain data. Figure 4 below shows where these interpolated points are located on the
specimen. The (X, Y, Z) are deformed coordinates, and the strains (ɛxx, ɛyy, ɛxy) are the Hencky true strains.
Figure 4. Data point locations on specimen length.
Following those 1206 columns are the analog signal columns; analog signals (e.g., Force) from the test
frame are captured during the test, as summarized in Table 3. Engineering stresses can be calculated from
the included force, and from the original test specimen dimension encoded in the file name. Engineering
strains can be calculated for any arbitrary gauge length from the deformed coordinates. Note that the
exported interpolated position and strain data are spaced about 8 times more closely than the size of the
virtual strain gauge.
4.4. Stereo-DIC system hardware
The stereo-DIC hardware were configured in three different setups, and the setup used for each test is
noted in the summary table file, see Section 4.2. Table 4 summarizes these three setups. A fan was used
9 of 18after Setup 1 to break up undesirable heat currents that were somewhat noticeable at low strains with
Setup 1. Setup 3 added cross-polarization between the light source and cameras to mitigate the specular
reflections of the aluminum samples, and cameras were repositioned for a larger field of view to allow for
the larger total elongation of the aluminum materials. Setup 3 is shown in Figure 2.
Table 1: Example file naming convention for a strain profile data file (e.g.,
U00FeDP1180_Numisheet2020R01T1.022W12.66.csv).
Entry Description
U Test type: U=uniaxial
00 Angle to the rolling direction in degrees, limited to two digits
Fe Major alloy component: Fe or Al
DP1180 Alloy type. DP1180, DP980, 6XXX-T81, or 6XXX-T4
_Numisheet2020 Open space for other descriptive information
R01 Repetition number from this test, in this case 01
T1.022 Specimen thickness in mm, in this case 1.022 mm
W12.66 Specimen thickness in mm, in this case 12.66 mm
.csv File type identifier
Table 2. Column descriptions for tensile test summary table file (“Numisheet 2020 Uniaxial Tension Test Summary
Table.csv”).
Column Head Description
File Name File Name (see section 4.1)
Material Material Identifier
Angle from RD (deg) Specimen orientation in respect the sheet rolling direction
Thickness (mm) Measured specimen thickness before testing, average of three
values along the reduced parallel length.
Width (mm) Measured specimen width before testing, average of three
values along the reduced parallel length.
Repeat Number Test repeat number for specimen material and orientation.
Aluminum Bake Batch The BM2-AA6xxx-T81 sheet material was baked prior to
specimen fabrication. This value identifies which sheet (bake
cycle) the test specimen came from for this material.
DIC Setup Number Three DIC setups were used during the test campaign (see
Section 4.4); this identifies which tests were run with which
setup.
Reference Img DIC reference image number
Test Start Img DIC image number when test begins (setup images are
captured before test starts).
Start Incremental Img Image number when DIC analysis switches to ‘incremental
correlation’
Final Img Last image number before test specimen failure.
Noise Floor exx, eyy, exy DIC noise floor determined (see Section 4.6).
NCAL Database ID NCAL Internal database identifier
Test Date Test Date
10 of 18Table 3: Format of the last columns describing analog signals of the DIC strain profile data files.
Column Head Description
Count Image Count
Time_0 Time from camera 0 in seconds
Time_1 Time from camera 1 in seconds
Dev2/ai0 Unscaled voltage values, ignore
Dev2/ai1 Unscaled voltage values, ignore
Dev2/ai2 Unscaled voltage values, ignore
Dev2/ai3 Unscaled voltage values, ignore
Displacement_(mm) Actuator displacement in mm
Force_(kN) Force in kN measured from 100kN load cell
Extensometer Ignore
unused Ignore
11 of 18Table 4: Summary of the stereo-DIC hardware, setup, and analysis used for the uniaxial tension tests.
Hardware and Setup Setup 1 Setup 2 Setup 3
Cameras 5 MP Point Grey Grasshopper 50S5M-C (2448 pixel x 2048 pixel)
Lenses 35 mm Schneider Xenoplan
Standoff 430 mm 480 mm
Lighting White LED array Cross-polarized LED
array and lens filters
Fan None Yes
Stereo Angle 30 degrees 19 degrees
Image Scale 26 pixels/mm 27 pixels/mm 24 pixels/mm
Field of View (vertical) 94 mm 91 mm 102 mm
Exposure Time 3.5 ms 3 ms 38 ms
Aperture f# 6
Frame rate (0.5 – 1) Hz
Camera Interface Firewire
DIC Analysis Setting
Subset 23 21
Step 8 7
Subset shape function Affine
Strain Calculation Hencky
Strain-filter size 5
Virtual strain gauge (VSG) size 55 pixels (2.11 mm) 55 pixels (2.04 mm) 49 pixels (2.04 mm)
VSG equation (strain-filter size – 1) * step + subset
12 of 184.5. Virtual strain gauge sensitivity analysis
The analysis parameters used during the processing of the DIC images have a significant effect on both
the noise-floor and the maximum measurable strain gradients. Since the longitudinal strain is the primary
quantity in the representation of the stress-strain response, this quantity of interest will be the focus of the
effects of the DIC analysis parameters. The process of selecting a judicious set of DIC analysis
parameters is often referred to as a virtual strain gauge (VSG) study, and is described in A Good Practices
Guide for DIC reference [3]. The results of this process will vary with changes in the hardware and setup
of the DIC system and/or changes in the DIC pattern used. Although one patterning method was used for
all the uniaxial tension tests described here, however three different stereo-DIC setups were used, see
Section 4.4. Therefore, three different VSG studies were performed and they are presented here. Three
key parameters (subset size Sss, step size Sst, and strain-filter size F) are varied during the VSG study. The
Good Practices Guide [3] combines these independent length variables into a single value parameter
(VSG), the VSG size which is defined as,
SVSG = Sss + (F – 1) Sst
and is used to estimate the length over which the strain is calculated. Smaller VSG lengths typically
results in larger strain noise but better-resolved strain gradients, while larger VSG lengths typically results
in smaller strain noise but more smoothed strain gradients. Figure 5 provides a visual comparison
between the strain noise for large and small VSG lengths on the same image. An informed balance
between the two desirable but competing outcomes (low strain noise versus better-resolved strain
gradients) is the goal of the VSG study.
Subset 31, step 11, filter 11 Subset 15, step 5, filter 5
Large VSG 5.88mm Small VSG 1.46mm
Figure 5: ɛyy true strain noise difference visualization between large and small VSG sizes [E191210-ERR-311].
For each stereo-DIC setup (Table 4), one representative test was selected to perform a detailed VSG study
for that setup. In each VSG study, one image from the pre-load phase and one image from just before
failure was selected. These images were analyzed using a variety of subset, step, and filter size
combinations, resulting in VSG lengths between 30 pixels and 325 pixels.
13 of 18The spatial strain noise was assessed using all correlated data points from a pre-load image, where strain
is known to be zero. Although the mean strain value in each case was not zero, the standard deviation of
the strain was significantly larger than the mean. Therefore, the VSG study assessed the strain noise
based on just the standard deviation of the strain. Figure 6(a), Figure 7(a), and Figure 8(a) plot one
standard deviation of the strain for each VSG size that are the result for various combinations of subset
size, step size, and filter size. In each case, the smaller the VSG size the larger the standard deviation of
strain. VSG size was calculated in pixel, and then converted to mm based on the image scale (Table 4).
For each test, the near failure image is presumed to have the highest strain gradient as the strain is
localizing prior to failure, and this image is used to assess the spatial smoothing. Figure 6(b), Figure 7(b),
and Figure 8(b) show the local strain behavior along the reduced parallel length for three representative
VSG sizes. These profiles are color coded to the three matching points in the other parts of each figure.
The peak strain value in each profile was assessed at the same location (Y position) along the length of the
profile for all the VSG sizes analyzed and is plotted versus the VSG size in part (c) of each figure. In
each case, the larger the VSG size the more the peak strain is smoothed.
The tradeoff between the local strain noise and smoothing of the peak strain value for all the VSG sizes
considered in each study is summarized in part (d) of Figure 6, Figure 7, and Figure 8. The green, red and
blue data points and the associated strain profiles represent three potential outcomes of the VSG study.
The green data point and profile demonstrate a VSG selection that will result in smaller local strain noise
but more smoothing of the higher strain gradients. This could be desirable if only the low strain behavior
is of interest and noise had to be minimized. The blue data point and profile demonstrate a VSG selection
that will result in minimal reduction of the peak strain near failure, but at the cost of a larger strain noise.
This could be desirable if the strain near failure is the critical measurement. The red data point and
profile was selected based on the desire to capture as high a strain as possible while keeping the local
noise between 125 µm/mm and 150 µm/mm, and it demonstrates a balance between capturing much of
the high strain behavior while restricting the local strain noise. The parameters associated with the red
data points were selected as the optimum for each setup and are summarized in Table 3.
14 of 184.5.1. DIC Setup 1
The experiment [E191022-ERR-103] is used for the VSG study for DIC Setup 1 [L200324-ERR-001].
The preload image 10 and near failure image 600 are used for the strain noise and peak strain smoothing
assessments, respectively. The results are presented in Figure 6. The parameters selected based on this
VSG study coincide with the red data points and curve shown in the figure. Based on the VSG results
strains near 0.395 mm/mm measured with Setup 1 should be considered a lower bound of the actual strain
values.
(a) (b)
(c) (d)
Figure 6: Virtual strain gauge study results for DIC Setup 1. (a) spatial noise versus VSG length, (b) strain profiles
for three selected VSG lengths (the profiles are color coded to the three matching VSG lengths in the other parts of
the figure), (c) peak profile strain versus VSG length, (d) peak profile strain versus spatial noise.
15 of 184.5.2. DIC Setup 2
The experiment [E191119-ERR-003] is used for the VSG study for DIC Setup 2 [L200324-ERR-001].
The preload image 21 and near failure image 528 are used for the strain noise and peak strain smoothing
assessments, respectively. The results are presented in Figure 7. The parameters selected based on this
VSG study coincide with the red data points and curve shown in the figure. Based on the VSG results
strains near 0.255 mm/mm measured with Setup 2 should be considered a lower bound of the actual strain
values.
(a) (b)
(c) (d)
Figure 7: Virtual strain gauge study results for DIC Setup 2. (a) spatial noise versus VSG length, (b) strain profiles
for three VSG selected lengths (the profiles are color coded to the three matching VSG lengths in the other parts of
the figure), (c) peak profile strain versus VSG length, (d) peak profile strain versus spatial noise.
16 of 184.5.3. DIC Setup 3
The experiment [E191210-ERR-311] is used for the VSG study for DIC Setup 3 [L200324-ERR-001].
The preload image 12 and near failure image 1108 are used for the strain noise and peak strain smoothing
assessments, respectively. The results are presented in Figure 8. The parameters selected based on this
VSG study coincide with the red data points and curve shown in the figure. Based on the VSG results
strains near 0.415 mm/mm measured with Setup 3 should be considered a lower bound of the actual strain
values.
(a) (b)
(c) (d)
Figure 8: Virtual strain gauge study results for DIC Setup 3. (a) spatial noise versus VSG length, (b) strain profiles
for three VSG selected lengths (the profiles are color coded to the three matching VSG lengths in the other parts of
the figure), (c) peak profile strain versus VSG length, (d) peak profile strain versus spatial noise.
17 of 184.6. Noise-floor analysis
At the start of each test, but before any actuator motion, the data acquisition system captured several static
images. Five of these static images were used to estimate the noise-floor for each test. The results are
presented in the uniaxial test summary table file (see Section 4.2). The noise-floor value was used as a
simple quality metric to determine if there was any outlier behavior in the DIC system, calibration, or
pattering. The reported true strain noise-floor values, nε, are calculated using the mean and standard
deviation (std) of each of the images as
nε = |mean(ε)| + std(ε)
for each component of strain. The value reported for each test is the worst value of the five images for
that test. In each test, the majority of the noise floor comes from the spatial variation in strain expressed
in the standard deviation, rather than from the change in the mean value.
4.7. NCAL information
This report and data are archived as NCAL collate ID L200326-ERR-001.
5. References
[1] ASTM International. Standard practice for verification of testing frame and specimen alignment
under tensile and compressive axial force application. Standard E1012-14el, ASTM International,
W. Conshohocken, Pa, 2012. doi:10.1520/E1012-14E01.
[2] ASTM International. E8/E8M-16a Standard Test Methods for Tension Testing of Metallic
Materials. West Conshohocken, PA, 2016. doi:10.1520/E0008_E0008M-16A.
[3] E. M. C. Jones and M. A. Iadicola, editors. A Good Practice Guide for Digital Image Correlation.
International Digital Image Correlation Society, 2018. doi:10.32720/idics/gpg.edl.
18 of 18You can also read