NEWAYS ELECTRONICS Analyst Meeting 26 February 2021 - Your EMS Lifecycle Partner & System Innovator
←
→
Page content transcription
If your browser does not render page correctly, please read the page content below
NEWAYS ELECTRONICS
                                                                       Analyst Meeting
                                                                      26 February 2021

Your EMS Lifecycle Partner & System Innovator
                                                                                    0
                            © Neways Electronics International N.V.
Safe Harbour Statement
           This presentation may include forward-looking statements. Other than reported financial
           results and historical information, all statements included in this press release, including,
           without limitation, those regarding our financial position, business strategy and
           management plans and objectives for future operations, are forward-looking statements.
           These forward-looking statements are based on our current expectations and projections
           about future events and are subject to risks and uncertainties that could cause actual
           results to differ materially from those expressed in the forward-looking statements.

           Many of these risks and uncertainties relate to factors that are beyond Neways’ ability to
           control or estimate precisely, such as future market conditions, the behaviour of other
           market participants and the actions of governmental regulators. Readers are cautioned not
           to place undue reliance on these forward-looking statements, which speak only as of the
           date of this presentation and are subject to change without notice. Other than as required
           by applicable law or the applicable rules of any exchange on which our securities may be
           traded, we have no intention or obligation to update forward-looking statements.

© Neways Electronics International N.V.            © NEWAYS | February 2021                                1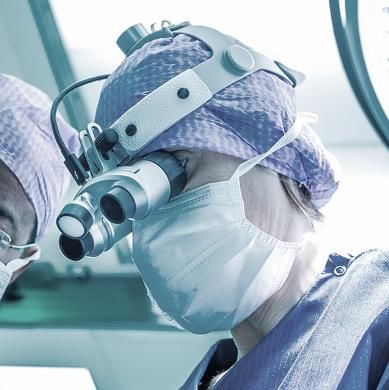
MANAGEMENT SUMMARY

          Agenda

                1                         2               3                         4
                 MANAGEMENT                    2020 IN        STRATEGIC             KEY TAKEAWAYS
                     SUMMARY                   REVIEW          OUTLOOK                  AND Q&A

              A. Management               A. Key events   A. Our market             A. 2021 priorities
                 summary                  B. Financials   B. Strategic priorities   B. Key takeaways
              B. Neways profile                           C. Change agenda          C. Q&A

© Neways Electronics International N.V.                                                                  2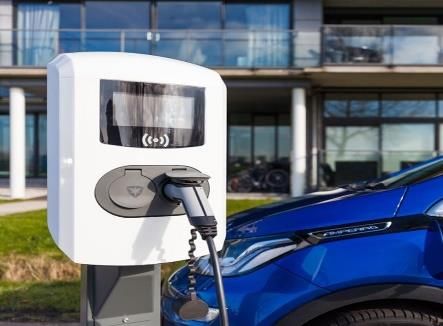
The Highlights

    MANAGEMENT SUMMARY

                         3
MANAGEMENT SUMMARY

          Instability from Covid-19 dominated 2020 with management focus on
          safety, adaptation and customer protection

                     Adapting to a new                 Protecting our                         Accelerating new
            01                                  02                                     03
                     reality                           customer base                          operating model

          ◼     Proactive measures in keeping   ◼   Benefitting from balance across    ◼   Further strengthening
                our people safe & securing          segments and customers                 operational processes and
                continuity of our operations                                               standard way-of-working
                                                ◼   Despite fall out in some sectors
                                                                                           (ONE Neways)
          ◼     Adapting our cost base and          (mainly in automotive and
                rightsizing the organization        industrial), we continued to       ◼   Accelerating our positioning as
                across our global footprint         generate healthy new business          System Innovator across all
                (-11.9%, 350 FTEs)                  and grown our pipeline                 our segments

© Neways Electronics International N.V.                                                                                      4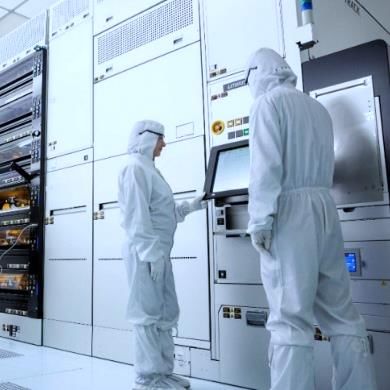
MANAGEMENT SUMMARY

          Focus on cost and cash to manage impact of demand and supply
          challenges from Covid-19

             FY-20 net turnover           FY-20 Normalized   FY-20 Net Cash   FY-20 FTEs
                                          Operating Result       Flow
                   € 478.6 mln               € 7.9 mln         € 37.6 mln       2,705

             FY-19 net turnover           FY-19 Normalized   FY-19 Net Cash   FY-19 FTEs
                                          Operating Result       Flow
                   € 533.5 mln               € 15.9 mln        € 16.4 mln       2,940

© Neways Electronics International N.V.                                                    5
MANAGEMENT SUMMARY

          Balanced across 4 market sectors

                                                                                          FY20                FY19

                           Automotive sector hurt significantly due to production                     24%                 30%
             A
                           interruptions and changeover from combustion to E-mobility

                           Industrial sector partly also impacted by slow down in                     30%                 31%
              I
                           automotive and supply chain constraints

                           Medical stable despite delays in hospital equipment                        11%                 10%
             M
                           installation but continued strong underlying demand

                           Semiconductors continued to perform strong due to                          34%                 27%
             S
                           growth across end-markets that drives need for capacity
                                                                                        Other is 1%         Other is 2%

© Neways Electronics International N.V.                                                                                         6
MANAGEMENT SUMMARY

          Neways committed to grow to a position as System Innovator for high-
          end electronic solutions

                                           ◼    Offering high-end electronics solutions since our establishment in 1969
                     Clear                 ◼    Close collaboration with our customers across the total product life cycle
                   positioning             ◼    Active in 4 key sectors for Automotive, Industrial, Medical & Semiconductor
                                           ◼    Footprint in Netherlands, Germany, Slovakia, Czech Republic, China & USA

               Serving triple-A
                 customers

                     With
                differentiated             Design &
                                                        Connectivity    Micro electronics PCB assembly System integration
                competences               Engineering

© Neways Electronics International N.V.                                                                                       7
The Highlights

    2020 IN REVIEW

                     8
2020 IN REVIEW

        Next to safety and customers, full focus on cost and cash

          01 Net sales & order book 02 Margin development                             03 Cash flow development

        ◼     Year-on-year organic net sales    ◼   Relative stable gross margin at   ◼   Net cash flow € 37.6 mln vs.
              growth of -10.3% (FY20: € 479         36.7% vs 36.9% following              FY19: € 16.4 mln positively
              mln vs. FY19: €533 mln)               increasing box-build systems          driven by strict working capital
                                                    and decreased automotive              control, largely related to
        ◼     Order book -/-22.8% y-o-y,
                                                    sales                                 inventory measures, deferred
              primarily related to Automotive
                                                                                          tax payments and strict credit
              and Industrial sectors            ◼   OPEX decreased with 7.2%,
                                                    relative increase from 33.9% to       control
                                                    35.0% of sales                    ◼   Provision taken for € 9.6 mln to
                                                                                          adapt our organization to new
                                                ◼   Normalized EBIT ended at €
                                                                                          reality (rightsizing and
                                                    7.9 mln vs. FY19: € 15.9 mln,
                                                                                          customer impact)
                                                    affected by strong and sudden
                                                    decline in turnover

© Neways Electronics International N.V.                                                                                      9
2020 IN REVIEW
2020 key figures
(€ mln)
FY-20 Change FY-20 Change
Net turnover 478.6 -10.3% Interest coverage 3.8 -30.9%
Normalized
operating result 7.9 -50.3% Net debt / EBITDA 1.5 -31.9%
Net result -3.9 na Solvency % 43.6 +14.0%
Net cash flow 37.6 +129% Employees (FTEs) 2,705 -8,0%
Result per share (€) -0.32 na Equity 102.0 -3.9%
© Neways Electronics International N.V. 102020 IN REVIEW
2020 Turnover and orderbook
(€ mln) Net turnover – FY-20 vs FY-19
◼ Y-o-Y organic net sales decline of 10.3%
◼ Strong decline of 28.5% in Automotive following
343
steep growth in 2019
301 304 ◼ Industrial lower with 11.7% impacted by COVID-19
291
261 265 267 ◼ Semiconductors continued strong (+11.9%),
247 243 252 236 Medical stable
225 ◼ High volatility and lower predictability
◼ Good spread and positioning within segments
Order book – FY-20 vs FY-19
◼ Order book -/-22.8% y-o-y, primarily related to
Automotive sector and Industrial
◼ Order book reflects relaxation supply chain
H1-18 H2-18 H1-19 H2-19 H1-20 H2-20 ◼ Book-to-bill 0.87 vs 0.98 last year, bottoming out
Net turnover Orderbook
© Neways Electronics International N.V. 112020 IN REVIEW
2020 Net turnover and gross margin trends
(€ mln) FY-20 vs FY-19
◼ Gross margin slightly decreased by 0.2%
◼ Relative stable margin at 36.7% vs 36.9% following
increasing box-build systems and decreased
261 265 268 automotive sales
247 243 236 ◼ Margin impacted by following trends:
- Increasing material content as consequence
of more complex Box-build systems and
automotive sales
- Price pressure suppliers, following scarcity in
market, not fully offset in customer pricing
97 98 102 96 - Partly offset by effects supplier improvement
89 87
program, material efficiency programs and
higher added value products
H1-18 H2-18 H1-19 H2-19 H1-20 H2-20
Net turnover Gross margin
© Neways Electronics International N.V. 122020 IN REVIEW
2020 Opex and operating result trends
Opex (€ mln) Opex FY-20 vs FY-19
88,5 92,7 88,0 ◼ Costs decreased with 7.2%, relative increase from
85,6 86,8
80,9 33.9% to 35.0% of turnover
◼ Cost strongly impacted by the sudden sales drop
◼ Actions taken to adjust cost base (€ 8 mln annual) in
line with lower activity level and to make organization
more effective
◼ Reduction headcount, cost measures and investment
freeze to protect profitability
H1-18 H2-18 H1-19 H2-19 H1-20 H2-20 ◼ Germany: implemented “Kurzarbeit” from March
onwards
Normalized EBIT (€ mln) ◼ Netherlands: not qualified for NOW
11,0 11,0 ◼ Despite volatility in demand, productivity has
8,9 remained stable
7,0
5,7 Normalized EBIT FY-20 vs FY-19
◼ EBIT ended at € 7.9 mln, affected by strong and sudden
2,2 decline in turnover
H1-18 H2-18 H1-19 H2-19 H1-20 H2-20
© Neways Electronics International N.V. 132020 IN REVIEW
2020 Financial condition
Net debt / EBITDA (ratio) FY-20 vs FY-19
◼ Decreased balance sheet total of € 234 mln vs
€ 278 mln end 2019, related to tight investment
2,3 program, strict control of inventories and debtors
1,4 1,6 ◼ Equity decreased by 3.9% to € 102.0 mln vs
€ 106.1 mln fully related to the charge to income
for restructuring of € 6.8 mln.
◼ Net debt (excl IFRS 16) decreased by 92.6% to
YE 18 YE 19 YE 20 € 2.5 mln vs € 34.3 mln last year, largely related to
With effect from 2016 Net debt excluding guaranteed capital
improved working capital management and the
Excl IFRS 16 effect YE 19: 1.,3 utilization of Government measures (a.o. tax
extension fully paid in 2021) for an amount of € 8.8
mln.
Solvency % (Guaranteed) ◼ LTM EBITDA € 16.5 mln vs € 25.2 mln in 2019
43,6 ◼ Incl IFRS 16 effect LTM EBITDA ended at € 22.5
41,9 38,2 mln
◼ Solvency increased to 43.6% related to shortened
balance sheet
YE 18 YE 19 YE 20
* Excl IFRS 16 effect YE 19: 43.7%
© Neways Electronics International N.V. 142020 IN REVIEW
2020 Net working capital
(€ mln) FY-20 vs FY-19
◼ € 21.1 mln decrease working capital largely related
87,7 81,5 to:
- Inventory measures paying off and realized
60,4 relative decline despite lower activity level
- Strict credit control keeping debtors at 35
days
- Partly offset by lowered outstanding
payables
YE 18 YE 19 YE 20
◼ DIO further reduced compared to YE19 following
stock control improvement. Actions are paying off
(SMOI, tighter monitoring of stocks, supplier
Inventories 115,2** 100,6** 82,3**
reduction)
Inventory days 85*) 72*) 69*)
Debtors (trade) 59.7 66.8 51.3
Debtor days 36 38 35
Creditors (trade) 65.8 62.3 43.0
Creditor days 64 56 50
*) based on realized turnover, excl. IFRS 15 adjustment
**) incl IFRS 15 adjustment
© Neways Electronics International N.V. 152020 IN REVIEW
2020 Cash flow and capex trends
Operating and net cash flow (€ mln) Operations FY-20 vs FY-19
◼ Operating cash flow strongly positive driven by
strong working capital control
◼ Extended (a.o. tax) payment, total € 8.8 mln,
Operational cash flow Net cash flow facilitated by the government (NOW)
40.9
37.6
29,4 Investments FY-20 vs FY-19
◼ Capex strictly limited following activity reduction
16,4 from € 13.0 mln to € 3.3 mln
7,6
Financing FY-20 vs FY-19
◼ On balance net debt decreased, excl IFRS 16
impact, with € 31.8 mln to € 2.5 mln vs YE 19
-4,5 € 34.3 mln largely due to lower working capital and
extended (tax a.o.) payments
© Neways Electronics International N.V. 162020 IN REVIEW
2020 Headcount trends
Average FTE unless stated otherwise Headcount (FTE) FY-20 vs FY-19
Western Europe Eastern Europe, China & USA ◼ Knowledge component in human resource mix
increasingly important also following our strategy
2,943 2,940 2,705 to become System Innovator
◼ No. of engineers approx. 9% of total number of
employees
2216 2260
2064 ◼ Headcount reduction in total 350 FTEs of which
above 200 in 2020 following the lower activity level
and effort to streamline organisation
◼ Reorganization underway to be effected first half
2021 impacting approximately 150 FTE bring total
reduction to -11.9%
◼ Headcount end of 2020 at 2.598 FTE of which 200
FTE flex pool
727 680 641 ◼ Recruiting (technically) talented employees
challenging, requiring more effort and creativity
2018 2019 2020
Flex pool % 15% 13% 8%
© Neways Electronics International N.V. 17The Highlights
STRATEGIC OUTLOOK
18STRATEGIC OUTLOOK – Target markets
Global EMS market expected to grow at 7.1% CAGR till 2025
Total relevant EMS market size by industry segment1) 2017-2025F [EUR bln]
CAGR Volume/Mix
+7.1% 2020-2025
82
-4.3% 77
+6.9% 72 18 MVMM
67 Automotive 8.7%
17
61 63 16
57 58 14
53 13 13
12 12 7.0% LVHM
28 Medical
11 26
24
22
18 21
17 20
16
36
Industrial & 6.3% LVHM
30 32 34 Semiconductor
26 28 30 27 29
1) Converted from USD with a ratio of 0.88 EUR per USD; market view is excluding Consumer &
Communication as well as Aerospace & Defense
2017 2018 2019 20202) 2021F 2022F 2023F 2024F 2025F 2) Preliminary figures
Note: MVMM: Medium Volume Medium Mix ; LVHM: Low Volume, High Mix
SOURCE: Global management consultancy firm, February 2021
Such advisor does not owe or accept any duty, responsibility, or liability to you or any other party, howsoever arising, and shall not be liable in respect of any loss, damage, or expense of whatsoever nature which is caused by using the slides. Notwithstanding the foregoing, nothing shall exclude or limit any liability for fraud, fraudulent misrepresentation, or
wilful misconduct or any other liability which cannot be excluded or limited pursuant to applicable laws or regulations.
© Neways Electronics International N.V. 19STRATEGIC OUTLOOK – Target markets
Our target markets with strong growth and increasing electronic content
A Automotive I Industrial M Medical S Semiconductor
End market ◼ Increasing electrification ◼ Stronger demand for ◼ Continued and resilient ◼ End market drive
industrial automation demand demand
trends
◼ Market shift to e-mobility ◼ Differentiated ◼ Digitalization & ◼ Key technologies driver
technology solutions integration of equipment (5G, infotainment,
cloud, AI, etc.)
EMS specific ◼ Electrical & Electronic ◼ Merging electronics ◼ Growth in electronics ◼ Increasing
architectures Industrial & automotive technological
growth drivers complexity
◼ New entrants rely on ◼ Drive for standardi- ◼ Acceleration of
EMS partners zation & modules on innovation ◼ Fast growing install
hardware base
SOURCE: Global management consultancy firm, February 2021
Such advisor does not owe or accept any duty, responsibility, or liability to you or any other party, howsoever arising, and shall not be liable in respect of any loss, damage, or expense of whatsoever nature which is caused by using the slides. Notwithstanding the foregoing, nothing shall exclude or limit any liability for fraud, fraudulent misrepresentation, or
wilful misconduct or any other liability which cannot be excluded or limited pursuant to applicable laws or regulations.
© Neways Electronics International N.V. 20STRATEGIC OUTLOOK – Competitive field
Ambition to outperform core EMS competition, focusing on sustainable
profit and growth
Overview of EBIT margin and 7-Year revenue CAGR of selected EMS players
EBIT margin, 2019
Players average: 6.1%
12%
11% Venture Corporation Limited
VTech Communications Ltd.
10% Niche players
9%
8% Fabrinet
7%
6% Core EMS competition
V.S. Industry Berhad
5% Sanmina Corporation
AsteelFlash Group SA Plexus Corp. Kimball Electronics, Inc. Players average: 4.1%
4% PKC Group Oyj Zollner Elektronik AG
Jabil Inc.
Universal Scientific Industrial (Shanghai) Co., Ltd.
3% Shenzhen Kaifa Neways
Technology Co., Ltd. SIIX Corporation
2% Hon Hai Precision Industry Co., Ltd.
Flex Ltd. Celestica Inc.
Pegatron Corporation
1% Benchmark Electronics, Inc. Kinpo Electronics, Inc. Revenue size
0% UMC Electronics Wistron Corporation
Integrated Micro-Electronics, Inc.
Where available, for competitors that do not
have 2019 data available, latest year was
Co., Ltd. taken
-1%
-5% -4% -3% -2% -1% 0% 1% 2% 3% 4% 5% 6% 7% 8% 9% 10% 11% 12% 13% 14% 15% 16% 17% 18% 19% 20% 21% 22% 39% Revenue growth [CAGR] '12-'191)
SOURCE: Global management consultancy firm, February 2021
Such advisor does not owe or accept any duty, responsibility, or liability to you or any other party, howsoever arising, and shall not be liable in respect of any loss, damage, or expense of whatsoever nature which is caused by using the slides. Notwithstanding the foregoing, nothing shall exclude or limit any liability for fraud, fraudulent misrepresentation, or
wilful misconduct or any other liability which cannot be excluded or limited pursuant to applicable laws or regulations.
© Neways Electronics International N.V. 21STRATEGIC OUTLOOK – Customer demand
Customers expect Neways to accelerate their innovation roadmap
AFFORDABILITY TECHNOLOGY DIFFERENTIATION
◼ Cost effective footprint ◼ System knowledge & expertise
◼ Continuous improvement ◼ Engineering to application
◼ Cross functional solutions
PERFORMANCE SEAT AT THE TABLE
◼ Logistical performance for e2e ◼ Trustworthy technology partner
supply chain control ◼ Customer intimacy / insights
◼ Proven ramp-up / NPI capability
© Neways Electronics International N.V. 22STRATEGIC OUTLOOK - Positioning
Accelerating our innovation means growing to System Innovator position
fully tested (sub-) systems
◼ Delivering solutions with higher added value
SYSTEM SYSTEM
- From build-to-print to build-to-roadmap/spec
INTEGRATOR INNOVATOR
- From PCBAs to fully tested (sub)systems
build to spec
build to print
◼ Early in customers’ development cycles
◼ Accelerated innovative technology applications
PROCESS APPLICATION
SPECIALIST SPECIALIST
Sustainable margin improvement
PCBAs
© Neways Electronics International N.V. 23STRATEGIC OUTLOOK - Positioning
Front-end & back-end System Innovator services
Front-end Traditional Operational EMS Competencies Back-end
System Innovator System Innovator
Development Aftermarket
DFX QLTCS - performance
expertise performance
Product NPI / Process Volume Production, Service & Life
Development Development Assembly & integration Cycle Extension
Life Cycle Management (LCM)
© Neways Electronics International N.V. 24STRATEGIC OUTLOOK – Proof points
Proven customer partnerships for System Innovator applications
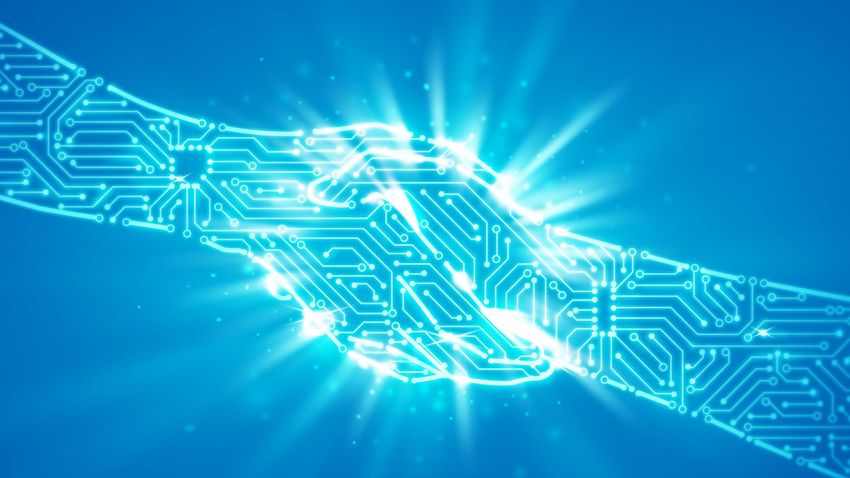
Design and production partner for Partnership for surgical digital Design & build partner for world’s
leading E-mobility charging system loupe and 3D viewer most advanced wafer stepper
Development framework for World’s largest radio telescope Irradiation equipment with
EU Inter-IoT & Inter-IoT assist connected over 8 EU countries integral MRI capability
© Neways Electronics International N.V. 25STRATEGIC OUTLOOK – How to get there?
Neways will accelerate this position through 3 strategic focus areas
3 key strategic focus areas
PERFORM
Account planning, day2day Deployment of System
01
demand management Innovator strategy
Transformation to
02
Targeted ONE Neways
customer value
proposition
GROW POSITION
Segment domain expertise, Technology roadmaps, Acceleration of our
03
customer insights competence intelligence Change agenda
© Neways Electronics International N.V. 26STRATEGIC OUTLOOK – How to get there?
Strategic path to accelerate System Innovatorship and OneNeways
Top
Performance enhancement & autonomous growth Maintain growth and accelerate through acquisition
quartile
2021 2022 2023 2024 2025
“Create a stable “Full roll out of OneNeways, “Become a Global “Next phase growth and “Be the Global System
performance as One” Grow as One” Innovator” profitability as System Innovator” Innovator”
Human Capital
Innovation
Customer
Intimacy
Operational
Excellence
Global Footprint
© Neways Electronics International N.V. 27STRATEGIC OUTLOOK – How to get there?
Dedicated change approach driven through work streams
CAPABILITY CULTURE 01 Strategic objectives and strategy
deployment process (accelerate)
02 Control model and performance
management
END TO
END Commercial & technology
VALUE 03 Excellence (System Innovator)
STREAMS
Operational & Support Excellence
04 (Key E2E processes)
CONTROL CUSTOMER
Change communications &
05 Culture program
© Neways Electronics International N.V. 28KEY TAKE AWAYS
Focus on 2021 management priorities
2021
“Create a stable performance as One”
Human Capital Develop talent & leadership; Tune indirect organisation
Innovation Enhance technology roadmaps & capability
Customer
Deliver new System Innovator sales initiatives
Intimacy
Operational
Control cost and cash focus with excellent QLTCS performance
Excellence
Global Footprint Deploy make buy strategy & enforce position in Eastern-Europe
© Neways Electronics International N.V. 29The Highlights
KEY TAKE AWAYS
30KEY TAKE AWAYS
In 2020 Neways focused on cash & cost; going forward we will create a
foundation to accelerate System Innovatorship and OneNeways strategy
01 02 03
For 2020 management For 2021 create fundament for Accelerate System Innovator-
focused on cost & cash sustainable profitable growth ship and OneNeways
© Neways Electronics International N.V. 31KEY TAKE AWAYS
Questions?
© Neways Electronics International N.V. 32THANK YOU
www.newayselectronics.com
Your EMS Lifecycle Partner & System Innovator
33
© Neways Electronics International N.V.NEWAYS VALUE PROPOSITION - APPENDIX
Neways proposition aimed at System Innovator to realize sustainable profitable growth with
ample room to reap the benefits from investments in our global operating footprint
1 Focus on offering high value-add electronic solutions for reputable and high-end OEMs
2 Fundamentally favourable underlying growth drivers in targeted markets
3 Attractive customer portfolio containing market leading OEMs
4 Global footprint has room for further utilisation and productivity improvement
5 Further efficiency gains through harmonizing the way of working (‘ONE Neways’)
6 Headroom for focused M&As to accelerate growth
© Neways Electronics International N.V. 342020 IN REVIEW - APPENDIX
2020 profit & loss
€ million unless stated otherwise
FY 2020 FY 2019 FY 2018 FY 2017 FY 2016
Net turnover 478.6 533.5 506.8 438.7 393.2
- nominal growth in % -10.3% 5.3% 15.5% 11.6% 5.1%
Operating result -2.5 15.1 21.0 14.3 11.8
Normalized operating result ** 7.9 15.9 22.0 15.3 12.7
Normalized net result ** 3.5 9.1 15.1 10.0 9.2
Extraordinary income/expenditure -7.4 -0.6 -0.7 -0.1 0.5
Net result -3.9 8.5 14.4 9.9 9.7
Gross margin/net turnover 36.7% 36.9% 38.5% 39.0% 39.1%
Gross margin/per employee (k€) 64.9 66.9 66.3 62.3 60.0
Operating margin ** 1.7% 3.0% 4.3% 3.5% 3.2%
Net margin ** 0.70% 1.70% 3.0% 2.3% 2.3%
EPS (€) -0.32 0.70 1.20 0.86 0.85
** Excluding extraordinary income and expenditure
© Neways Electronics International N.V. 352020 IN REVIEW - APPENDIX
2020 data per share
(€) 2020 2019 2018 2017
Operating result 0.65 1.31 1.76 1.25
Net result -0.32 0.70 1.20 0.86
Dividend 0.00 0.00 0.48 0.35
Shareholders' equity 8.38 8.73 8.50 7.35
Number of issued shares (x 1.000 year-end) 12,174 12,150 11,958 11,481
© Neways Electronics International N.V. 362020 IN REVIEW - APPENDIX
2020 financial condition
2020 2019 2019 2018 2017
excl IFRS 16
Net debt / EBITDA ratio 1.5 2.2 1.3 1.4 1.6
Interest coverage ratio 3.8 5.4 6.9 11.2 10.2
Solvency (Guaranteed) % 43.6 38.2 43.7 41.9% 44.0%
Equity 102.0 106.1 101.6 84.4
EBITDA (LtM) 21.6 30.3 25.2 30.2 23.4
© Neways Electronics International N.V. 372021 SENSITIVITIES - APPENDIX
Underlying demand in most of our market segments show good
prospects but we remain vigilant to address on-going challenges
Downward sensitivities Upward sensitivities
Market recovery Ramp up in demand
01 04
◼ Uncertainty remains on economic recovery and implications ◼ Exponential ramp up in customer demand, i.e. in
across sectors semiconductors
Allocation issue Healthy pipeline of SI opportunities
02 05
◼ Shortage of certain components in the supply chain with ◼ Strong sales funnel of new business opportunities,
unknown implications on lead times and prices i.e. for system innovator cases
Delay on transformation process Optimise footprint utilisation
03 06
◼ Ensure (human) capacity and pace to drive transformation ◼ Strict demand management (growth), and right sizing
of footprint can further benefit utilisation
© Neways Electronics International N.V. 38You can also read