Reversal of Fortune for Political Incumbents after Oil Shocks
←
→
Page content transcription
If your browser does not render page correctly, please read the page content below

WO RKING PAP ER

                                                                                                                                          belfercenter.org/MEI

                                                                                                                                                       AP Photo/Amr Nabil
M I D D L E E A S T I N I T I AT I V E | F E B R U A R Y 2 0 2 1

Reversal of Fortune for
Political Incumbents
after Oil Shocks
Rabah Arezki, Simeon Djankov, Ha Nguyen and Ivan Yotzov

Abstract
This paper explores the effect of oil shocks on electoral outcomes. Using a new polling and
election data set for 207 elections across 50 democracies, the paper shows that oil price increases
systematically lower the odds of reelection for incumbents. The analysis verifies that these shocks—
which reduce consumption growth—are associated with worsening performance for incumbents in
the runup to reelection and a reversal in the leaning of the political party in power post-election.

Keywords: Elections, Incumbent, Oil Prices, Economic Shocks, Consumption.

JEL Codes: D72; E21; P16; Q43.

         Reversal of Fortune for Political Incumbents after Oil Shocks | Belfer Center for Science and International Affairs   |   February 2021                            1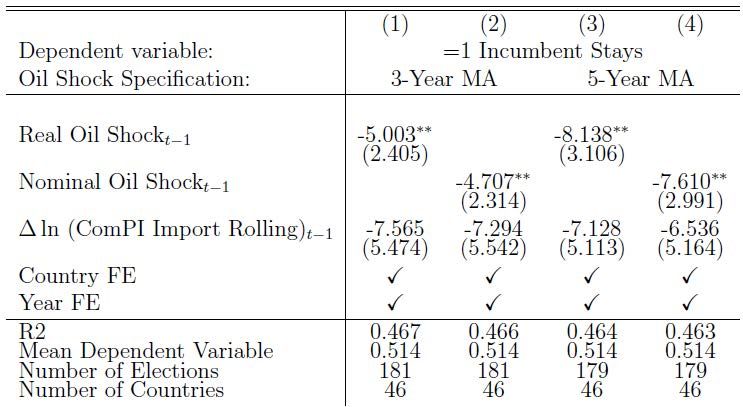
1. Introduction
The increase in gasoline prices stemming from the oil crisis overshadowed the United States pres-
idential debate of October 1980. Ronald Reagan and then President Jimmy Carter were going head
to head in the election. Carter’s, the incumbent’s, loss that year coincided with a peak in oil prices.
Other modern US presidential incumbents—for example, Presidents Ford and Bush Sr - also lost
their reelection bids following oil price spikes. This anecdotal evidence points to a broader question
about the role of exogenous shocks in determining electoral outcomes.

This paper explores the effect of oil price shocks on the odds of reelection of political incumbents.
We use a novel data set of 207 elections in 50 democracies. In addition to the 207 elections, our data
set includes polling data in the run-up to elections. The polling data allow us to explore the effect
of exogenous shocks prior to elections. Depending on the political system, the data set includes
elections of the chief executive in parliamentary or presidential systems. As large oil imports leave
a country vulnerable to changes in crude oil prices, we rely on these prices as an exogenous source
of variation in terms of trade. The shock consists of two components, namely the change in interna-
tional crude oil prices and the exposure of a country to crude oil imports.

The results show that an increase in oil prices one year prior to election significantly reduces the
odds of reelection for the incumbent party. In our sample, the average crude oil price shock is re-
spectively 0.25 percent for elections when the incumbent party loses, and -0.55 percent when the
incumbent party wins. This pattern suggests that a negative terms of trade shock associated with
rising oil prices could contribute to the change in political fortune for incumbents.

Since most countries in our sample are oil importers, an increase in crude oil prices would reduce the
purchasing power of the population, consistent with Hamilton (2003) and Blanchard and Gali (2009).
An increase in oil prices is found to reduce consumption growth and hurt the chances of incumbent
reelection one year later. Both right-wing and left-wing incumbent parties are likely to lose elections
following a crude oil price increase. We verify that the winning parties are more likely to belong to the
opposite end of the political spectrum. In other words, following an oil price increase, a left-leaning
incumbent party is more likely to be replaced by a right-leaning party and vice versa.

The results remain robust to a variety of checks and alternative specifications. Results from polling data
also reinforce our main findings. We use data from multiple polls prior to a general election, which are ag-
gregated to construct a monthly series. We find that for each election, fluctuations in oil prices 12 months
before the polls shift the standing of the incumbent party. Our results survive when we control for voter
turnout, pre-determined elections, other macro variables, and different lag structure for oil shocks.

       Reversal of Fortune for Political Incumbents after Oil Shocks | Belfer Center for Science and International Affairs   |   February 2021   2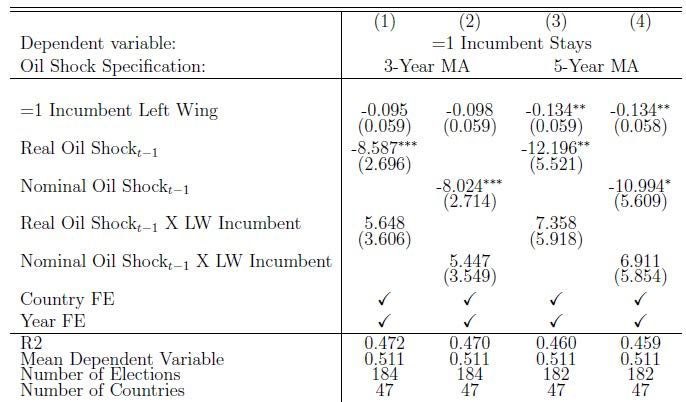
This research is related to a large public choice literature suggesting that voters act rationally.
Voters favor candidates who are expected to deliver the highest “monetary return” (Buchanan and
Tullock 1962). Downs (1957) and Hinich and Munger (1994) argue that in addition to self-interest,
ideology, culture, and moral codes also drive the behavior of voters. However, the empirical support
for the role of ideology is mixed (see Degan and Merlo, 2009). Using US election data, Henry and
Mourifie (2013) empirically reject that ideological bias. Our findings also suggest that citizens on
average seem to vote without a clear ideological pattern in response to exogenous shocks.

Our findings are consistent with the literature investigating exogenous shocks on electoral out-
comes. A number of papers examine the effects of natural disasters or other shocks originating
outside the local economy on elections (see, for example, Abney and Hill (1966); Achen and Bartels
(2004, 2017); Cole et al. (2012); Gasper and Reeves (2011); Healy and Malhotra (2010); Healy et al.
(2010) and Wang and Berdiev (2015)). A consistent finding is that the incumbents’ electoral for-
tunes suffer following such shocks.

Finally, our paper is related to the political business cycle literature that examines how voters
respond to economic conditions. This literature, dating back to Nordhaus (1975), conventionally
assumes voters to be myopic (i.e. they focus only on economic outcomes in election years, as in
Wlezien (2015)). The effect of growth on re-election prospects was found to be insignificant in
most cross-section studies in developed countries, with the United States being an exception (see
Brender and Drazen (2008) for a summary, and Alesina and Rosenthal (1995) for the United States).
Alesina et al. (1997), however, provide evidence that other OECD countries behave similarly to the
United States.

The remainder of the paper is as follows. Section 2 presents the data. Section 3 shows the main
results. Section 4 presents several robustness checks. Section 5 concludes.

       Reversal of Fortune for Political Incumbents after Oil Shocks | Belfer Center for Science and International Affairs   |   February 2021   3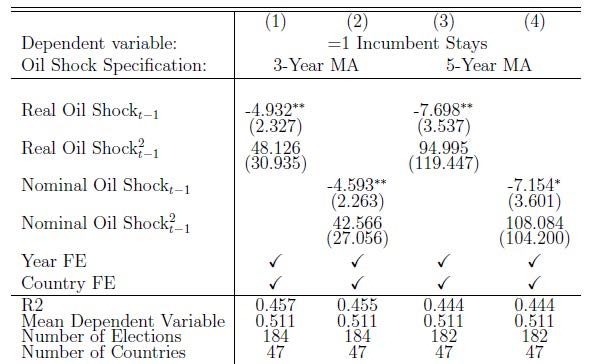
2. Data
Our analysis draws on two main data sets. The first covers election polls and outcomes for 207
elections across 50 countries worldwide over the period 1980-2020. Only elections with available
polling data are included. On average, each country has four elections. There are 149 parliamentary
and 58 presidential elections. The list of countries and the number of elections in each country
by year are presented in Online Appendix Table OA1 and Online Appendix Figure OA1. Most of
the elections in our data set are for recent years. The polling data originate from multiple polling
agencies for each country. Official election results are available from multiple sources. For each
election, voting intentions by political party (i.e. polls) are gathered, alongside election outcomes.1
It is important to consider the political party rather than individual outcomes considering term
limits could create mechanical turnover of individuals. Countries for which polling data are not
available are not included in our data set. In total, the data set has more than 13,333 polling observa-
tions, which are aggregated into 2,552 election-month polling observations for the incumbent party.
Hence, on average, each election has about 12 election-month polling observations.

In addition to voter intentions, we include data on several additional election characteristics. First,
an indicator variable is created to denote elections where the incumbent party remains in power
following the election. This variable is at the party-level, and therefore term limits will not affect the
outcome. For example, consider the 1988 US Presidential Election. George H.W. Bush was elected
president, after Ronald Reagan served two terms. Since the Republican party remained in power,
we treat that episode as the incumbent staying in power.

In cases of political coalitions, where multiple parties form the government, our measure of incum-
bency considers the political party of the chief executive. Second, we collect data on the name of the
political party incumbent, and the political party which wins the election. With those data, the po-
litical orientation of the incumbents and election winners are calculated based on party orientation.

For the majority of elections and parties, data on left-right orientation are taken from the ParlGov
Party Database (Döring and Manow, 2019). These data rate political leaning of parties on a 10-point
scale from left-wing to right-wing. We treat parties with a score below 5 as left-wing. Since the
ParlGov data cover only Europe, data on parties outside Europe are collected using online sources.
Of the 207 elections in our main sample, there are 91 left-wing incumbents and 116 right-wing in-
cumbents. Separately, there are 82 left-wing election winners, and 125 right-wing election winners.
Finally, voter turnout data are collected, as well as an indicator for whether voting is compulsory for
1   In some polls, respondents are allowed to answer election questions with “Don’t Know” or “Not Sure”. This will mechanically
    make voting intentions incompatible with the final election outcomes. In such cases, we drop the extraneous responses, and
    rescale the polls, considering only respondents who have selected a political party.

        Reversal of Fortune for Political Incumbents after Oil Shocks | Belfer Center for Science and International Affairs   |   February 2021   4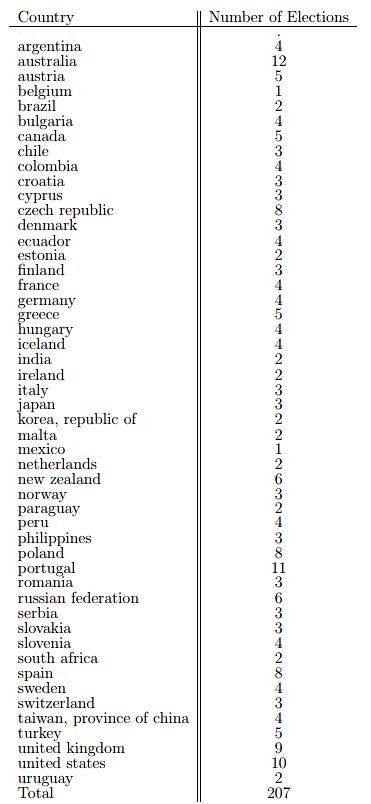
a given election. Most of the data are from the IDEA Voter Turnout Database; any gaps are supple-
mented using online sources.

The main source of shock is based on changes in international oil prices, weighted by the average
country-specific oil import values. International oil prices are obtained from the World Bank “Pink
Sheet” data. That data contain real and nominal crude oil prices; both series are used in our anal-
ysis. Data on the value of oil imports and GDP in US dollars are obtained from the IMF’s World
Economic Outlook. The country-year weights are constructed by taking three-year rolling averages
of oil imports to GDP. Combining these weights with oil prices, our main index is constructed as:

Where weights are calculated as:

For robustness, we also construct five-year rolling weights.

The last data source is the Commodity Terms of Trade Database introduced in Gruss and Kebhaj
(2019). These data consist of country-specific commodity price indices, based on a set of 45 individual
commodities. The formula for the gross import price index is:

In the above specification,   refers to the logarithm of the real price of commodity in time period
        denote the commodity-country-specific weights by which the prices are weighted. The coun-
try-specific weights are based on the ratio of gross imports to GDP. We use a moving average of the
last three years before to construct      .

Online Appendix Table OA2 provides summary statistics for the key variables. For an average election,
the average oil shock in real terms is 0.16 percent, and 0.14 percent in nominal terms. In 51 percent of
the elections, the incumbent party wins the election.

       Reversal of Fortune for Political Incumbents after Oil Shocks | Belfer Center for Science and International Affairs   |   February 2021   5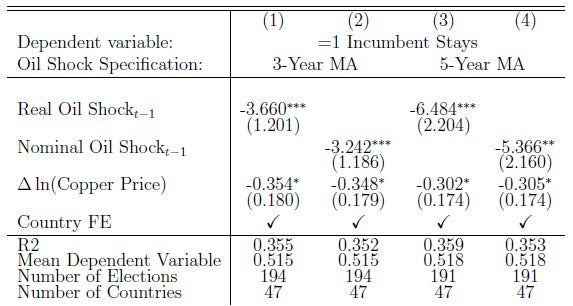
3. Main Results
Our baseline specification is as follows:

where is for country, is for year.                                                    takes the value of 1 if the incumbent
party wins the election.                                                         captures an oil shock one year ago. and
are country and time fixed effects.

Similarly, for the polls, our specification takes the form

where is for election, is for month.                                     takes the value of 1 if
the incumbent party is predicted to win the election.                               captures the
country-specific change in crude oil price index over the last 12 months. and      are election and
month fixed effects.

Table 1 shows that an increase in crude oil prices in the previous year systematically and negatively
affects the reelection chance of the incumbent party. A 0.1% increase in the crude oil index reduces
the reelection chance by 0.5 to 0.8 percentage point depending on the specification. This is quanti-
tatively large given that the average crude oil shock is -0.16 percent. Online Appendix Figure OA2
shows the binned scatter plot of column (1) of Table 1. The relationship is robust.

To address the concern of potential term limits for individual politicians, incumbency is defined at
the party-level, as aforementioned. Hence, an incumbent is considered winning the reelection even
if another member of the party wins the election. An incumbent is considered losing the reelection
when a member of a different party wins the election.

       Reversal of Fortune for Political Incumbents after Oil Shocks | Belfer Center for Science and International Affairs   |   February 2021   6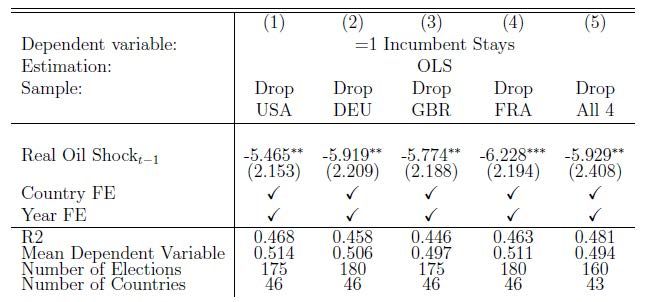
Table 1: Changes in Crude Oil Prices and Electoral Turnover

Note: In columns (1) and (2), oil import exposure is the 3-year rolling average, from t-3 to t-1, of oil imports as a share of GDP. In
columns (3) and (4), oil import exposure is the 5-year rolling average, from t-5 to t-1, of oil imports as a share of GDP. In the first
row, international crude oil prices are in real terms. In the second row, international crude oil prices are in nominal terms. Standard
errors are reported in parentheses, (*** p
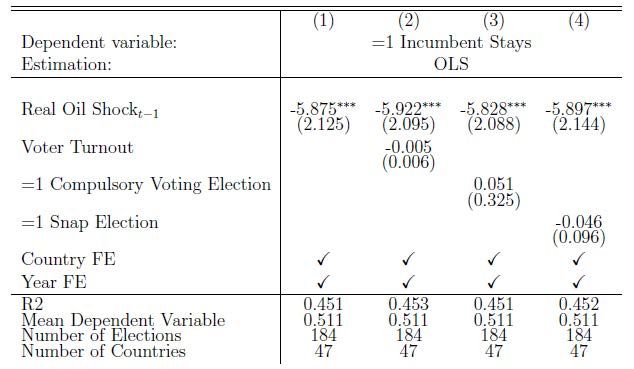
Table 2: Oil Shocks and Final Consumption Growth

Note: In columns (1) and (2), oil import exposure is the 3-year rolling average, from t-3 to t-1, of oil imports as a share of GDP.
Standard errors are reported in parentheses, (*** p
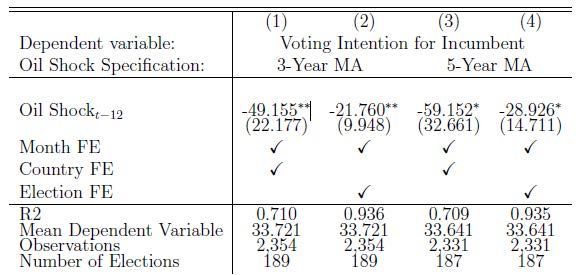
Table 3: Oil Shocks and Turnover by Incumbent’s Political Orientation

Note: In columns (1) and (2), oil import exposure is the 3-year rolling average, from t-3 to t-1, of oil imports as a share of GDP. In columns
(3) and (4), oil import exposure is the 5-year rolling average, from t-5 to t-1, of oil imports as a share of GDP. Standard errors are reported
in parentheses, (*** p
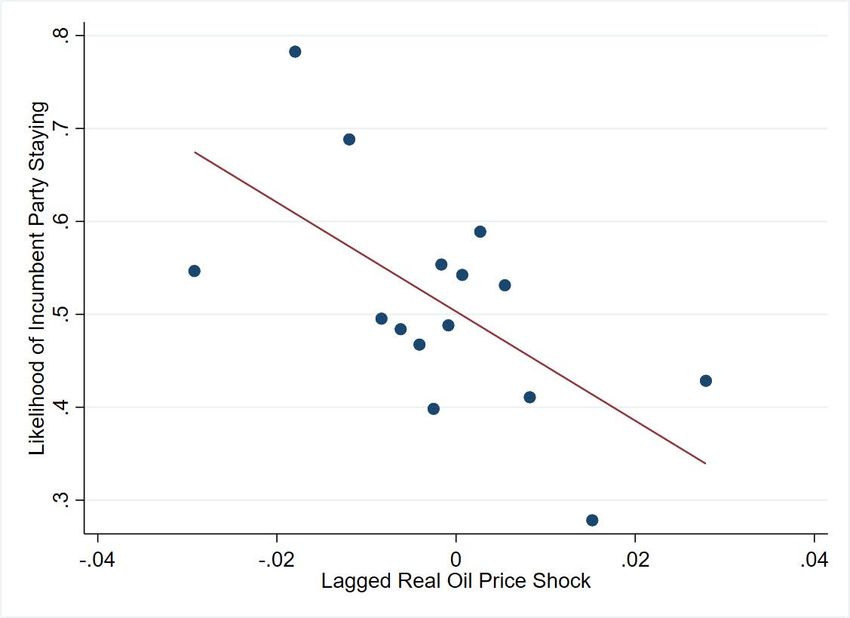
Table 5: Oil Shocks With Lags

Panel A: Annual Lags

Note: Oil shocks calculated using international crude oil prices weighted by 3-year rolling windows of oil import to GDP value for
each country. Annual lags are included. For example, Oil Shockt—1 is Crude Oil Shocks one year before the election. Standard errors
are reported in parentheses, stars indicate *** p < 0.01, ** p < 0.05, * p < 0.10.

Panel B: Quarterly Lags

Note: Oil shocks calculated using international crude oil prices weighted by 3-year rolling windows of oil import to GDP value for
each country. Quarterly lags are included. For example, Oil Shockt—1 is Crude Oil Shocks one quarter before the election. Standard
errors are reported in parentheses, stars indicate *** p < 0.01, ** p < 0.05, * p < 0.10.

          Reversal of Fortune for Political Incumbents after Oil Shocks | Belfer Center for Science and International Affairs   |   February 2021   10
4. Robustness Checks
Our baseline results survive a battery of robustness checks. First, the polling data analyses yield
similar results (Online Appendix Table OA4). A 0.1% increase in the crude oil index 12 months ago
reduces voters’ intention to reelect the incumbent party by 2.2 to 5.9 percentage points. The effect
in the polls is much larger than the magnitude of election outcomes presented in Table 1. The fluc-
tuations in oil prices shift the political fortunes of the incumbent party.
The results are robust to controlling for the change of the import commodity index, consisting of
45 import commodities including oil (see Gruss and Kebhaj, 2019). Appendix Table OA5 shows that
the coefficients of oil shocks remain statistically significant even when the change of the import
commodity index is included, suggesting that oil shocks are the main driver of our result.
When controlling for voter turnout and compulsory voting in elections, the baseline results remain
qualitatively and quantitatively similar (Online Appendix Table OA6). Furthermore, Table OA6 also
controls for whether the election is a snap election or predetermined. This test addresses the con-
cern that the timing of an election could be influenced by oil price movements.
The results are robust to dropping large countries that could arguably influence oil prices (Online
Appendix Table OA7). Online Appendix Table OA8 shows that oil shocks still sway electoral out-
comes even when other macro variables in the current year and one year prior are controlled for,
namely GDP growth, inflation and unemployment rate. Online Appendix Table OA9 shows that the
results are also robust when we control for changes in copper prices, arguably a proxy for global
demand shocks (see Hamilton 2015).
Finally, Online Appendix Table OA10 tests for non-linear effects of oil shocks, as it is possible that
larger oil shocks could have disproportionately larger impacts on electoral outcomes. However, the
quadratic term of oil shocks is not significant, suggesting an absence of non-linear effects.
Reversal of Fortune for Political Incumbents after Oil Shocks | Belfer Center for Science and International Affairs | February 2021 115. Conclusion
We examine the effect of oil shocks on electoral outcomes. The results show that oil price increases
systematically lower the odds of reelection for incumbents. We verify that these shocks—which
are found to reduce consumption growth—are associated with worsening polling performance for
incumbents in the run-up to reelection and a reversal in the leaning of the political party in power.
The systematic nature of the bias against the incumbent irrespective of political leaning suggests
a rejection of the often-argued voting patterns on the basis of ideology. However, our results are
broadly consistent with the traditional assumption in the political business cycle literature of voter
myopia.
Reversal of Fortune for Political Incumbents after Oil Shocks | Belfer Center for Science and International Affairs | February 2021 12References
Abney, Glenn and Larry Hill. 1966. Natural Disasters as a Political Variable: The Effect of a Hurricane on an Urban Election. The
American Political Science Review, 60(4), 974-981.
Achen, Christopher and Larry Bartels. 2004. Blind Retrospection: Electoral Responses To Drought, Flu, and Shark Attacks.
Achen, Christopher and Larry Bartels. 2017. Democracy for Realists: Why Elections Do Not Produce Responsive Government.
Princeton University Press.
Alesina, Alberto and Howard Rosenthal. 1995. Partisan Politics, Divided Government, and the Economy. Cambridge: Cambridge
University Press.
Alesina, Alberto, Nouriel Roubini and Gelrad Cohen. 1997. Political Cycles and the Macroeconomy. Cambridge, MA: MIT Press.
Blanchard, Olivier J. and Jordi Gali. 2009. “The Macroeconomic Effects of Oil Price Shocks: Why are the 2000s so different from the
1970s?” in J. Gali and M. Gertler (eds.), International Dimensions of Monetary Policy, University of Chicago Press (Chicago, IL),
373-428
Brender, Adi and Allen Drazen. 2008. “How do budget deficits and economic growth affect reelection prospects? Evidence from a
large cross-section of countries,” American Economic Review, pp. 2203-2220.
Buchanan, James and Gordon Tullock. 1962. The Calculus of Consent: Logical Foundations of Constitutional Democracy.
Cole, Shawn, Andrew Healy and Eric Werker. 2012. “Do voters demand responsive governments? Evidence from Indian disaster
relief” Journal of Development Economics, Volume 97, Issue 2, Pages 167-181
Degan, Arianna and Antonio Merlo. 2009. Do voters vote ideologically? Journal of Economic Theory, vol 144, pp 1868-1894.
Döring, Holger and Philip Manow. 2019. Parliaments and governments database (ParlGov): Information on parties, elections and
cabinets in modern democracies.
Downs, Anthony. 1957. An Economic Theory of Political Action in a Democracy. Journal of Political Economy, 65(2) pp. 135-150.
Gasper, John and Andrew Reeves. 2011. “Make It Rain? Retrospection and the Attentive Electorate in the Context of Natural
Disasters.” American Journal of Political Science 55(2): 340–55.
Gruss, Bertrand and Suhaib Kebhaj. 2019. “Commodity terms of trade: a new database” IMF Working Paper 19/21.
Hamilton, James. 2003. “What is an oil shock?” Journal of Econometrics, Elsevier, vol. 113(2), pages 363-398, April.
Hamilton, James. 2015. “Demand factors in the collapse of oil prices” https://econbrowser.com/archives/2015/01/
demand-factors-in-the-collapse-of-oil-prices
Healy, Andrew, Neil Malhotra and Cecilia Hyunjung Mo. 2010. “Irrelevant events affect voters’ evaluations of government perfor-
mance.” Proceedings of the National Academy of Sciences 107.29 pp 12804-12809.
Reversal of Fortune for Political Incumbents after Oil Shocks | Belfer Center for Science and International Affairs | February 2021 13Healy, Andrew, and Neil Malhotra. 2010. “Random Events, Economic Losses, and Retrospective Voting: Implications for Democratic
Competence.” Quarterly Journal of Political Science 5(2): 193–208.
Henry, Marc. and Ismael Mourifié. 2013. Euclidean revealed preferences: testing the spatial voting model. Journal of Applied
Econometrics, 28: 650-666.
Hinich, Melvin and Michael Munger. 1994. Ideology and the Theory of Political Choice, Ann Arbor: University of Michigan Press.
Nordhaus, William. 1975. The political business cycle. Review of Economic Studies 42, 169–90.
Wang, Chun-Ping and Aziz Berdiev. 2015. “Do natural disasters increase the likelihood that a government is replaced?” Applied
Economics, issue 17 pp 1788-1808.
Wlezien, Christopher. 2015. “The myopic voter? The economy and US presidential elections.” Electoral Studies 39: 195-204.
Reversal of Fortune for Political Incumbents after Oil Shocks | Belfer Center for Science and International Affairs | February 2021 14Online Appendix for
Reversal of Fortune for Political Incumbents after Oil
Shocks
Our analysis draws on two main data sets. The first covers election polls and outcomes for 207 elec-
tions across 50 countries worldwide over the period 1980-2020. On average, each country has four
elections. There are 149 parliamentary and 58 presidential elections. The list of countries and the
number of elections in each country by year are presented in Table OA1 and Figure OA1.
Table OA2 provides summary statistics for the key variables. For an average election, the average oil
shock in real terms is 0.16 percent, and 0.14 percent in nominal terms. In 51 percent of the elections,
the incumbent party wins the election.
Figure OA1: Number of Elections by Year
Reversal of Fortune for Political Incumbents after Oil Shocks | Belfer Center for Science and International Affairs | February 2021 15Table OA1: Election and Polling Data by Country
Reversal of Fortune for Political Incumbents after Oil Shocks | Belfer Center for Science and International Affairs | February 2021 16Table OA2: Summary Statistics for Main Variables
Figure OA2 shows the binned scatter plot of column (1) of Table 1 in the paper. The scatterplot
shows that the relationship between lagged oil price shocks the reelection chances of the incum-
bent is robust.
Figure OA2: Partial Correlation Scatterplot
Note: Binned scatterplot with 15 equal-size bins. The full sample contains 207 elections. Year and country fixed effects
are residualized to produce the figure.
Reversal of Fortune for Political Incumbents after Oil Shocks | Belfer Center for Science and International Affairs | February 2021 17Table OA3 shows that lagged oil shocks do not have a significant effect on GDP growth. Table OA3: Oil Shocks and GDP Growth Note: Oil shocks calculated using international crude oil prices weighted by 3-year rolling windows of oil import to GDP value for each country. Standard errors are reported in parentheses, (*** p
The results are robust to dropping large countries that could arguably influence oil prices (Table
OA7). Table OA8 shows that oil shocks still sway electoral outcomes even when other macro
variables at current year and one -year prior are controlled for, namely GDP growth, inflation and
unemployment rate. Table OA9 shows that the results are also robust when we control for changes
in copper prices, arguably a proxy for global demand shocks.

Finally, Table OA10 tests for non-linear effects of oil shocks, as it is possible that larger oil shocks
could have disproportionately larger impacts on electoral outcomes. However, the quadratic term of
oil shocks is not significant, suggesting an absence of non-linear effects.

Table OA4: Oil Shocks and Polling

Note: Voting intention captures the percentage of voters intending to vote for the incumbent party. In columns (1) and
(2), oil import exposure is the 3-year rolling average, from t-3 to t-1, of oil imports as a share of GDP. In columns (3)
and (4), oil import exposure is the 5-year rolling average, from t-5 to t-1, of oil imports as a share of GDP. Standard er-
rors are reported in parentheses, (*** p
Table OA5: Oil Shocks, Change in Import Commodity Index and Electoral Outcomes

Note: ComPI IM Rolling captures gross import commodity price index with a 3-year moving average share
across years. Standard errors are reported in parentheses, (*** p
Table OA7: Oil Shocks and Electoral Turnover (without large countries)

Note: Oil shocks calculated using international crude oil prices weighted by 3-year rolling windows of oil import to GDP
value for each country. Standard errors are reported in parentheses, stars indicate *** p < 0.01, ** p < 0.05, * p < 0.10.

Table OA8: Oil Shocks and Macro Covariates

Notes: Oil shocks calculated using international crude oil prices weighted by 3-year rolling windows of oil import to GDP value for
each country. Standard errors are reported in parentheses, stars indicate *** p < 0.01, ** p < 0.05, * p < 0.10.

         Reversal of Fortune for Political Incumbents after Oil Shocks | Belfer Center for Science and International Affairs   |   February 2021   21
Table OA9: Oil Shocks and Changes in Copper Price
Notes: Oil shocks calculated using international crude oil prices weighted by 3-year rolling windows of oil import to GDP value for
each country. Standard errors are reported in parentheses, stars indicate *** p < 0.01, ** p < 0.05, * p < 0.10.
Table OA10 tests for non-linear effects of oil shocks, as it is possible that larger oil shocks could
have disproportionately larger impacts on electoral outcomes. However, the quadratic term of oil
shocks is not significant, suggesting an absence of non-linear effects.
Table OA10: Non-linear Effects of Oil Shocks
Notes: Oil shocks calculated using international crude oil prices weighted by 3-year rolling windows of oil import to GDP value for
each country. Standard errors are reported in parentheses, stars indicate *** p < 0.01, ** p < 0.05, * p < 0.10.
Reversal of Fortune for Political Incumbents after Oil Shocks | Belfer Center for Science and International Affairs | February 2021 22You can also read