BASIC ASSISTANCE WORKING GROUP - 21 FEB 2020 30/09/2014 - Data.unhcr.org
←
→
Page content transcription
If your browser does not render page correctly, please read the page content below
BASIC ASSISTANCE WORKING GROUP
21 FEB 2020
        30/09/2014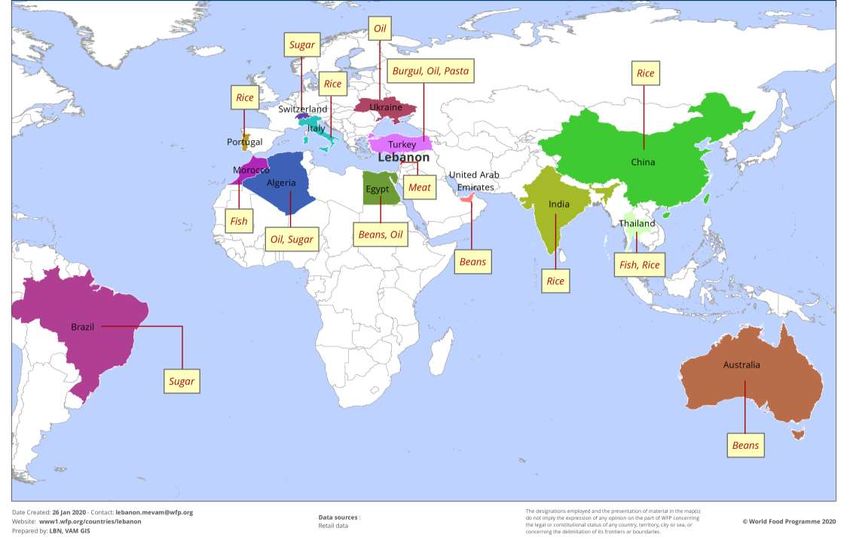
AGENDA
                                                                      Page 2

1) Sector Updates:
   a) Targeting Assistance
   b) 2019 – 2020 Winter Support Update
   c) Protection Risk Analysis Consultation on Field Level Findings
2) Ongoing situation:
   a) Update on the Economic Situation
   b) Update on Food Security and Price Monitoring
   c) Implications on Ongoing Programmes (Discussion)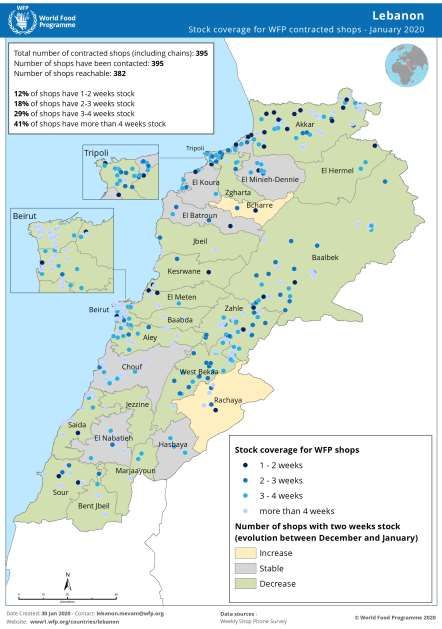
1) Sector Updates:
a. Targeting  Assistance
           30/09/2014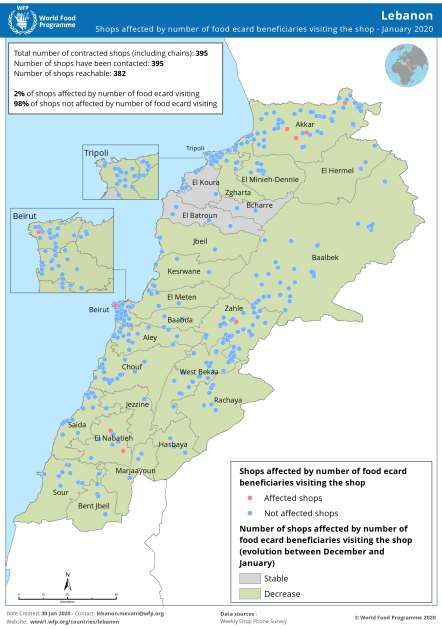
Sector Updates: Targeting Assistance (Regular)                                       Page 4

Reported activities in January 2020 (AI, RAIS)
67,417 vulnerable households received monthly cash transfers / multi-purpose cash:
58,712 SYR HHs (ICRC, RI, UNHCR, WFP, OXFAM, LRC, IOM)
 8,087 PRS HHs (UNRWA)
   618 Leb HHs (LRC)
2,688 SYR HHs – Integrated Child Wellbeing Programme: $80 / Child (UNICEF)

     USD $11,552,440 injected in the local economy (official rate)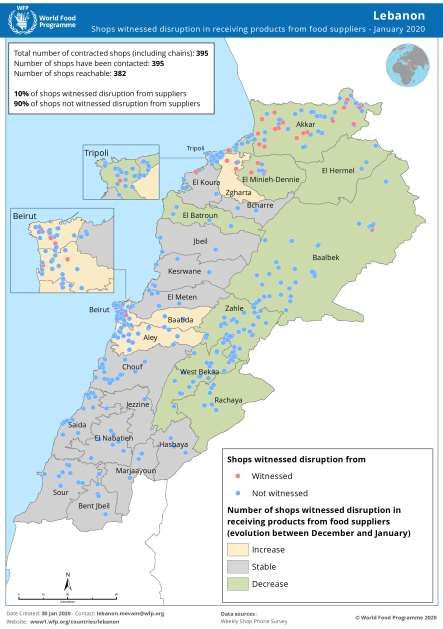
1) Sector Updates:
b. 2019 – 2020    Winter Support Update
          30/09/2014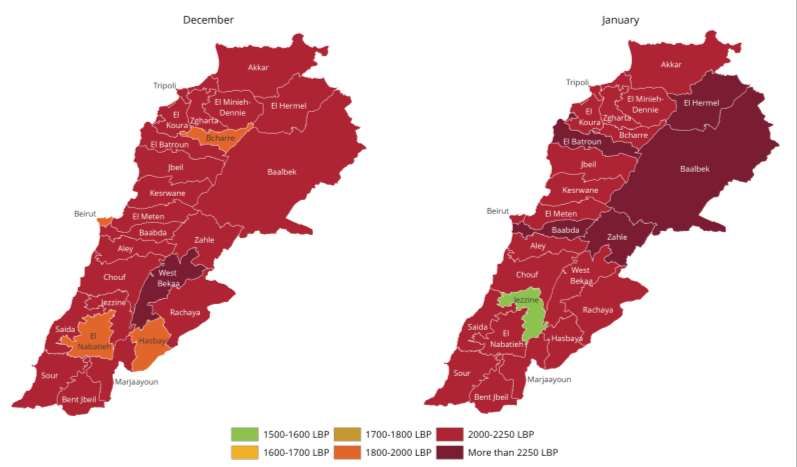
Sector Updates: Targeting Assistance (Seasonal)                                             Page 6

Partners Update – as of end Jan 2020:
•   UNHCR – all uploads finished by end Jan (staggered loadings – because of the ongoing
    situation) – SYR + LEB campaign will be completed end Feb (cash + fuel) - $75 X 5 all HHs below
    MEB + top up for MCAP cases – 3 X $75);
•   UNICEF – all activities finalized for SYR in Dec + new social assistance programme for LEB
    (80,000 / LBP / Child – cap at 6 + 160,000 LBP a base amount) – one off / 13,500 HHs NPTP –
    white card (BLF – hayat card);
•   IOM – 500 SYR ref assisted with winter cash 75
1) Sector Updates:
C. Protection   Risk Analysis Consultation on Field Level Findings
           30/09/2014
Protection Risk Analysis: Overview of field-
Level findings
Basic Assistance Sector
Overview
1.   Methodology
2.   Summary of field-level findings
3.   Next steps
Methodology
•   Review of protection risks
    through secondary data
    sources
•   Regional workshops to
    review these findings &
    suggest actions
Summary of findings:
• Complaint & Feedback (AAP)
• Improve complaint handling processes in place to avoid lengthy resolution processes
which result in the suspension and termination of assistance.
• Take precautionary measures to ensure accurate classification of complaints
• Provide feedback to households who submit an appeal on GRM
• To maximize the use of trends captured through complaint, feedback, appeal & referral
• Safe Identification & Referral
• Build staff capacity to safely identify and refer cases according to minimum standards
and equip staff with service mapping
• Enhance accountability for referrals by reporting referrals made into the Inter-Agency
referral reporting platformSummary of findings:
• Voluntary return
• Minimize harm to households by training staff on common return messages and where
to refer households expressing intention to return
• Meaningful Access
• Strengthen availability of sufficient QL/QN information on protection risks by reviewing
data gaps in current tools and adding needed questions as needed.
• Capture gender, age and disability responses through existing tools
• Improve sharing of protection risks within sector captured through existing tools
• Include age and disability data into beneficiary lists shared with NGO to allow for service
adaptions to be made as/when needed at distribution/validation
• Complement ‘no-show’ data analysis with feedback on peoples experiences accessing
the site, when assessing appropriateness of a site location
• Continue efforts to reduce travel costs and overcrowding by addressing disproportional
distribution of ATMsSummary of findings:
• Inter/intra communal tension
• Advocate with the HCT for improved communication to Lebanese to
increase awareness of support being provided to Lebanese communities
and address misinformation about banking practices for Syrians.
• Minimize risks of intra-Lebanese tension as result of basic needs assistance
by ensuring consistent targeting criteria, establishing functioning
complaint & feedback measures, and addressing perceptions of fairness for
national systems.Next Steps • Review existing sector tools used with beneficiaries to ensure the sector is able to regularly identify, and monitor protection risks. • Prioritize operational recommendations to address protection risks identified. • Develop & endorse sector protection mainstreaming action plan (core group).
2) Ongoing Situation
a. Economic  Situation (BA)
         30/09/2014
Current situation: what to look at? Page 16 limited banking operations, roadblocks, limited private/public sector functionality, shortage in liquidity. • Consequences on markets: fluctuation of informal exchange rate, increase is consumer goods prices. • Consequences on humanitarian assistance / actors: operational delays in transfers and upload / withdrawal of assistance, interrupted operations (card issuance, distributions). • Consequences on households: this can lead to an increase in vulnerability of households, catalysed by diluted purchasing power, limited access to assistance and to markets, resulting in further unmet needs. ➔ Basic Assistance sector is tracking CPI, Ex rate, and assistance redemption rates as proxies
Current situation: Redemption Rates                                    Page 17

Baseline

              95%          93%          91%           97%          96%

           5 - 17 Sept   5 - 17 Oct   5 - 17 Nov   4 - 17 Dec   7 - 17 Jan
Current situation: Consumer Price Index Page 18
+8.47% as of Sept 2019*
8.47%
CPI changes mainly driven by changes in food prices**
*base month for this analysis, +0.31; +10.04% compared to Jan 2019
**pushed by the fluctuation of the informal exchange rate 6.34%
20%
3.63%
28%
1.67% 2.71%
13% 1.96% 2.13%
1.36% Monthly increase
Source: CAS
http://www.cas.gov.lb/index.php/latest-news-en/83-inflation Oct-19 Nov-19 Dec-19 Jan-20Current situation: Informal Exchange Rate (USD selling price)
Page 19
2,600 Observed changes in market dynamics:
Dec 2019
Jan 2020
Nov 2019
Feb 2020
2,400 • 22 Jan – 2 Feb: failed attempts to
control informal rates (2100 -
2,200 LBP vs 1 USD);
2,200 • 4 Feb – 11 Feb: new measures
“Parallel
Market” introduced by banks – shortage in
2,000 “Black USD – biweekly & decreased limits
Market” (2,175 – 2,325);
• 12 Feb – 18 Feb: parliament
1,800
confidence, increased demand on
USD, MEA decisions (15 & 17 Feb)
1,600 (2,300 – 2,525);
Official rate: 1507.5 • More volatility and distortion
1,400 expected as 9 March Eurobonds
Source:
Al Akhbar news paper (7 – 31 Oct) Link; dues approach.
Lebanese Lira: © Copyright 2019-2020 CorruptionRevolution.com, CC Attribution-NonCommercial-NoDerivatives 4.0 International (CC BY-NC-ND 4.0).2) Ongoing Situation
b. Food Security and Price Monitoring
30/09/2014WFP VAM & Supply Chain Unit Lebanon Economic Situation Analysis Results of Supply Chain Assessment Monitoring results for FSSWG meeting (Oct 2019 to Jan 2020) Purchasing Pattern Assessment Review of Food Transfer Value February 2020
Summary
•   Supply Chain
•   Availability of food supplies
•   Access to shops
•   Purchasing Patterns
• Exchange rate
• Price development
• Conclusion
Supply Chain Assessment
Objective of Supply Chain Assessment
➢To understand the wholesaler’s capacity and the supplier-linked risk in the supply chain of
 WFP contracted shops
➢To analyse logistic capacity, stock availability, stock cover, pricing and liquidity of Suppliers.
➢Face to Face discussion with suppliers using a pre-defined questionnaire

•   22 suppliers interviewed in Lebanon
•   10 type of food commodities assessed
•   Current stock amounts to 72,599 MT (as of January 2020)
•   Monthly turnover is equal to 49,982 MT
List of assessed food items and approx. available stocks in mt
(as of January 2020)

29600

        23200

                 6000
                         4300
                                3100    2600   2300
                                                       800    400     400

Rice    Sugar   Bulgur   Oil    Beans   Salt   Pasta   Fish   Meat   Dairy
Origin of food commodities (as of January 2020)
Supplier key activities and characteristics
• 55% of suppliers sell only Food products while 45% of them sell both Food and Non-
  Food products.
• 68% of suppliers own a manufacturing/ production and packaging facilities and have
  their own brands.
• More than 80% of suppliers are acting as importers, distributors and wholesalers.
• 27% of suppliers have direct access to customers and also acting as retailers while
  the remaining 73% of suppliers only serve wholesalers, distributors and Sub-
  distributors.
• Food product turnover is dominated by imported (95%) vs local commodities (5%)
Take away based on suppliers feedback
• Supply issues for food items are not anticipated by the suppliers in the coming weeks.

• The main issue is the shortage of the foreign currency, leading a black market for foreign currencies.
• Shipping cost has slightly increased due to the low volume of food products ordered by suppliers leading to increase the
  selling price of these products.
• Supply of food commodity has been slightly affected due to the facts that suppliers and main players in the market are
  withholding the stock and limiting the quantity sold to 85% of the quantity ordered.
• The retailers are increasing the selling of the food commodities because consumers tend to buy more basic commodities.
• Smaller importers will not be able to adapt their business in the current situation which leads to a slightly increase in
  demand at supplier level.
• Large importers need to rise the volume of their orders to satisfy the increase of demand in the market.
Monitoring results for FSSWG meeting (Oct 2019 to Jan 2020)
Stock coverage of WFP contracted shops (as of 30 th January 2020)

                                         12% of shops have 1-2 weeks stock
                                         18% of shops have 2-3 weeks stock
                                         29% of shops have 3-4 weeks stock
                                         41% of shops have more than 4 weeks stock

                                         → 88% of WFP contracted shops say they have
                                         more than 2 weeks of stock

                                                           •   Total number of shops (including chains): 395
                                                           •   Number of shops have been contacted: 395
                                                           •   Number of shops reachable: 382
                                                          Source: Weekly Shop Phone Survey – as of 30th January
Shops with disruption in receiving products from food suppliers (as of 30th January 2020)
10% of shops witnessed disruptions from
suppliers
90% of shops did not witness disruptions from
suppliers
Source: Weekly Shop Phone Survey – as of 30th JanuaryShops affected by the number of food ecard beneficiaries visiting the shop (as of 30th January
2020)
2% of shops affected by a change in the
number of food ecard beneficiaries visiting
the shop
98% of shops not affected by a change in the
number of food ecard beneficiaries visiting
the shop
(e.g. overcrowding or bulk purchases)
Source: Weekly Shop Phone Survey – as of 30th JanuaryPurchasing Patterns Analysis based on WFP retail
informationPurchasing Patterns Analysis based on WFP retail information Research question: How have purchasing patterns for Syrian and Lebanese evolved since the beginning public unrest? What is the price elasticity of demand for top 10 SKUs? • Two groups of customers analyzed: Syrian and NPTP • Analysis: • Top 30 SKUs in Sale Value ($) and attributed a rank for respective month. • Changes of top 10 SKU rankings mapped out for each customer group. • Periods of time: September to December 2019. • Top 10 SKUs = around 7.5% of the total SKUs purchased in average by month in Sale Value. • Generic analysis of price elasticity of demand – Understand the responsiveness to changes in price for top 10 SKUs
Top 10 items purchased and their rankings for
                         Syrian Beneficiaries
                              September 2019                     1 to 16 October                     17 to 31 of October                   November 2019                        December 2019
                          0

                          5
Ranking per Sale Value

                         10

                         15

                         20

                         25

                                    NBC - WHITE SUGAR 25KG               HORSE HEAD TEA 800G                    HORSE HEAD TEA 400G                NBC - AUSTRALIAN RICE 25KG
                                    NIDO POWDER MILK BAG 2000G           PICON CHEESE TRIANGLES 32PCS 480G      ASEEL VEGETABLE GHEE 4KG           NBC - FLOUR 50KG
                                    ZAIN WHITE SUGAR 25KG                NBC - EGGS 30PCS
Top 10 items purchased and their rankings for
NPTP Beneficiaries
September 2019 1 to 16 October 17 to 31 of October November 2019 December 2019
0
5
Ranking per Sale Value
10
15
20
25
NBC - WHITE SUGAR 25KG HORSE HEAD TEA 800G CARIOCA CAFE COFFEE 450G HORSE HEAD TEA 400G
PICON CHEESE TRIANGLES 32PCS 480G NBC - AUSTRALIAN RICE 25KG NIDO POWDER MILK BAG 2000G ZAIN WHITE SUGAR 25KG
STAR CAFE BRESILIEN EXTRA 453G NBC - FLOUR 50KGTake Away • This analysis provides an analysis for specific SKUs. • Top 3 SKU commodities have remained the same for Syrian and NPTP beneficiaries between September 2019 and December 2019. • Top 10 SKU commodities remain within the top 20 sales ranks. • Top 10 SKUs analysis needs to be expanded to a larger set. • Regrouping of commodity groups necessary to decipher changes more distinctly. • Focus on Food Basket Commodities necessary.
Generic analysis of price elasticity of demand
      for Top 10 SKUs
                                   Percentage change in Percentage change in   Calculated Elasticity of
SKU Description                                                                                           Elasticity
                                   Price                Quantity               Demand

PROCESSED CHEESE BLOCK 1500G                                      6.1%                     2.8               Elastic
                                            2%

VEGETABLE NOODLES 40* 70G                                         4.8%                     2.7               Elastic
                                            2%
TEA 800G                                    3%                   8.4%                      2.4               Elastic
TEA 400G                                    4%                   8.0%                      2.2               Elastic
ZOCK - WHITE SUGAR 25KG                     5%                   10.2%                     2.2               Elastic
ZACK - WHITE SUGAR 25KG                     5%                   9.9%                      1.9               Elastic
EDUSHO INSTANT CAPUCCINO 20* 25G
                                                                  6.4%                     1.7               Elastic
20+2                                        4%
GHU - AUSTRALIAN RICE 25KG                  3%                   -0.1%                     -0.1             Inelastic
FTU - AUSTRALIAN RICE 25KG                  3%                   -0.5%                     -0.2             Inelastic
POWDER MILK BAG 2.25KG                      1%                   -2.6%                     -4.8             Inelastic
Exchange Rates and Price Developments
Weekly exchange rate development based on contracted retailers’
feedback (national level)
                                                                                                                                            • Starting from December 72% of the
                                                                                                                                              suppliers charged WFP contracted
                                Exchange rate suppliers charging WFP contracted shops                                                         shops between 2000-2250 LBP and
100%
                               6%                                                4%                                             3%            11% of the suppliers charged WFP
                                                                                                                                              contracted shops above 2250 LBP.
                                                               11%
90%         18%

80%
                                                43%
                               35%

                                                                                                                                            • In mid of January 30% of the
70%
                                                                                                               65%
60%         44%
                                                                                81%
                                                                                               81%
                                                                                                                                              suppliers charged WFP contracted
                                                                                                                                              shops between 2000-2250 LBP and
                                                               72%
50%                                                                                                                             93%

40%                            34%              30%                                                                                           65% of the suppliers charged WFP
30%                                                                                                                                           contracted shops above 2250 LBP.
            24%
20%                                             12%                                                            30%
                                                                                                2%
                               24%                             10%
10%
            14%                                 15%
                                                                7%
                                                                                10%            17%
                                                                                                               3%                           • In mid of January 93% of the
                                                                                                                                              suppliers charged WFP contracted
                                                                                 4%                                             2%
 0%

                                                                                                                                              shops between 2000-2250 LBP and
       31 October 2019   07 November        18 November    02 December      12 December    30 December    16 January 2020 30 January 2020
                             2019               2019           2019             2019           2019

               1500-1600 LBP         1600-1700 LBP    1700-1800 LBP      1800-2000 LBP    2000-2250 LBP    More than 2250 LBP                 3% of the suppliers charged WFP
                                                                                                                                              contracted shops above 2250 LBP.

 Source: WFP retail data, 2019/2020
Weekly exchange rate development based on contracted retailers’
feedback (district level)
• In December the suppliers charged
WFP contracted shops more than
2250 LBP in West Bekaa
• In January the suppliers charged
WFP contracted shops more than
2250 LBP in 5 districts (Baabda,
Baalbek, El Batroun, El Hermel,
Zahle)
Source: WFP retail data, 2019/2020Daily (official and unofficial) exchange rate development between
November 2019 and February 2020
• Increased volatility in markets led to
first parallel market rate spike on
November 27th at 2200 LBP.
• Stabilization of rate between 2000
LBP & 2100 LBP for most of
December.
+46%
+64% • Increased volatility and uncertainties
at the political level, pushed rates to
the 2500 LBP barrier on January 8th.
• On January 22nd, syndicate of
exchanges set a maximum buy value
of 2000 LBP.
• Black market emerges with a
different exchange rate, higher than
the 2000 LBP.
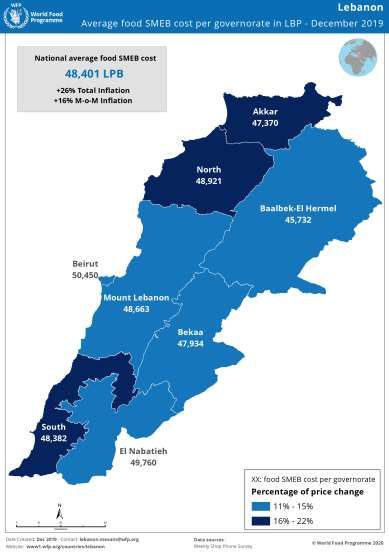
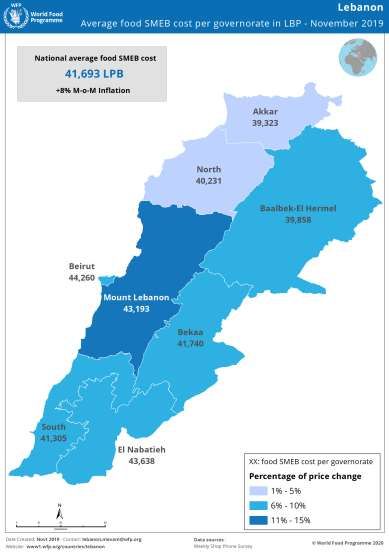
Source: http://lebaneselira.orgChange of weekly & monthly food SMEB price in LPB (national average)
• Since December 2019, the food basket
price was above 45,000 in all
Governorates, with a national average
of approx. 48,316 LBP.
• In January 2020, the highest food
basket prices were found in Beirut
(50,742 LBP) and the lowest in
Baalbeck-Hermel (45,427 LBP).
• Approx. 35 percent weekly food price
(SMEB basket) increase between the
week of the 14th of October 2019 and
the week of 31th of January 2020.
Source: WFP price data, 2019, 2020Monthly average change of SMEB food basket price in % per Governorate – Nov. 2019 to January 2020 Source: WFP price data, 2019 & 2020
Prices Comparison: WFP contracted shops Vs the
Non-contracted shops
• In January 2020 WFP’s retail unit started visiting non-contracted shops to compare price trends with
  contracted shops and will continue throughout the year.
• 59 shops have been visited in all FOs, 52% of them were contracted while 48% of them where non-
  contracted shops.
• 147 food items were collected covering 3 main food categories (Grocery, frozen food , dairy and chilled
  products).
• Out of 147 food items: 92% of those items were available in North and Akkar (contracted/non-contracted)
  shops, followed by Beqaa 78% and Beirut & Mount Lebanon 71%.
• In Beqaa area, the average price value by categories at contracted shops is 3% higher compared to non-
  contracted shops.
• In Beirut & Mount Lebanon, the average price is 0.9% higher compared to non-contracted shops.
• In North & Akkar is only 0.02% higher compared to non-contracted shops.
Thanks!
             Questions?
                WFP Lebanon

Supply Chain Unit & VAM Unit & Programme Unit
2) Ongoing Situation
c. Implications on Ongoing Programmes (Discussion)
30/09/2014Current situation: Implications on Ongoing Programmes (1)
Page 48
What are we doing → what are we planning to do?
I. Monitoring
Tracking of:
II. Analysis
Coping mechanisms; Assessments, surveys;
III. Adaptation
Market behavior (CPI, ex Market information; Targeting refocus;
rate); alignment;
Tensions / perception;
Banking situation; operationalization
(Q4 2019 – Q2 2020)
(Q1 2020 – Q2 2020)Current situation: Implications on Ongoing Programmes (2)
Page 49
Existing Information Gaps
1. Changes in expenditure 2. Economic vulnerability (3) Programmatic impact (MPC): %
patterns for all of Lebanese and method coverage of the SMEB for SYR HHs
population cohorts (pre of identification receiving
to post crisis): Notes:
▪ Existing baselines: Notes:
Notes: 2008 poverty Study ▪ $1 = LBP 1,500 / SMEB at $435 / Q:
▪ overall expenditure (MoSA, UNDP) & 2011 priced in LBP / HH size = 5
volume and purchasing HH Budget Survey ▪ MPC + Food (71% pre crisis)
power; (CAS, WB) ▪ Package Contribution ($175 + $135)
▪ prioritization of basic ▪ Entry points: NPTP, + HH informal income ($125) = $435
needs; other? ▪ Food Basket up by 15% (Dec) / MPC
▪ Coping mechanisms; ▪ World bank estimates (260,000) package lost approx. 30%
on the impact of the ▪ Other factors (coping mechanisms,
crisis informal networks)Current situation: Implications on Ongoing Programmes (3)
Page 50
Analysis & Adaptation: What, How, When?
The “What” questions: The “How” questions: The “When” questions:
• What kind of additional • How can we increased • Based on the risks
information do we still need focus on Lebanese without mitigation measures
to gather? shifting resources? identified, when to a
• What is the impact on the • How can we extend decision to adapt an
programmes? emergency support: existing programme?
• What are the additional specific interventions? • Based on which
needs of different • How are operational triggers?
population cohorts? agencies and stakeholders
• What is possible / not coping?
possible within the existing
BA strategy / framework?You can also read