The Future of Food Security - Robert L. Thompson Professor Emeritus of Agricultural Policy - The Food Bank Leadership Institute
←
→
Page content transcription
If your browser does not render page correctly, please read the page content below
The Future of Food Security

        Robert L. Thompson

  Professor Emeritus of Agricultural Policy
 University of Illinois at Urbana-Champaign

               14 April 2021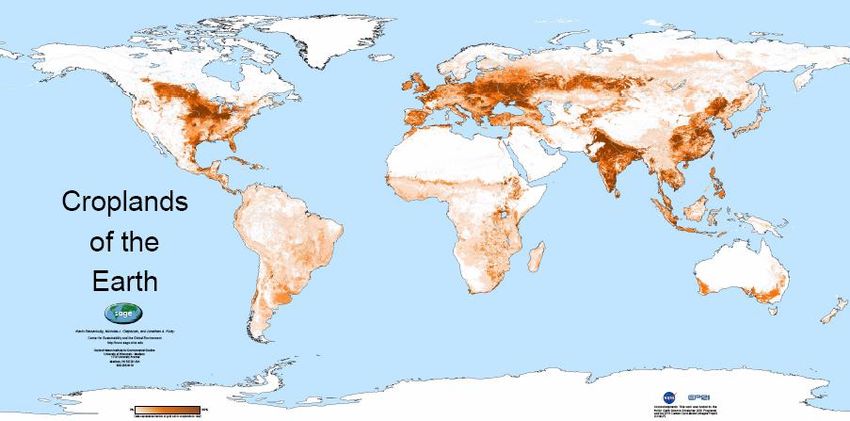
Global Goals for achievement by 2030 adopted by United Nations General Assembly in 2015.
Dimensions of Food Security
• Global Food Security
  – Can the world’s farmers feed its larger population
    better than today at reasonable cost without
    damaging the environment?
• National Food Security
  – Every government has to ensure that its people
    have a reliable, safe and nutritious, reasonably
    priced supply of foodavailable from some
    combination of domestic production and imports.
  – What is the potential for self-sufficiency that is
    economically efficient and environmentally
    sustainable?
• Household Food Security
  – Availability, ability to access; utilization?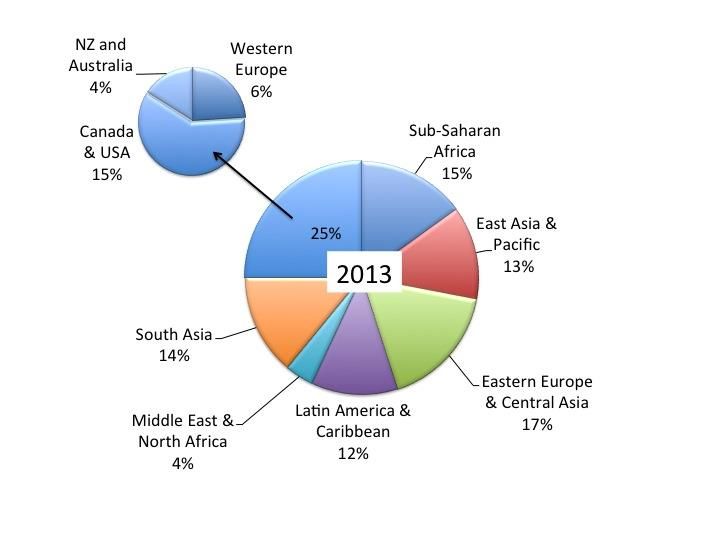
Household Food Security
• Availability: Is there a safe, reliable, and
  reasonably priced supply of all essential
  nutrients available from local production or
  the market year around?
• Access: Does a household have the
  purchasing power to access a nutritionally
  balanced diet from home grown sources or
  the marketplace?
• Utilization: Is a person healthy enough so
  that the nutrients ingested can actually be
  absorbed and used by the body?
Evolution of World Population
• It took from the beginning of time    In 1798, Malthus wrote that
  to 1804 to get to the first billion   food production could not keep
  people on earth.                      up with population growth and
• BUT, the population passed:           that starvation would limit the
    – 2 billion in 1927                 size of the world’s population.
        (123 years later)
    – 3 billion in 1960
        (33 years later)
    – 4 billion in 1974
        (14 years later)
    – 5 billion in 1987
        (13 years later)
    – 6 billion in 1999
        (12 years later)
    – 7 billion in 2011
       (12 years later)
    – 8 billion in 2023
        (12 years later)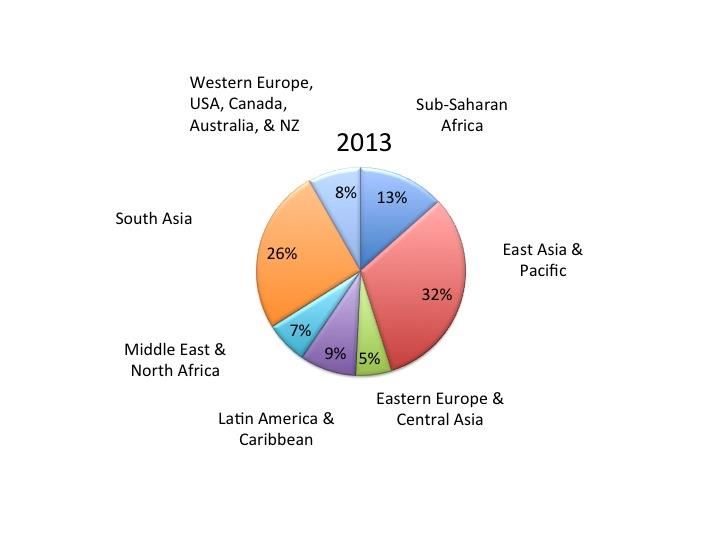
Malthus Got It Wrong
• With the development of ocean shipping, vast new areas
  of land were brought into agricultural production in North
  and South America and Oceania.
• Engineering research developed machines that enabled
  every farmer to cultivate far larger areas of land and
  manage larger herds of livestock and poultry flocks.
• Research on genetics and on control of insects,
  diseases and weeds resulted in big increases in
  production per hectare of land and per animal.
• Instead of limiting population as Malthus predicted,
  global food output has grown faster than consumption,
  the cost of food has trended downwards, and the world’s
  population is now over 7.8 billion.
But Not All Is Well
• While there may be plenty of food grown in the
  world, millions have been left behind with
  inadequate diets—deficient in calories, vitamins,
  minerals and/or amino acids.
• According to FAO, before COVID-19 struck, an
  estimated 750 million people (10% of world’s
  population) were affected by “severe food
  insecurity,” and 690 million were “hungry.”*
  – “Hungry” means lack sufficient purchasing power to
    access even 1,800 calories per day, not enough for
    an adult to put in a medium level of physical activity.

   *Source: FAO. The State of Food Security and Nutrition in the World 2020.
Hunger & Food Insecurity Widespread
• War, natural disaster, and economic crises
cause a great deal of hunger in the world, but
chronic hunger is due mainly to poverty.
• Emergency feeding programs like yours play an
essential role in addressing such human crises,
and there will always be short-term local crises.
• However, to really “solve” the world’s chronic
hunger problem (SDG#2), the world’s poverty
problem must be solved (SDG#1).
• And 80% of extreme poverty is rural.
– Most are farmers; the majority are female; half are
children; most have little or no schooling.
– Despite being farmers, most are net food buyers.
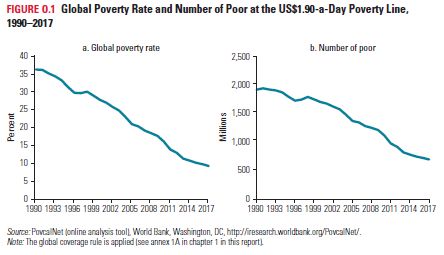
Note: SDG=Social Development Goal.Incredible Progress Was Made at Reducing Poverty
and Associated Hunger Over Three Decades
Fell from 37% to 10% Fell from almost 2
of world population. billion to 700 million.
Source: World Bank. “Poverty and Shared Prosperity 2020: Reversals of Fortune—Overview,” p. 2.COVID-19 Reversed Progress
• COVID-19 has pushed 131 million people
back into extreme poverty (Pew estimate).
• The “new poor” characterized by:
– More urban than rural, living in congested
urban settings and working in sectors affected
by lockdowns and mobility restriction.
– More engaged in informal services or
manufacturing, including food processing.
• Food availability disrupted in some places,
and global food prices have been rising.Disproportionate Regional Impact • While all regions of the world have been affected, the projected increase in global poverty has been concentrated in: – South Asia (78 million), and – Sub-Saharan Africa (40 million)* • It will take years to make up for the years of progress in reducing poverty and associated insecurity that have been lost. • There will be plenty for food banks and other food aid programs to do. *Source: Pew Research Center, March 18, 2021.
Global Food Security:
Prospects for the Future
Projected Population Growth to 2050
                                       (millions)

Region                          2020           2050 Change Percent
World                           7,773          9,876         +2,103              + 27
High Income                     1,219          1,309         +     90            +   7
Low-Middle Income               6,554          8,567         +2,013              + 31
East & S.E. Asia                2,303          2,385         +     82            +   4
South+Central Asia              2,042          2,557         + 515               + 25
Sub-Saharan Africa              1,094          2,192         +1,098              +100
Latin America/Carib                651              759      + 108               + 17
N. Africa & W. Asia                525              785      + 260               + 50
        Source: Population Reference Bureau. 2020 World Population Data Sheet.
Dynamics of Food Demand Growth • As their incomes start to rise, very low income people spend most of the first increments to income on food. • By about $2 per day most “hunger” problems (ability to access enough calories) can be solved • As their incomes rise from about $2 to $10 per day, most people eat more meat, dairy products, fruits, vegetables & edible oils, causing rapid growth in demand for raw ag commodities. • After about $10 per day, people buy more processing, services, packaging, variety, and luxury forms, but not more raw ag commodities.
Regional Distribution of Poverty
        (Less than $1.90* per capita per day), 2015
Region                                                           Millions        Percent
Sub-Saharan Africa                                                  413.3         41.1
South Asia                                                          216.4         12.4
East Asia & Pacific                                                       47.2      2.3
Latin America & Carib.                                                    25.9      4.1
Middle East & N. Africa                                                   18.6      5.0
E. Europe & Central Asia                                                   7.1      1.5
Total                                                               735.9          10.0
*Income corrected for differences in purchasing power across countries.
Source: World Bank. World Development Indicators.
Urbanization Also Changes Diets
The U.N.
projects that
60% of world
population will
live in cities by
2030, and 70%
by 2050.
Source:http://web.worldbank.org/WBSITE/EXTERNAL/NEWS/0,,contentMDK%3A20149913~menuPK%3A34457~pagePK%3A64003015~piPK%
3A64003012~theSitePK%3A4607,00.htmlThe Global Challenge • World demand for food will grow 50-60% by 2050, with population growing 27% from 7.8 to 9.9 billion, and urbanization and poverty reduction changing dietary patterns. • Post-harvest losses take about 1/3 of production. • If losses can be cut by half, world food production will still have to grow by over 40%. • To add complexity, climate change is shifting all agroecological zones and increasing the frequency of extreme climatic events.
The world’s agricultural resources are not
   distributed around in the world in the same
           proportions as is population.

       Distribution of Arable Land                                       Distribution of World Population
East and South Asia have more than twice as much of the
world’s population than of the arable land, and virtually all of
their arable land is already in production. The Middle East &
North Africa have land, but lack enough fresh water.
Source: World Bank. World Development Indicators 2013 database and Population Reference Bureau. 2013 Population Datasheet.
Croplands of the Earth
The darker the shading, the larger the percent
of the land under that pixel that is in crops.
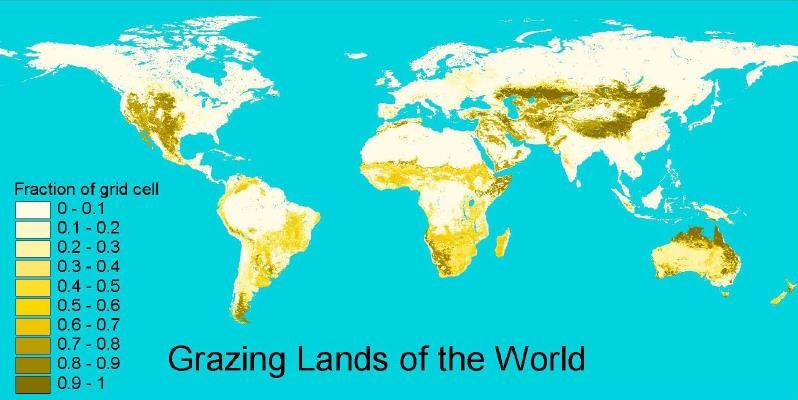
Source: Center for Sustainability and the Global Environment (SAGE), University of Wisconsin.Grazing Lands of the World
There is an even larger area of land which does not receive enough rainfall for
annual crop production which can grow grass that ruminant livestock* can
convert into milk and meat, thereby contributing to the world’s food supply.
The darker the shading, the larger the percent
of the land under that pixel that is in grazing.
*Ruminants include cattle, sheep, goats, bison, buffalo, deer and camels.
Source: Center for Sustainability and the Global Environment (SAGE), University of Wisconsin.The Land Constraint
• There is at most 10% more arable land available
worldwide that isn’t presently forested or subject
to erosion or desertification, and…
• Loss and degradation of many soils continues:
– Urbanization, infrastructure construction, nutrient
mining, erosion, desertification, natural reserves;
reforestation.
• The area of land in global farm production could
be expanded significantly more than 10%…
– But only by destruction of forests, with accompanying
loss of wildlife habitat, biodiversity and carbon
sequestration capacity, accelerating global warming.The Land Constraint (cont’d.) • The only environmentally sustainable alternative is to increase productivity on the fertile, non-erodible soils already in crop production. • Most available cropland is in remote areas of South America and Sub-Saharan Africa where infrastructure is minimal, and soils are inferior in quality to many already in production.
Water--A Growing Constraint
• In their irrigation farmers account for 70% of the
  world’s fresh water use.
• With the rapid urbanization underway, cities are
  outbidding agriculture for available fresh water.
• The world’s farmers, who are being called on to
  increase ag production, will have to do it using
  less fresh water than they are using today.
   – i.e., they have to increase the “crop per drop,” the
     average productivity of the water they use.
• This will require investments in research to
  develop water saving technologies and to
  increase the drought tolerance and water use
  efficiency of the crop varieties being grown.
Solving the Water Constraint • There is one source of optimism that the productivity of the water used in agriculture can be increased. Water is priced at zero to most of the world’s farmers, signaling that it is much more abundant than it is in reality. – Anything priced at zero will be wasted. • There are better technologies available today that increase water use efficiency than farmers are using in many parts of the world, but with water priced at zero, it doesn’t pay to adopt them. • If the politically difficult hurdle of starting to charge farmers for the water they use can be overcome, this would stimulate adoption of the available technologies.
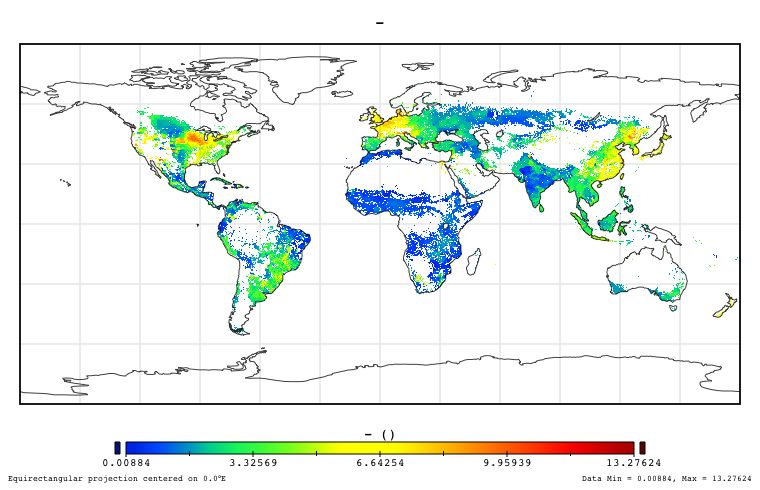
Underperformance of Agriculture
• The agricultural sector in many low income
  countries is underperforming relative to its
  potential that would be consistent with
  both economic efficiency and
  environmental sustainability.
• It produces less food and cash income for
  farm households and contributes less
  output to their national food supply.
Crop
  Yield
  Gap

                                                                                   Source: FAO.

Map Interpretation: Grain yields (maize, wheat and rice) in metric tons per hectare rise from lowest (dark blue) to
highest (dark red). Source: Center for Sustainability and the Global Environment (SAGE), University of Wisconsin.
Sources of Observed Differences in Crop Yields in Different Locations - Genetic potential embodied in the seeds of each crop being grown. - Climatic conditions (level and variation in temperature and precipitation) - Quality of soil (fertility, water holding capacity; resilience) - Supplementation of soil fertility and precipitation with fertilizer and irrigation. - Losses of yield potential from inadequately controlled disease or insect infestations or competition from weeds.
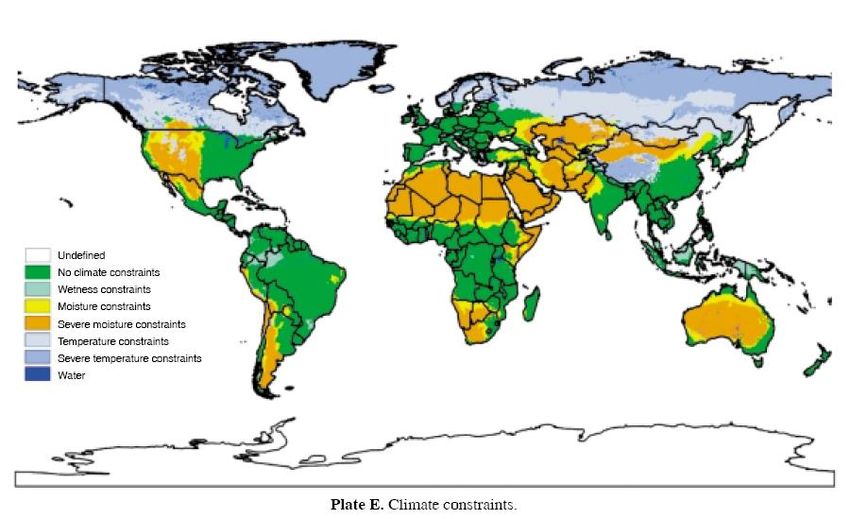
Climate Constraints Changing

• Warming greater over land than over water and greatest
  at higher latitudes.
• Changing spatial distribution of precipitation
• Increased frequency of extreme climatic events
   Source: International Institute for Applied Systems Analysis, Laxenburg, Austria.
Agriculturally Important Effects
         of Climate Change
• More carbon dioxide enhances plant growth
• Higher temperature extends growing season in
  high latitudes; likely detrimental in low latitudes
• Water availability (increased need for irrigation)
• Increased risk from greater climatic variability
  and more frequent extreme events
• Proliferation of pests and diseases further north
• Sea-level rise causes loss of cropland
• Greater erosion and loss of soil fertility from
  greater surface water runoff.
Adaptations Will be Required Due to Global Climate Change • As all agro-ecosystems shift with climate change, larger investments in adaptive plant and animal breeding are needed just to sustain present productivity levels. – e.g. introduce more drought or heat tolerance. • Change the mix of what crops are produced in some geographic locations. • More of world agricultural production will move through international trade.
Agricultural Research Potential
• Fortunately, we are in the golden age of the
  biological and information sciences.
• Modern science gives us potential to:
  – Improve nutritional content of staples (augment
    deficient vitamins, minerals and amino acids).
  – Increase tolerance to drought, wetness, temperature,
    salt,…. (to increase yields and/or planted area under
    adverse or variable conditions)
  – Internalize resistance to insects and diseases to
    reduce pesticide use.
  – Slow down product deterioration.
  – Increase precision in application of fertilizer nutrients
    and pest control media. (Over application is bad
    economics and bad environmental practice.)
Priorities for Ending Extreme Poverty (World Bank President Jim Yong Kim, 4/7/2015) • Increase agricultural productivity. • Build infrastructure to provide access to energy, irrigation and markets. • Invest in health and education, especially for women and children. • Implement social safety nets & provide social insurance. • Promote freer trade that provides greater access to markets for the poor and enables low- & middle-income country entrepreneurs to grow their businesses and create new jobs.
Long-Run Prospects
• The world’s farmers need to increase
  agricultural production at least 40% in the
  next 30 years using less water and little, if
  any, more land than today.
• Malthus has been wrong for more than two
  centuries, and there is no more reason for
  him to be right in the 21st century than in
  the 19th or 20th.
• However, he will continue to be wrong only
  if investments in agricultural development
  increase global agricultural production
  faster than demand grows.
Long-Run Prospects
• Whether world food prices trend upwards,
  downwards or sideways in the 21st century
  will depend on whether agricultural
  research increases land and water
  productivity faster, slower or at the same
  speed as world demand for food grows.
• A long-term increase in the price of food
  would be devastating to low-income
  consumers who spend a large fraction of
  their incomes on food and increase the
  incidence of hunger.
Thank You.

Dr.Robert.L.Thompson@gmail.com
You can also read