Investor Day 2019 Wednesday, 27 March 2019, 10.00AM to 2.00PM NTUC Auditorium, Level 7, 1 Marina Boulevard, Singapore 018989 - Manulife US REIT

Page created by Ruth Love
 
CONTINUE READING
Investor Day 2019 Wednesday, 27 March 2019, 10.00AM to 2.00PM NTUC Auditorium, Level 7, 1 Marina Boulevard, Singapore 018989 - Manulife US REIT
Investor Day 2019
               Wednesday, 27 March 2019, 10.00AM to 2.00PM
NTUC Auditorium, Level 7, 1 Marina Boulevard, Singapore 018989
Investor Day 2019 Wednesday, 27 March 2019, 10.00AM to 2.00PM NTUC Auditorium, Level 7, 1 Marina Boulevard, Singapore 018989 - Manulife US REIT
Peachtree, Atlanta, Georgia
    Important Notice
    This presentation shall be read in conjunction with Manulife US REIT’s financial results announcement dated 11 February 2019
    published on SGXNet.

    This presentation is for information purposes only and does not constitute or form part of an offer, invitation or solicitation of any offer
    to purchase or subscribe for any securities of Manulife US REIT in Singapore or any other jurisdiction nor should it or any part of it
    form the basis of, or be relied upon in connection with, any contract or commitment whatsoever. The value of units in Manulife US
    REIT (“Units”) and the income derived from them may fall as well as rise. The Units are not obligations of, deposits in, or guaranteed
    by the Manager, DBS Trustee Limited (as trustee of Manulife US REIT) or any of their respective affiliates. The past performance of
    Manulife US REIT is not necessarily indicative of the future performance of Manulife US REIT.

    This presentation may contain forward-looking statements that involve risks and uncertainties. Actual future performance, outcomes
    and results may differ materially from those expressed in forward-looking statements as a result of a number of risks, uncertainties
    and assumptions. These forward-looking statements speak only as at the date of this presentation. No assurance can be given that
    future events will occur, that projections will be achieved, or that assumptions are correct. Representative examples of these factors
    include (without limitation) general industry and economic conditions, interest rate trends, cost of capital and capital availability,
    competition from similar developments, shifts in expected levels of office rental revenue, changes in operating expenses, property
    expenses, governmental and public policy changes and the continued availability of financing in the amounts and the terms
    necessary to support future business.

    Investors are cautioned not to place undue reliance on these forward-looking statements, which are based on current view of
    management on future events.

    Holders of Units (“Unitholders”) have no right to request that the Manager redeem or purchase their Units while the Units are listed.
    It is intended that Unitholders may only deal in their Units through trading on Singapore Exchange Securities Trading Limited (the
    “SGX-ST”). Listing of the Units on the SGX-ST does not guarantee a liquid market for the Units.

                                                                             2
Investor Day 2019 Wednesday, 27 March 2019, 10.00AM to 2.00PM NTUC Auditorium, Level 7, 1 Marina Boulevard, Singapore 018989 - Manulife US REIT
Peachtree, Atlanta, Georgia
    Contents

      1      Overview and About Manulife US REIT

      2      Financial and Portfolio Performance

      3      Looking Forward

                                               3
Investor Day 2019 Wednesday, 27 March 2019, 10.00AM to 2.00PM NTUC Auditorium, Level 7, 1 Marina Boulevard, Singapore 018989 - Manulife US REIT
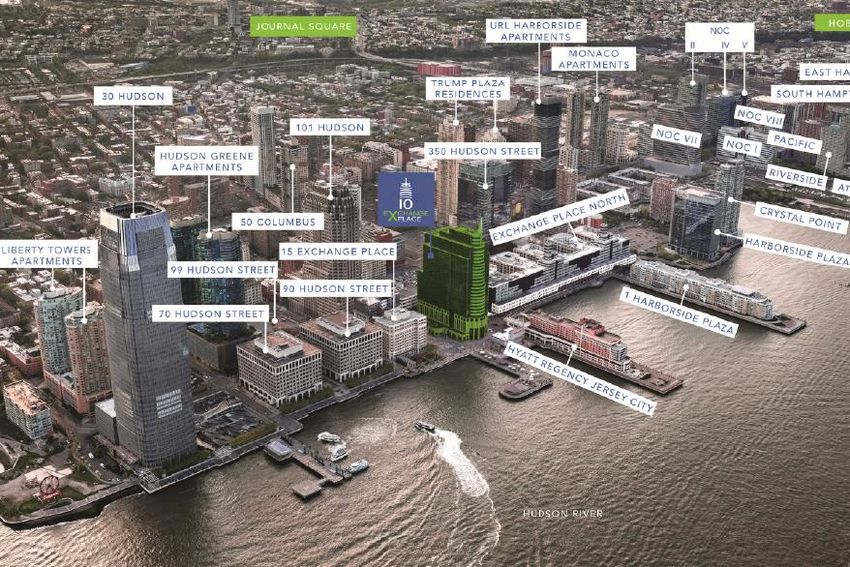
Peachtree, Atlanta, Georgia

 Overview and About Manulife US REIT
Investor Day 2019 Wednesday, 27 March 2019, 10.00AM to 2.00PM NTUC Auditorium, Level 7, 1 Marina Boulevard, Singapore 018989 - Manulife US REIT
Reputable Sponsor with Proven Track Record in
Peachtree, Atlanta, Georgia

    Property Management
                    Vertically-Integrated Real Estate Platform: Global Real Estate AUM of US$17.4 b
                                                   Vancouver
 Sponsor                                                 Calgary           Kitchener/Waterloo

                                                           Edmonton
                                                                            Toronto            Canada
                                                                                 Ottawa        US$6.8 B
                                                                                  Montreal
                                                                                                  AUM

             AUM                                                                     Halifax                71% of Real Estate in Office
           US$794 B                                          U.S.                                                                                       Asia
                                                         US$8.5 B                                                    Others Retail                    US$2.0 B
                                                              AUM                                                     5%                                 AUM
                                                                                                                             5%
                                                                                                                                     Residential
      Manulife Asset Mgt                                                                                                               10%                                   Tokyo, Japan
       Private Markets
                                                                                                                                                               Hong Kong, China
                                                         San Diego
                                                                                  Boston                                               Industrial
                                                        Los Angeles              New York Metro                                           9%                                    Singapore
               AUM                                                                                      Office
                                                       San Francisco        Washington D.C.
             US$93.4 B                                                                                  71%                                                 Ho Chi Minh City, Vietnam
                                                                         Orlando
                                                                                                                                                          Kuala Lumpur, Malaysia
                                                                        Atlanta
                                                                                                                                                         Bangkok, Thailand
                                                                       Chicago
      Global Real Estate
                                                              More than 80                                    Over 540                              John Hancock AUM of
          AUMAUM                                                years of                                     real estate                             US$8.5 b and strong
         US$15B
           US$17.4 B                                          experience in                              professionals in 25                          leasing network of
                                                               real estate                                 cities globally                              >1,000 tenants
 Note: All AUM in fair value basis as at 31 Dec 2018

                                                                                                        5                                                                                   5
Investor Day 2019 Wednesday, 27 March 2019, 10.00AM to 2.00PM NTUC Auditorium, Level 7, 1 Marina Boulevard, Singapore 018989 - Manulife US REIT
Peachtree, Atlanta, Georgia
      Key Milestones since IPO

    20 May 2016                               FY 2016                               1H 2017                     FY 2017               1H 2018              FY 2018
       Listed on SGX                       DPU exceeded                             DPU exceeded                Restated DPU         Adjusted DPU          Adjusted DPU
                                            forecast by                             projection by                 exceeded             increased             increased
                                               4.8%                                     8.0%                  projection by 1.8%      by 2.4% YoY           by 3.6% YoY

             2016                               Feb         Jun        2017                 Aug         Sep        Feb    Apr      2018      Aug           Feb    2019
  AUM:         US$777.5 m                                                                                                                             AUM:       US$1.7 b

         IPO Portfolio                             Acquisition of Plaza                Acquisition of Exchange           Acquisitions of Penn and Phipps
Figueroa, Michelson, Peachtree                        US$115.0 m                            US$315.1 m                             US$387.0 m

Note: For more information, please refer to http://investor.manulifeusreit.sg/investor_relations.html

                                                                                                          6
Investor Day 2019 Wednesday, 27 March 2019, 10.00AM to 2.00PM NTUC Auditorium, Level 7, 1 Marina Boulevard, Singapore 018989 - Manulife US REIT
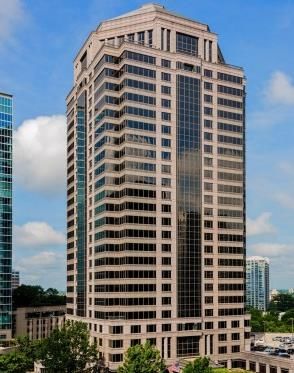
Phipps, Atlanta, Georgia

  Financial and Portfolio Performance
Investor Day 2019 Wednesday, 27 March 2019, 10.00AM to 2.00PM NTUC Auditorium, Level 7, 1 Marina Boulevard, Singapore 018989 - Manulife US REIT
Peachtree, Atlanta, Georgia
               Growing from Strength to Strength in FY 2018

                  US cents                                                              US$ m                                                               US$ m

                 FY                                              1       +3.6%          FY                                 90.7     +55.4%                 FY                                            +32.4%
                                                          6.05
ADJUSTED DPU

                2018                                                      YoY          2018                                                               2018                           1,738.7
                                                                                                                                     YoY                                                                  YoY

                                                                                                                                                   AUM
                 FY                                                                     FY                                                                 FY

                                                                                 NPI
                2017                                      5.84                         2017                  58.4                                         2017                   1,312.8

                 FY                           3                                         FY                                                                 FY
                2016 2                 3.55                                            20161       30.0                                                   2016
                                                                                                                                                                          833.8
                                                  2

                         0         2                  4              6                         0    20     40       60      80     100                           0        500       1000      1500       2000

                   Committed Occupancy                                                         Portfolio valuation +2.3%                                        Acquisitions of Penn and
                       of 96.7%                                                                                                                                  Phipps for US$387.0 m
                                                                                                                                                                contributed from 2Q 2018
(1)            For illustrative purposes, adjusted DPU was calculated based on the weighted average number of Units in issue. The adjusted DPU normalises the impact of enlarged Unit base from the Preferential
               Offering (Penn and Phipps) and Rights Issue (Exchange)
(2)            FY 2016 includes results from 20 May 2016 to 31 Dec 2016
(3)            Actual DPU for FY 2016

                                                                                                                8
Investor Day 2019 Wednesday, 27 March 2019, 10.00AM to 2.00PM NTUC Auditorium, Level 7, 1 Marina Boulevard, Singapore 018989 - Manulife US REIT
Peachtree, Atlanta, Georgia

      Disciplined and Prudent Capital Management
                                                                                                                               Gross Borrowings
                        Well-Spread Debt Maturity                             Profile1
                                                                                                                            US$670.8 m
 US$ m
                                                                                                                                 Gearing Ratio
      300
                                                                                                                                   37.2%2
      250

                                                                                                      As at 31 Dec 2018
             In advanced talks with                      216.5
      200    local and foreign banks                      95.5
                                                                                172.0                                     Weighted Average Interest Rate
                                                          Penn
                                                                                132.0
      150        110.0
               Figueroa
                                                                              Exchange    105.0
                                                                                                                                   3.27%
                                                                                         Phipps
      100                           67.3               121.0
                                  Peachtree           Michelson
                                                                                                                          Weighted Average Debt Maturity
       50
                                                                               40.0
                                                                               Plaza                                             2.7 years
        0
                   2019                2020                2021                 2022      2023

                 16.4%                10.0%               32.3%                 25.6%      15.7%                              Net Asset Value per Unit

                                                                                                                              0.83 US Cents
(1)   Excludes undrawn good news facilities and revolving credit facilities
(2)   Based on gross borrowings as percentage of total assets

                                                                                                  9
Investor Day 2019 Wednesday, 27 March 2019, 10.00AM to 2.00PM NTUC Auditorium, Level 7, 1 Marina Boulevard, Singapore 018989 - Manulife US REIT
Peachtree, Atlanta, Georgia
    Superior Quality of Trophy and Class A Assets

                                                                                                          Exchange, Jersey City
                                                                                             10 minutes from Manhattan across the Hudson River

                                                                                                             Plaza, Secaucus
                                                                                           Affordable alternative to Manhattan attracts leading firms
                Figueroa, Los Angeles
  Boom in residential creates live, work, play environment
                                                                                                         Penn, Washington, D.C.
                                                                                                      Capital, government hub, heart of CBD
                    Michelson, Irvine
          Strong labour pool with senior executives
                                                                                                      Peachtree & Phipps, Atlanta
                                                                                        Capital of the South-East of the U.S.– HQ for Fortune 500 Firms

 As at 31 Dec 2018                   Figueroa     Michelson     Peachtree     Plaza          Exchange        Penn        Phipps               Portfolio
 NLA (sq ft)                          702,861         532,663    557,560     461,525          732,169       277,315     475,199                 3.7 m
 WALE (Years by NLA)                    4.6             3.4        4.9           7.4            6.1           5.9         9.0                     5.8
 Occupancy1 (%)                         93.9           96.0       93.7           98.9          97.7          99.2        100.0                   96.7

 (1) Committed Occupancy

                                                                            10
Peachtree, Atlanta, Georgia

       Cap Rates Stable; Portfolio Valuation +2.3%
          Increase in Valuation due to Proactive Leasing and Continued Strength of Submarkets

                                                                                                                  Implied Cap
                                                                        Valuation
                                                                                                                    Rates2
       Property                  31 Dec                 30 Jun     6M        31 Dec    YoY
                                                                                                 31 Dec 2018      31 Dec 2018
                                  2018                   2018    Change       2017    Change
                                                                                               (US$ per sq ft1)       (%)
                                (US$ m)                (US$ m)     (%)      (US$ m)     (%)
        Figueroa                   329.3                 328.0    0.4        326.0     1.0           469              4.5
       Michelson                   345.0                 342.0    0.9        342.0     0.9           648              4.8
       Peachtree                   203.7                 203.0    0.3        194.2     4.9           365              5.8
           Plaza                   119.8                 119.6    0.2        118.0     1.5           260              6.8
       Exchange                    340.7                 336.9    1.1        332.6     2.4           465              4.9
           Penn                    189.0                 187.0    1.1       182.03     3.8           682              4.8
         Phipps                    211.2                 207.2    1.9       205.03     3.0           444              5.8
     Total/
                                 1,738.7               1,723.7    0.9       1,699.8    2.3           465              5.1
  Weighted Ave
 (1)   Based on NLA as at 31 Dec 2018
 (2)   Based on valuation by Colliers
 (3)   Based on acquisition price announced on 13 Apr 2018

                                                                             11                                                 11
Peachtree, Atlanta, Georgia

    Minimal Leases Due in 2019; Long WALE of 5.8 Years
 Lease Expiry Profile as at 31 Dec 20181 (%)                                                                               Well-Diversified Tenant Base

                                                                                                                                                         Accommodation
                                                                                             51.1%                                  Manufacturing,      and Food Services,
                                                                                     48.7%                                              1.6%                  1.0%
                                                                                                                                                                        Other, 2.3%
                                                                                                                                      Architectural and
                                                                                                                                     Engineering, 1.8%
          Gross Rental Income                                                                                                                                                           Legal, 22.0%
                                                                                                                                Accounting, 2.2%
          Net Lettable Area                                                                                                   Advertising, 2.5%
          Renewed Hyundai’s lease of ~97,000 sq ft Jan 2019                                                             Transportation and
                                                                                                                        Warehousing, 2.6%
                                                                                                                    Health Care, 2.9%

                                                                                                                         Arts,
                                                                                                                  Entertainment, and
                                                                                                                   Recreation, 3.3%

                                                    16.6% 16.7%                                                  Real Estate, 3.4%

                                                                                                                 Grant Giving, 3.9%
   5.5%           8.4% 8.0%                                         9.2%     9.6%
                                       7.1% 7.3%
  5.5%
          4.6%                                                                                                    Information, 4.7%
   4.6%
           2.7%

    2019              2020              2021             2022              2023          2024 and                       Consulting, 4.7%
                                                                                                                                                                                                Finance and
                                                                                          beyond                                                                                             Insurance, 20.2%
                                                                                                                                    Public
                                                                                                                                 Administration,
                                                                                                                                    4.8%
    Positive Rental Reversion                             Annual Rental Escalations
                                                                                                                                                                 Retail Trade,

                  +8.9%            1
                                                                     ~2.0%                                                                                          16.2%

    +12.2% in FY 2017; +10.5% in FY 2016                            94% of leases by GRI2                                Amounts may not sum to 100% due to rounding
                                                                                                                         Data as at 31 Dec 2018

     (1)    Weighted by NLA. Excludes leases signed in suites vacant more than 12 months prior to execution. Rental reversions will only be disclosed when substantial and meaningful
     (2)    Annualised Annual and mid-term rental escalations

                                                                                                    12
Peachtree, Atlanta, Georgia
    Limited Supply in Our Cities
                                           Majority of our Properties are 5% - 10% Below Market Rents

                                              New                                  Class A Inventory                                                 Manulife US REIT1
                                          Properties
  Market                                     Under                                                           Gross Asking                                                    Gross
                                         Construction                 RBA                 Vacancy                                                            Vacancy
                                                                                                             Rent per sq ft            Properties                         Passing Rent
                                          (‘000 sq ft)              (mil sq ft))            (%)                                                                (%)
                                                                                                                (US$)                                                        (US$)
  Downtown Los
                                                   0                    39.1                 14.5                  43.70               Figueroa                  6.1         41.03
  Angeles
  Irvine, Orange County                            0                    14.6                 17.2                  35.68               Michelson                 4.0         51.57

  Midtown Atlanta                              1,1312                   15.9                  9.2                  38.93               Peachtree                 6.3         32.54

  Meadowlands3                                     0                     3.5                18.04                  30.11               Plaza                     1.1         30.74

  Hudson Waterfront5                               0                    18.7                 17.1                  45.28               Exchange                  2.3         40.18

  Washington, D.C.                             1,2646                   30.5                 10.7                  55.61               Penn                      0.8         35.58

  Buckhead Atlanta                                 0                    16.1                 13.9                  38.10               Phipps                    0.0         52.44
 (1) Data as at 31 Dec 2018
 (2) Approximately 50% pre-leased
 (3) Secaucus is within the Meadowlands submarket
 (4) Vacancy and availability include old and uncomparable buildings. Plaza’s competitive set has vacancy rate of only 6%. New construction is not comparative to Plaza
 (5) Jersey City is within the Hudson Waterfront submarket
 (6) Of the properties under construction, only ~154,000 is directly comparable to Penn and is approximately 100% pre-leased
 Source: CoStar Market Analysis & Forecast – As at 3 Jan 2019

                                                                                                    13
Peachtree, Atlanta, Georgia

        Advantage of U.S. Trophy/Class A Office
          Trophy/Class A Assets Provide Strong Income in Upcycles and Remain Resilient during
               Market Turmoil as compared to Class B & Lower Class Business Park Assets

                                                                    Trophy                                                    Class A                                                 Class B
                                                                                                                                                          Older buildings with basic
             Description                Highest quality buildings                                High quality buildings
                                                                                                                                                          design/materials
                                                                                                 < 15 years, if older, has been renovated
             Age                        15 years
                                                                                                 to maintain its status
             Location                   Best location and great accessibility                    Central location and great accessibility                 Location less identifiable
                                        • Timeless in architecture, renowned                                                                              • Outdated features, may require
                                                                                                 • High quality building finishes
             Features and                 for quality                                                                                                       renovation
                                                                                                 • Abundant amenities
             amenities                  • Abundant amenities                                                                                              • Limited amenities
                                                                                                 • Proactive management and
                                        • Proactive management and                                                                                        • Average management and
                                                                                                   maintenance
                                          maintenance                                                                                                       maintenance
             Typical Tenants            Multi-national companies                                 Multi-national companies                                 Small & medium enterprises

             Rents                      Command highest rents                                    Above market rents for area                              Discount to Class A

Source: Company. There are no formal or international standards established for building classes; each building’s classification is relative to its own market, and criteria may vary from one market to another.

                                                                                                           14
Artist Impression of AEI in Figueroa, Los Angeles

 Looking Forward
Peachtree, Atlanta, Georgia

    U.S. – World’s Largest Real Estate Market
     Investment
       Criteria

            Long WALE

              High
            Occupancy

         Live, Work, Play
           Environment

             Strong
            Economic
          Fundamentals

             Trophy/
          Class A Assets

Notes:
States MUST is in are highlighted in green
Class A cap rates highlighted in blue
C: CBD cap rates; S: Suburban cap rates
Source: CBRE Cap Rate Survey – Second Half 2018

                                                  16
Peachtree, Atlanta, Georgia
    Poised for Growth

                   Macro Environment                          Micro Environment

   1    Despite challenging global economic          1   Continue to drive leasing and asset
        backdrop, U.S. economy remains bright            management
        spot

                                                     2   Refinance Figueroa loan; target to
   2     Rate Hikes – Fed remains patient
                                                         unencumber

   3     Proposed US tax regulations and             3   Opportunistic acquisitions in strong
         Barbados tax changes no material                growth markets with desirable Live,
         impact                                          Work, Play environment

                                                17
For enquiries, please contact: Ms Caroline Fong, Head of Investor Relations
       Direct: (65) 6801 1066 / Email: carol_fong@manulifeusreit.sg

                      http://www.manulifeusreit.sg
Peachtree, Atlanta, Georgia

      FY 2018 Adjusted DPU1 Increased 3.6% YoY
                                               4Q 2018                  4Q 2017                   Change                   FY 2018                    FY 2017                      Change
                                              (US$’000)                (US$’000)                    (%)                   (US$’000)                  (US$’000)                       (%)

 Gross Revenue                                   40,501                   29,264                      38.4                  144,554                     92,040                         57.1

 Net Property
                                                 25,491                   18,418                      38.4                   90,665                     58,351                         55.4
 Income

 Net Income                                      20,509                   18,943                       8.3                   64,520                     57,964                         11.3

 Distributable
                                                 19,586                   14,641                      33.8                   70,981                     46,716                         51.9
 Income

 DPU (US cents)                                    1.53                      1.42                     7.72                      5.57                       5.77                       (3.5)3

 Adjusted DPU
                                                   1.54                      1.52                      1.3                      6.05                       5.84                         3.6
 (US cents)1

(1)   For illustrative purposes, adjusted DPU was calculated based on the weighted average number of Units in issue. The adjusted DPU normalises the impact of enlarged Unit base from the Preferential
      Offering (Penn and Phipps) and Rights Issue (Exchange)
(2)   4Q 2018 DPU was higher than 4Q 2017 DPU largely due to income contribution from the properties acquired in 2018 and full quarter income contribution from Exchange acquired on 31 Oct 2017
(3)   FY 2018 DPU was lower than FY 2017 DPU largely due to the enlarged Unit base from the issuance of Preferential Offering to partially fund Penn and Phipps acquisitions, but income contribution from
      Penn and Phipps was only from acquisition date on 22 Jun 2018

                                                                                                    19
Peachtree, Atlanta, Georgia

    Tax Advantaged Tax Structure
        1 MUST’s tax advantage                                                                                       For illustrative purposes only

               • No US corporate taxes (21%)                                                                                 US REIT                 S-REIT1             Manulife US REIT

                                                                                             DPU Yield                         3.2%2                   7.2%                   7.2%3
               • No US withholding taxes (30%)
                                                                                   U.S. Withholding Taxes                     (1.0%)                      -                     -
               • No Singapore corporate taxes on                                        Net Yield –
                                                                                                                               2.2%                    7.2%                   7.2%
                 domestic institutions (17%) or                                   Singapore Retail Investor
                 Singapore withholding taxes                                             Net Yield –
                 (10%)                                                                                                         2.2%                    6.0%4                  7.2%
                                                                                    Singapore Institutions
                                                                                          Net Yield –
               • Minimum taxes paid (1.5% to                                                                                   2.2%                    6.5%5                  7.2%
                                                                                      Foreign Institutions
                 2.5% of distributable income)

        2         MUST’s tax structure supported by 4 strong pillars

        3         Stable U.S. tax jurisdictions
      (1) Singapore REIT with Singapore assets only. For illustrative purposes, the DPU yield for S-REIT is assumed to be the same as Manulife US REIT
      (2) Weighted Average of analyst consensus for FY 2019 distribution Yield of 18 US Office REITs listed in US stock exchange as at 25 Mar 2019 (Source: Bloomberg)
      (3) Analyst consensus for Manulife US REIT’s FY 2019 distribution yield as at 25 Mar 2019 (Source: Bloomberg)
      (4) Singapore institutions incur 17% corporate tax on the Singapore sourced income portion of the distribution
      (5) Foreign institutions incur 10% corporate tax on the Singapore sourced income portion of the distribution

                                                                                                20
MUST’s Tax Structure1
                                                                   Predominantly Supported by Four Pillars

                                                                                                                                               Sponsor
                                                                                                                                                                  Unitholders
                Parent US REIT Structure                                                                                                       Manulife           (9.8% limit)4
        1        • Tax transparency – Dividends distributed are deductible
                 • Income shielded by interest expense and depreciation                                                                                                  0% Tax

                US Portfolio Interest Exemption Rule
        2       • No 30%2 withholding tax on interest and principal on
                  shareholder’s loan

                Barbados Entities (US Tax Act Dec 2017 Section 267A)
        3        • Barbados limited partnerships3 are “fiscally transparent”
                                                                                                                                100%                                                   100%
                                                                                                                                                                                  Shareholder Loan
                 • Interest income on intercompany loans are taxed in                                                     Equity SPV                                                   SPVs5
                                                                                                              Singapore
                   Barbados and principal repayments are not subjected to tax
                                                                                                              Barbados         100% Wholly-owned                        100% Wholly-owned

        4       Foreign Sourced Income
                                                                                                                                                                                    Barbados Entities3
               • Zero tax in Singapore - Foreign sourced income not subject to
                 tax
(1)   As at 1 Jan 2018. Please refer to the SGX announcement dated 2 Jan 2018 titled “Redemption of
      Preferred Shares by U.S. REITs and Proposed Establishment of Wholly-Owned Entities” for details of
      the restructuring undertaken by MUST
                                                                                                                                  Dividends6                               Interest & Principal2
(2)   Principal repayments are not subject to U.S. withholding taxes. Interest payments are not subject to     U.S.                                       Parent U.S.
      U.S. withholding taxes assuming Unitholders qualify for portfolio interest exemption and provide                                                       REIT         Intercompany Loans
      appropriate tax certifications, including an appropriate IRS Form W-8
(3)   The Barbados Limited Partnerships have extended loans to the Parent U.S. REIT and the interest
      income on the loans is taxed in Barbados
                                                                                                                                                              Subs7
(4)   No single investor to hold more than 9.8% (including the sponsor) - ‘Widely Held’ (No more than 50%
      of shares can be owned by 5 or fewer individuals) rule for REITs in US – applies to pillars 1 and 2
      above
(5)   There are three wholly-owned Shareholder Loan SPVs, each of which has made equity investments in                                                    Properties
      two wholly-owned Barbados entities which had formed a Barbados Limited Partnership                                        Figueroa, Michelson, Peachtree, Plaza, Exchange, Penn, Phipps
(6)   Subject to 30% withholding tax
(7)   Each Sub holds an individual property

                                                                                                         21
You can also read