Investor Presentation - Q1 2020 - Seeking Alpha
←
→
Page content transcription
If your browser does not render page correctly, please read the page content below
Q1 2020
Investor Presentation
FORWARD-LOOKING STATEMENTS AND NON-IFRS FINANCIAL MEASURES
 This material may contain forward-looking statements, including those identified by the expressions “anticipate”, “believe”, “plan”, “estimate”, “expect”, “intend”
 and similar expressions to the extent they relate to First Capital REIT (“First Capital”) or its management. The forward-looking statements are not historical facts
 but reflect First Capital’s current beliefs and are based on information currently available to management. Certain material factors and assumptions were applied
 in providing these forward-looking statements, many of which are beyond our control.

 Management believes that the forward-looking statements are based upon reasonable assumptions; however, management can give no assurance that actual
 results will be consistent with those expressed or implied in these forward-looking statements. These forward-looking statements are subject to a number of
 risks and uncertainties that could cause actual results or events to differ materially from those expressed or implied in these forward-looking statements.
 Additional information about the risks and uncertainties that could cause actual results to differ materially, and the material factors or assumptions that were
 applied in providing these forward-looking statements, are contained in our various securities filings, including our quarter end results press release dated May
 5, 2020, our Management’s Discussion and Analysis for the year ended December 31, 2019 and for the three-month period ended March 31, 2020 (the
 “MD&As”) and our current Annual Information Form, all of which are available on SEDAR at www.sedar.com and on our website at www.fcr.ca.

 You should not place undue reliance on any such forward-looking statements. Further, a forward-looking statement speaks only as of the date on which such
 statement is made. These forward-looking statements are made as of May 5, 2020. Except as required by securities law, First Capital undertakes no obligation
 to publicly update or revise any such statements whether to reflect new information, the occurrence of future events or circumstances, or otherwise.

 This material references certain non-IFRS financial measures, including but not limited to FFO, FFO per share, NOI and NAV. These non-IFRS measures are
 further defined and discussed in the MD&As, which should be read in conjunction with this material and the conference call. Since these non-IFRS measures do
 not have standardized meanings prescribed by IFRS, they may not be comparable to similar measures reported by other issuers. First Capital uses and presents
 the above non-IFRS measures as management believes they are commonly accepted and meaningful financial measures of operating performance.
 Reconciliations of certain non-IFRS measures to their nearest IFRS measures are included in the MD&As. These non-IFRS measures should not be construed as
 alternatives to net income or cash flow from operating activities determined in accordance with IFRS as measures of First Capital’s operating performance.

 All figures in this presentation are as of March 31, 2020 unless otherwise noted.

                                                                                                                                                           First Capital   2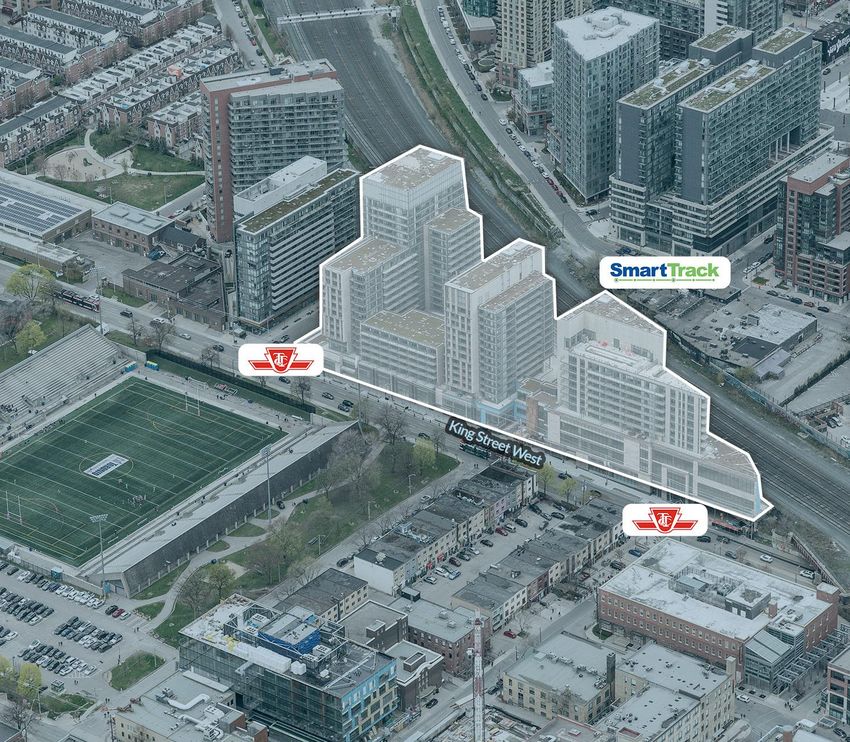
COMPANY SNAPSHOT (TSX: FCR.UN)

One of Canada’s leading, developers, owners and operators of mixed-use urban real estate in Canada’s most
densely populated centres

          151
        Neighbourhoods
                                                                           23.2m sf
                                              Super                          of gross leasable area
                                                                            (20.7m sf at FCR share)

                                        urban
        $8.0b                      Market focus across Canada
                                                                            25.0m sf
    Total enterprise value                                                of future incremental density

As of March 31, 2020

                                                                                                 First Capital   3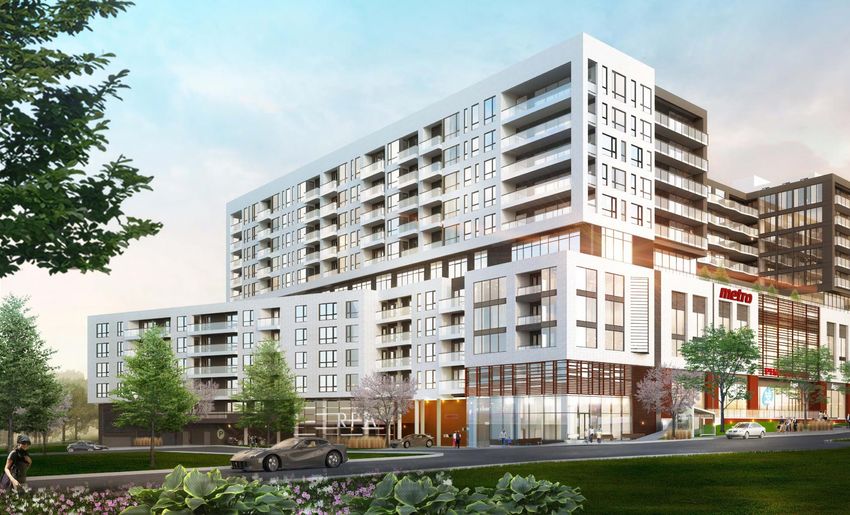
COVID-19 RESPONSE PLAN

Business Environment Update
• All employees working remotely or on a limited, rotational basis at our properties providing essential services
• Following all governmental directives to ensure the safety of all stakeholders
• Essential tenants open (~50% of gross monthly rent), remaining tenants closed or operating at a reduced capacity
• Due to temporary work stoppages, some delay in development spend and completion dates expected
• Municipal offices functioning at reduced capacity delaying some entitlement submissions and approvals
• $916m of dispositions in the past 15 months (over 60% of $1.5b target). Disposition program now temporarily
  paused
• Collected ~74% of gross rents payable from tenants for the month of April

Supporting Our Communities

• Launched $30m Small Business Support Program
    o Qualifying tenants can defer 2 months of Q2 rent with payments over a 12-month period
    o 1,200 tenant requests totaling ~$8.3m or 15.3% of gross monthly rent
• Providing healthy and delicious meals to frontline workers in partnership with food tenants

                                                                                                            First Capital   4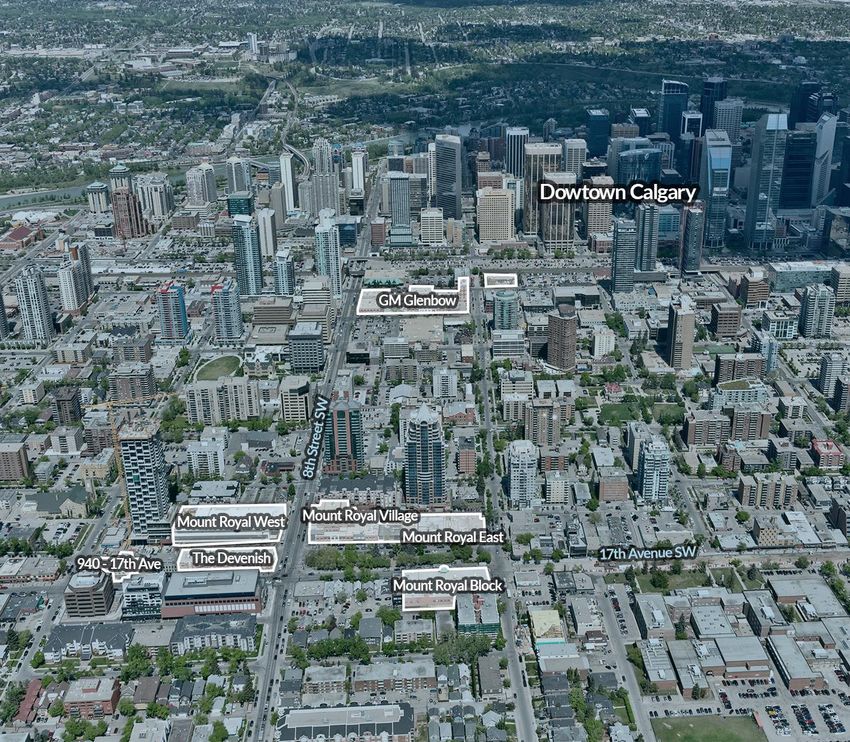
COVID-19 RESPONSE PLAN

Maintaining a Strong Balance Sheet and Liquidity Position

• ~$680m of cash and undrawn credit facilities
• Unencumbered properties with an IFRS value of ~$7.0b
• Remaining 2020 debt maturities ~$80m
• Reducing 2020 development spend and cost by ~$75m
   • ~$60M reduction in capex and development spend
   • ~$15M reduction in G&A and property operating costs

Enhancing Asset Quality
• Asset quality has never been higher due to extensive disposition program and ongoing super urban investments
     o 5km population increased to 293k. Highest amongst North American peers
     o 5km household income increased 13% from 2016 to $120k
     o Average base rent increased 11% from 2016 to $21.51 psf. ~30% higher than Canadian peer average

*Numbers As of May 5, 2020

                                                                                                      First Capital   5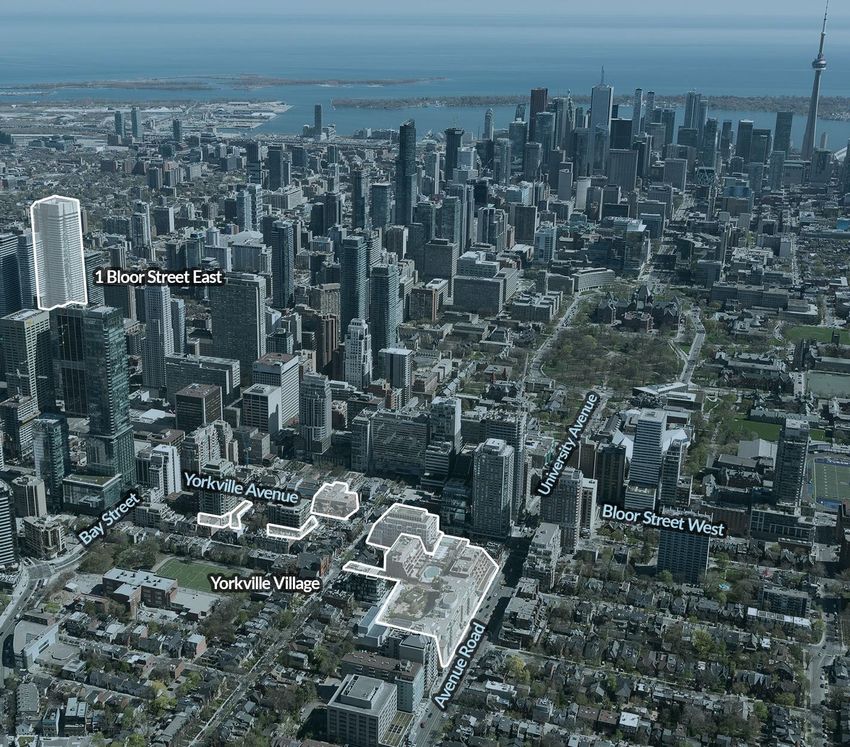
SUPER URBAN INVESTMENT STRATEGY

Creating thriving super urban neighbourhoods that drive sustainable growth in cash flow and capital
appreciation of our best in class portfolio

• Investing in high-quality, mixed-use properties to build positions in targeted high growth areas

• Fully integrating retail with other uses to create thriving urban neighbourhoods

• Optimizing the portfolio through active asset management and by concentrating capital in dense, high
  growth neighbourhoods

• Surfacing substantial unrecognized value in our 25.0m sf of density pipeline through development

• Actively managing our balance sheet to maintain financial strength and flexibility and a competitive cost of
  capital

                                                                                                      First Capital   6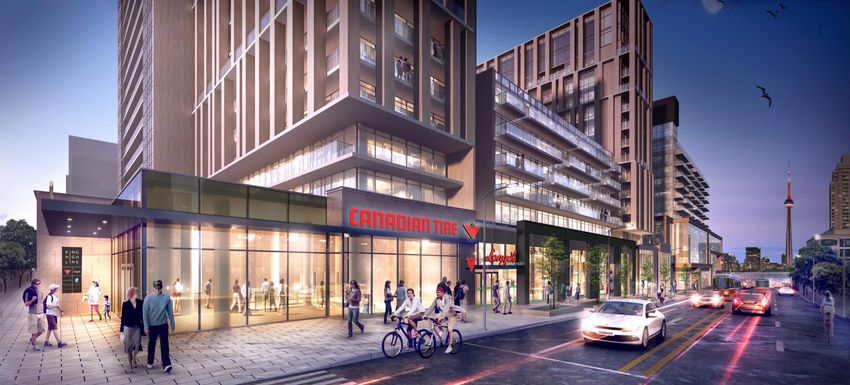
SUPER URBAN NEIGHBOURHOODS

 We define a super urban property based on its proximity to transit, its “Walkability Score”, and most
 importantly its population density and expect to continue to improve these metrics over time through our
 investment and disposition activity.

   >99%
      Public Transit
                       Of portfolio within 5-minute walk of public transit

       78
       Walk Score
                       Average walk score for our portfolio = ‘Very Walkable’

                                                                                                    First Capital   7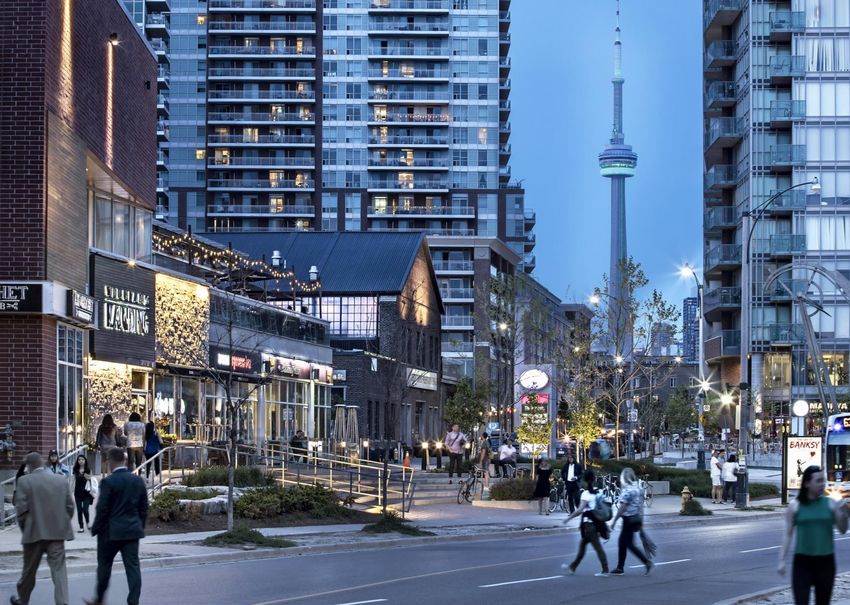
SUPER URBAN NEIGHBOURHOODS

                                                                                                                                               300,000
                                                                                                                              +20%
• Q1 2020 5km population of 293,000
  people                                                                                                                             293,000

   • Up 86,000 or 40% from December
      2016
   • Making us a leader amongst our                                                             +20%
                                                                                                             250,000
      North American peer group*

• Targeting 300,000 people by 2021                                                    207,000

                                                                                         Q4                     Q4                     Q1
                                                                                        2016                   2018                   2020       2021

                                                                                                                       5 KM Population
*North American Peer group includes: Riocan, SmartCentres, Choice Properties, Federal, and Regency Centres
                                                                                                                                               First Capital   8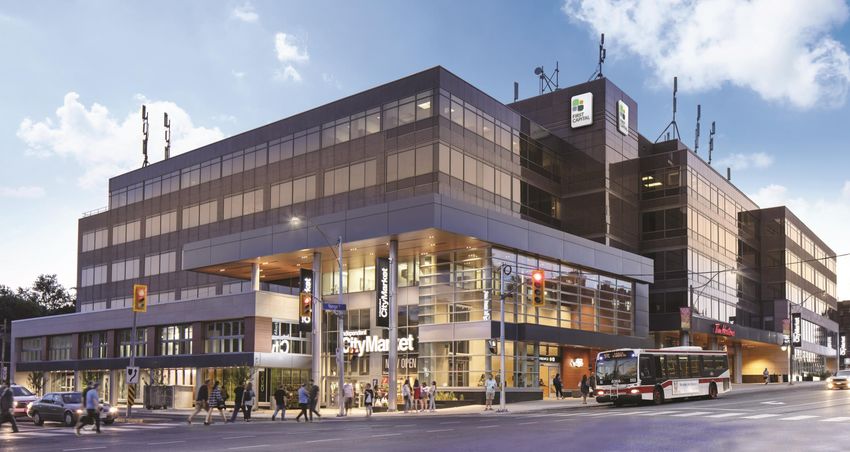
Canada's
Super Urban
  Portfolio
       First Capital   9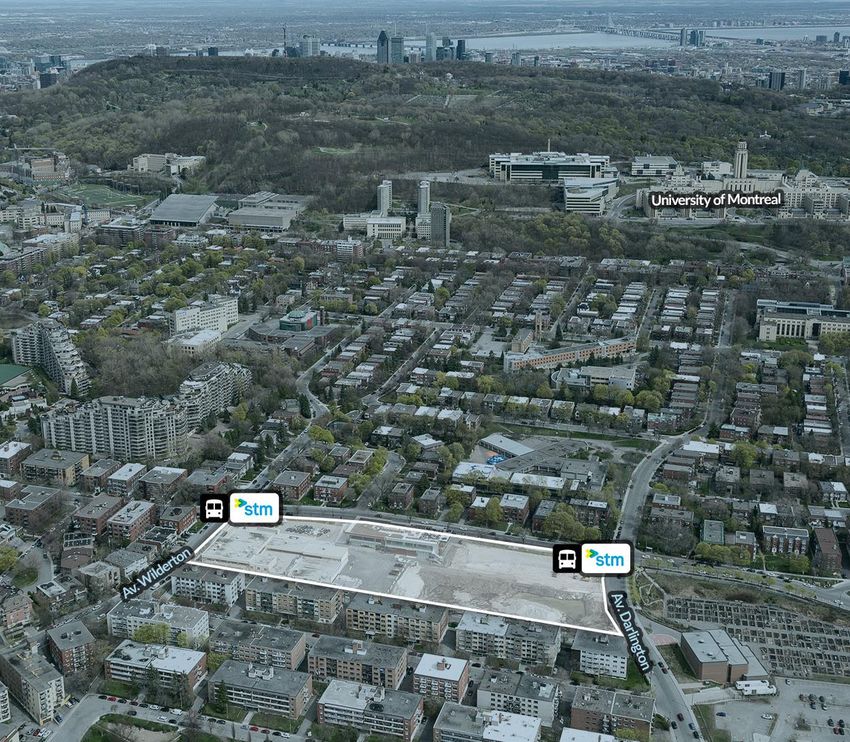
SUPER URBAN NEIGHBOURHOODS IN CANADA’S LARGEST CITIES
                             Vancouver, Calgary,
Western Canada                                            Central Canada                            Toronto    Eastern Canada           Montreal, Ottawa
                                     Edmonton

Properties                                      44        Properties                                      65   Properties                                42

GLA                                           6.8m        GLA                                         8.9m     GLA                                      5.0m

Fair Value %                                  31%         Fair Value %                                 53%     Fair Value %                             16%

                                     Edmonton        8%

                                    Calgary    12%

                 Vancouver    11%
                                                                             SW Ontario     3%

                                                                                                     47%
                                                                                                                      12%    Montreal
                                                                                          Toronto
                                                                                                               4%
                                                                                                                    Ottawa
                                                                           Kitchener/Waterloo/Guelph 3%

                                                                                                                                        First Capital     10
NORTH AMERICAN LEADER IN POPULATION DENSITY
FCR Portfolio Demographic Metrics vs. its Peer Group: Q1 2020 *
$120,000 US $125,000
293,000
$108,000
154,000
138,000
US Peers **
FCR Q1 **US Peers ***CDN Peers FCR Q1 **US Peers ***CDN Peers
2020 2020
5 KM Population 5 KM Average Household Income
As of March 31, 2020
* Source: Sitewise, Environics Analytics (2019 estimates)
** US Peers include: Federal Realty and Regency Centers – Source: Company Reports
*** Canadian Peers include: Riocan, SmartCentres, Choice Properties (Retail only)
Property portfolio based on 2019 AIF, Source: Company Reports, Sitewise, Environics Analytics First Capital 11STRONG GROWTH IN NAV PER SHARE 2015
+5.2% $22.59
$23.39
$22.65
CAGR since Dec 31, 2015
$21.85
$19.53
$18.25
2015 2016 2017 2018 2019 Q1 2020
First Capital 12CONSISTENTLY HIGH PERFORMANCE
Total Same Property NOI Growth
4.0%
3.5% 3.3%
2.9% 3.0%
10 Year Average 2.5%
2.0%
1.5%
1.0%
0.5%
0.0%
2010 2011 2012 2013 2014 2015 2016 2017 2018 2019
First Capital 13CONSISTENTLY HIGH PERFORMANCE
Lease Renewal Rate Increases
12.0%
10.7%*
9.3%
10.0%
10 Year Average 8.0%
6.0%
4.0%
2.0%
0.0%
2010 2011 2012 2013 2014 2015 2016 2017 2018 2019
Represents increase on total portfolio basis. Includes all renewals and contractual fixed rate renewals.
* The Trust achieved a 18.0% lease renewal rate increase when comparing the net rental rate in the last year of the expiring term to the average net rental rate over the renewal term.
First Capital 14STRATEGIC AND DIVERSIFIED RETAIL TENANT MIX
# of Stores % of Rent
Grocery Stores 121 17.0%
Medical, Professional &
1,391 15.3%
Personal Services
Restaurants & Cafes 964 14.4%
Pharmacies 121 9.0%
Banks & Credit Unions 197 8.3%
Fitness Facilities 82 3.6%
Liquor Stores 93 3.3%
Daycare & Learning
105 1.5%
Centres
Other Necessity-Based
511 18.3%
Retailers
Other Tenants 540 9.3%
First Capital 15TOP 20 RETAIL TENANTS
Contribute 45% of annualized minimum rent (AMR)
Investment Investment
Rank # Tenant AMR
Grade
Rank # Tenant AMR
Grade
1. 10.2% * 11. 1.4%
2. 5.8% 12. 1.3%
3. 2.9% 13. 1.3%
4. 2.7% 14. 1.2%**
5. 2.5% 15. 1.1% -
6. 2.0% 16. 1.1%
7. 1.8% 17. 1.1%
8. 1.8% - 18. 1.0%*** -
9. 1.7% - 19. 1.0%
10. 1.7% 20. 1.0% -
* Includes Shoppers Drug Mart ** Includes Rexall, Rexall Pharma Plus and Remedy’s Rx
***Includes Tim Hortons, Burger King and Popeyes
First Capital 16PORTFOLIO QUALITY HAS NEVER BEEN HIGHER WITH $1.4B OF INVESTMENT ACTIVITY IN 2019
2019 5km Average 5km Average
$ Amount Population Household Income
Acquisitions $392M 535,000 $132,000
Development Spend $166M 389,000 $117,000
Investment Total $558M 484,000 $127,000
Dispositions $835M 138,000 $101,000
First Capital 17ENTITLEMENTS PROGRAM
• 2019 entitlement applications of 9.0m sf surpassed our goal of 7.5m sf
• Once approved, FCR expects to recognize a meaningful increase to the current IFRS value
• During 2020, FCR had planned to submit entitlement applications for 4.3m sf. Due to the uncertainty surrounding the COVID-19
pandemic, entitlement submissions and approvals are expected to be delayed in the short term
• Pre-2019 and 2019 entitlement applications totaled 12m sf, representing close to 50% of FCR’s 25.0m sf of density pipeline
sf in ‘000s Residential Commercial Total Incremental
Pre-2019 Entitlement Applications 3,000 700 3,700 3,500
2019 Entitlement Applications 8,000 1,000 9,000 8,500
Total Entitlement Applications 11,000 1,700 12,700 12,000
First Capital 18SIGNIFICANT FUTURE DENSITY PIPELINE
Density Pipeline = 25.0m sf
• 7.1m sf (28%) in IFRS NAV
• 0.6m sf in active development,
6.5m sf at $510m or $78 per sf
9.0m sf of entitlement submissions
in 2019 Yonge & Roselawn Toronto, ON Christie Cookie Site Toronto, ON
1071 King St West Toronto, ON Leslie & York Mills Toronto, ON
First Capital 19Master Planned Super Urban Neighbourhood
Future Mixed-Use
Neighbourhood
Former Christie Cookie Site, Toronto, ON
28 ACRES
Demographics
5KM AVG
2019 Estimates
Population 269,200
Average Household Income $113,800
First Capital 20Master Planned Super Urban Neighbourhood
Future Mixed-
Use Neighbourhood
Former Christie Cookie Site, Toronto, ON
Planned Gross Leasable Area (at 100%)
Residential GLA ( ~7,500 Units) 6,000,000 sf
Retail GLA 500,000 sf
Office GLA 500,000 sf
Total GLA 7,000,000 sf
First Capital ownership 50%
25% of Site Open Space
First Capital 21Super Urban
Neighbourhoods
22Super Urban Neighbourhood
Bloor-Yorkville
Toronto, ON
Property Statistics
5KM AVG
2019 Estimates
Population 741,100
Average Household Income $132,000
Gross Leasable Area
Yorkville Village 315,000 sf
One Bloor East 85,000 sf
Hazelton Hotel (FCR share) 40,000 sf
Total Bloor/Yorkville 440,000 sf
Future Density 135,000 sf
First Capital 23SUPER URBAN NEIGHBOURHOOD - BLOOR-YORKVILLE
Recently Completed Re-Development - Yorkville Village Mall, Toronto
Avenue Road Newly Constructed Yorkville Entrance
Interior Events Program
First Capital 24Super Urban Neighbourhood
Bloor-Yorkville
Yonge and Bloor, Toronto, ON
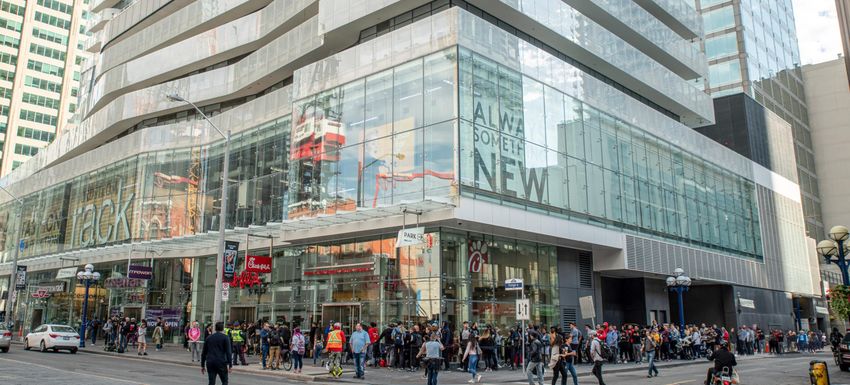
First Capital 25Super Urban Neighbourhood
Bloor-Yorkville
One Bloor East, Toronto, ON
Property Statistics
Retail GLA 85,000 sf
Commercial Parking 52 Stalls
Key Tenants
Direct Access to the Bloor-Yonge subway, the busiest
station in Canada serving >400k people per day
First Capital 26Super Urban Neighbourhood
Bloor-Yorkville One Bloor East: McEwan 2019 Opening
First Capital 27Super Urban Neighbourhood
Bloor-Yorkville One Bloor East: Chick-fil-A Canadian Flagship 2019 Opening
First Capital 28SUPER URBAN NEIGHBOURHOOD - BLOOR-YORKVILLE
Recent Acquisition:140 Yorkville Avenue, Mixed-Use Development
C
B
A
Bloor-Yorkville A 140 Yorkville Avenue
B Yorkville Village Mall C Hazelton Hotel
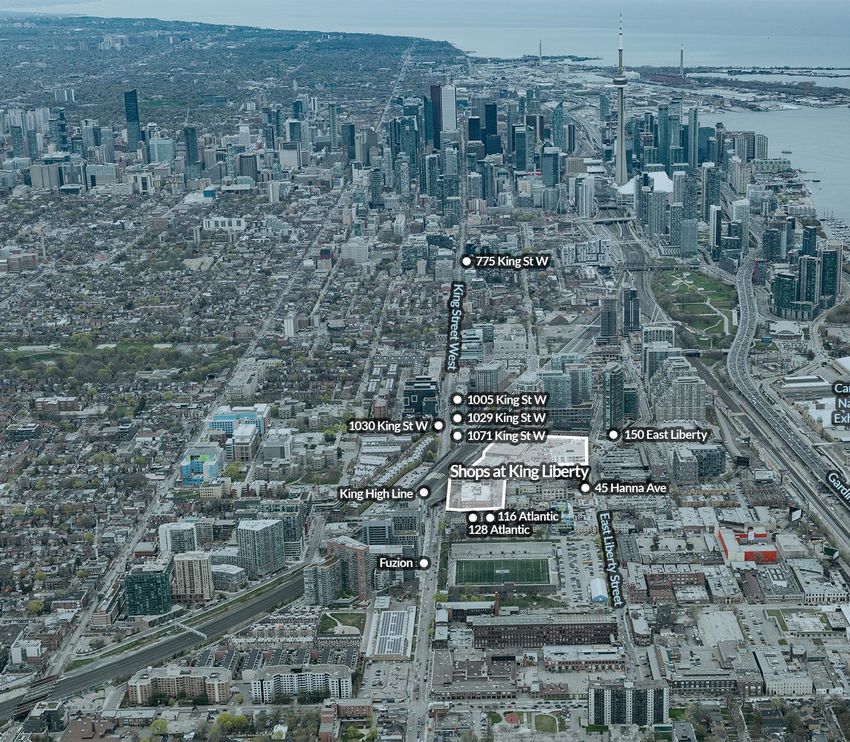
First Capital 29Super Urban Neighbourhood
Liberty Village Assets
Toronto, ON
Demographics
5KM AVG
2019 Estimates
Population 546,500
Average Household Income $110,900
Acreage 14.1
Retail GLA 396,000 sf
Residential GLA 328,000 sf
Office GLA 103,000 sf
Total GLA 827,000 sf
First Capital 30Super Urban Neighbourhood
Griffintown
Montreal, QC
Demographics
5KM AVG
2019 Estimates
Population 411,000
Average Household Income $96,000
Acreage 3.2
Retail GLA 254,000 sf
First Capital 31Super Urban Neighbourhood
Griffintown
Montreal, QC
Key Tenants
First Capital 32Calgary's Premier Super Urban Neighbourhood
Mount Royal Village
Calgary, AB
Demographics
5KM AVG
2019 Estimates
Population 231,300
Average Household Income $147,000
Acreage 4.1 .
GLA 380,000 sf
First Capital 33Before
Current
Calgary's Premier Super Urban Neighbourhood
Mount Royal Village
Calgary, AB
Redevelopment Phase Completed
Gross Leasable Area 118,000 sf
First Capital 34Current
Calgary's Premier Super Urban Neighbourhood
Mount Royal Village
Calgary, AB
Gross Leasable Area 98,300 sf
Key Tenants
First Capital 35Active Developments
DEVELOPING IN SUPER URBAN NEIGHBOURHOODS

Total Development Pipeline: 25m sf = 2m sf Commercial + 23m sf Residential

    King High Line                 Toronto, ON      3080 Yonge Street         Toronto, ON     Dundas & Aukland        Toronto, ON

                        Leaside Village Expansion        Toronto, ON    Centre Commercial Wilderton    Montreal, QC

                                                                                                                        First Capital   37
Super Urban Neighbourhood
Liberty Village Assets
King High Line Phase, Toronto, ON
Property Statistics
Acreage 2.8
Residential Units 506
Retail GLA 156,000 sf
100% Commercial
FCR Ownership
67% Residential
Commercial Tenants
First Capital 38Super Urban Neighbourhood
King High Line Toronto, ON
First Capital 39Ground-Up Development
Dundas & Aukland
Toronto, ON
First Capital 40Future
Ground-Up Development
Dundas & Aukland
Toronto, ON
Demographics
5KM AVG
(2019 Estimates)
Population 271,800
Average Household Income $133,200
Gross Leasable Area (at 100%)
Retail GLA 43,000 sf
Residential GLA 267,000 sf
Total GLA 310,000 sf
FCR Interest 71%
First Capital 41Super Urban Neighbourhood
Centre
Commercial Wilderton
Montreal, QC
Re-development Commenced
Demographics
5KM AVG
2019 Estimates
Population 635,500
Average Household Income $90,700
First Capital 42Super Urban Neighbourhood
Centre
Commercial Wilderton
Montreal, QC
Re-development Commenced
Under Construction
Property Statistics
Acreage 5 acres
Pre-redevelopment GLA 112,000 sf
Post Redevelopment GLA
Retail GLA 130,000 sf
Residential GLA 500,000 sf
Total GLA 630,000 sf
Key Tenants
First Capital 43Super Urban Neighbourhood Before
3080 Yonge St
Toronto, ON
Fully Integrated with Lawrence Subway Station
Demographics
5KM AVG
2019 Estimates
Population 406,400
Average Household Income $190,200
Current
Total Acreage 2.0
Retail GLA 49,000 sf
Office GLA 169,000 sf
Total GLA 218,000 sf
Key Tenants
First Capital 44Active Development
19 & 25 Industrial Street
Toronto, ON
Demographics
5KM AVG
(2019 Estimates)
Population 478,000
Average Household Income $170,000
Gross Leasable Area (at 100%)
Retail GLA 44,000 sf
Office GLA 28,000 sf
Total 72,000 sf
Construction Commenced October 2019
First Capital 45Future
Development
Significant Density Pipeline
First Capital 46SHORT-MEDIUM TERM DEVELOPMENT READY
Phase 2
Humbertown Phase 1 Residential Toronto, ON Wilderton Phase 2 Residential Montreal, QC
Yonge & Roselawn Toronto, ON 1071 King (Liberty Village) Toronto, ON
First Capital 47SHORT-MEDIUM TERM DEVELOPMENT READY
140 Yorkville Toronto, ON 400 King Street West Toronto, ON
101 Yorkville Toronto, ON
First Capital 48Future Development
Humbertown
Shopping Centre
Toronto, ON
Demographics
5KM AVG
(2019 Estimates)
Population 346,500
Average Household Income $122,700
Size 9.0 acres
First Capital 49Future
Future Development
Edenbridge Kingsway
Humbertown, Toronto, ON
Size 1.8 acres (Block 5 Phase 1)
252,000 sf
Future Density
(Retail: 7,000 sf; Residential 245,000 sf)
Partner (50% on Block 5) Residential
Expected Phase I
2021
Construction Start
First Capital 50Future
Super Urban Neighbourhood
Planned
Mixed-Use Project
Yonge & Roselawn, Toronto, ON
Residential GLA (687 Units) 533,000 sf
Retail GLA 65,000 sf
Total GLA 598,000 sf
First Capital 51Current
Future Mixed-Use Project
Yonge & Roselawn
Toronto, ON
Demographics
5KM AVG
2019 Estimates
Population 480,000
Average Household Income $188,400
First Capital 52Future
Future Mixed-Use Project
Yonge & Roselawn
Toronto, ON
Residential GLA (687 Units) 533,000 sf
Retail GLA 65,000 sf
Total GLA 598,000 sf
First Capital 53Future
Future Development
1071 King Street West
Toronto, ON
Demographics
5KM AVG
2019 Estimates
Population 540,000
Average Household Income $111,000
Gross Leasable Area (at 100%)
Residential GLA 198,000 sf
Retail GLA 5,000 sf
Total GLA 203,000 sf
Ownership Interest 67%
Construction Start 2021
First Capital 54Existing
Future Development
400 King Street West
Toronto, ON
Demographics
5KM AVG
2019 Estimates
Population 560,000
Average Household Income $123,000
First Capital 55Future
Future Development
400 King Street West
Toronto, ON
Gross Leasable Area (at 100%)
Residential GLA 415,000 sf
Retail GLA 38,000 sf
Total GLA 453,000 sf
Ownership Interest 35%
Construction Start 2021
First Capital 56Environmental, Social
and Governance (ESG)
57ESG INITIATIVES
175 119
Properties certified Recognized as Greater LEED-certified projects
76% of portfolio in GLA Toronto’s top employers 3.7m sf
160 AAA
Electric car charging Honouree in the Highest rating possible
stations installed Globe & Mail’s inaugural
“2020 Women Lead Here” list
First Capital 58ESG INITIATIVES
13% decrease in Greenhouse Gas (GHG) emissions from 2014-
2018, despite 8% growth in GLA.
35 26
Millions
Thousands
2019 information will be available in June 2020
30 25
25 25
Emissions (tC02e)
20 24
GLA (ft2)
15 24
10 23
5 23
- 22
2014 2015 2016 2017 2018
GHG Emissions (tCO2e) Reporting GLA (ft2)
First Capital 59ENHANCING SUPER URBAN NEIGHBOURHOODS THROUGH PUBLIC ART
27 Public Art Installations across our portfolio
Supporting Public Art Competitions in partnership with
First Capital 60CANADA’S MOST GENDER
DIVERSE COMPANY
EXECUTIVE BOARD
MEMBERS MEMBERS
62% Women 38% Men 22% Women 78% Men
Honouree in the Globe and Mail’s inaugural MANAGEMENT TOTAL
“2020 Women Lead Here” list ROLES EMPLOYEES
Strong gender diversity metrics achieved through all levels of the
organization; over 50% of management positions are held by
females including the executive leadership team
53% Women 47% Men 61% Women 39% Men
First Capital 61Financial Strength
and Flexibility
Super Urban
NeighbourhoodsCAPITAL STRUCTURE
Enterprise Value $8.0b
19%
Mortgages and Secured Facilities: $1.5b
Unsecured Debentures: $2.5b
Unsecured Term Loans: $0.8b
44%
Unsecured Revolving Facilities:
$0.3b
($800m total capacity)
Total Unsecured $3.6b
37%
Trust & Exchangeable Units:
$3.0b (219.0m units)
As of March 31, 2020
First Capital 63FINANCIAL STRENGTH AND FLEXIBILITY
As at Q1 2020 2019 2018 2017 2016
Unsecured revolving credit facilities
$800 $800 $800 $800 $800
(million)
71% Unencumbered assets (billion) $7.2 $7.0 $7.3 $7.4 $6.6
Unencumbered assets to unsecured
of Q1 2020 assets debt
2.1x 2.2x 2.5x 2.4x 2.4x
Secured debt as % of total assets 14.3% 14.5% 14.0% 12.7% 12.7%
Net debt to total assets 47.2% 46.7% 42.1% 43.4% 44.9%
Net debt to EBITDA 10.3x 10.0x 9.6x 9.9x 9.6x
EBITDA interest coverage 2.3x 2.4x 2.5x 2.5x 2.5x
First Capital 64WELL-STAGGERED TERM $800 6.0%
DEBT MATURITIES Unsecured Term Loans
Millions
Mortgages
Weighted Average Interest Rate 3.9% $700 Senior Unsecured Debentures
Weighted Average Effective Interest % 5.0%
Term to Maturity 5.0 years
$600
95% of Term Debt is Fixed Rate
4.0%
$500
$400 3.0%
$300
2.0%
$200
1.0%
$100
$- 0.0%
2015 2016 2017 2018 2019
As of April 27, 2020 2020 2021 2022 2023 2024 2025 2026 2027 2028 2029 2030 2031
*
% Due 1.1% 5.9% 13.1% 12.0% 16.9% 10.3% 14.4% 13.9% 3.5% 5.7% 1.9% 1.3%
* Not including principal amortization
First Capital 65HISTORICAL PERFORMANCE
$350 84%
82%
$302 82%
$300 $287
$284
$261 80%
$250 $236 78%
78% 76%
$200
74%
$150 74%
72%
$100 70%
71%
70% 68%
$50
66%
$0 64%
2015 2016 2017 2018 2019
FFO excl OGLE/share $1.05 $1.10 $1.16 $1.21 $1.24
Cash Dividends per share $0.86 $0.86 $0.86 $0.86 $0.86
ACFO less Dividend $25m* $32m 2015 $34m2016 2017
$55m 2018$49m 2019
*Annual retained operating cash
First Capital 66OUTLOOK
Canada’s Super Urban Portfolio COVID-19 Preparedness
• Investing in high-quality, mixed-use properties with • Unprecedent closure of the world economy has presented
the focus on building large positions in targeted high challenges, FCR will continue to be guided by its corporate
growth super urban neighbourhoods responsibility and sustainability program and values
• Completing strategic dispositions to reduce leverage • FCR supports our neighbours through various initiatives,
post the April 2019 share repurchase transaction and including providing meals to frontline workers in partnership
to fund investment program with its independent food tenants
• Our tenant mix has always been focused on essential
tenants/services, including Grocers (17% of rent), Pharmacies
(9%), Banks (8%), and Liquor stores (3%)
First Capital 67Adam Paul
President & CEO
Kay Brekken
Executive VP & CFO
First Capital
Shops at King Liberty
85 Hanna Ave, Suite 400
Toronto, ON
Tel: 416-504-4114
fcr.ca
TSX: FCR.UN
68You can also read


