THE Thought leadership and insights from Frontier Advisors - Issue 147 - Thought leadership and insights from Frontier ...
←
→
Page content transcription
If your browser does not render page correctly, please read the page content below

THE

Thought leadership and insights from Frontier Advisors
                                       Issue 147   May 2019
David joined Frontier in 2015 and leads the
Members Solutions Group. He provides investment
advice to a range of clients and conducts
research in the area of retirement strategy and
product development for superannuation funds.
Prior to Frontier David spent nineteen years at
Mercer in Prior to joining Mercer, David was at
Towers Perrin for around six years, working with a
number of clients in an investment advisory and
research capacity. David holds a Bachelor of
Economics from Macquarie University and is a
Fellow of the Institute of Actuaries.

Compared to most other countries, the Australian                                       If, as it seems inevitable, further consolidation will occur,
superannuation marketplace is highly competitive.                                      which funds will be in APRA’s crosshairs? A few suggestions
                                                                                       have been put forward by a range of groups within the
There are less than 200 superannuation funds in Australia1
                                                                                       industry:
(in addition, there are almost 600,000 SMSFs). In comparison,
the US has nearly 555,000 employer sponsored retirement                                •        The current “scale test” which is aimed at the smallest
plans2 and the UK has over 5,600 pension schemes3. At the                                       funds.
other end of the scale, countries such as Singapore and
                                                                                       •        The most expensive funds should exit the industry.
Sweden have a state scheme which covers the majority of
employees.                                                                             •        Employees should be defaulted into up to ten “best in
                                                                                                show” funds.
Over the ten years to June 2018, the number of APRA-
regulated funds decreased from 466, a drop of around 60%.                              •        Entrenched underperforming funds should be forced
This consolidation has come with the explicit backing of APRA,                                  to merge.
which proclaimed as early as 2015 that “APRA’s focus in the
coming months will remain on ensuring that all trustees are                            •        A member outcomes test should sort the wheat from
proactively considering their future strategy and putting in                                    the chaff.
place concrete plans to address the issues ahead. In some                              While each of these approaches looks superficially appealing,
cases, this may mean planning for (a hopefully graceful) exit                          in practice there are a number of considerations which need
from the industry.”4                                                                   to be understood. Indeed, there should be some evidence
The push for further consolidation came loudly from the                                that any approach chosen will increase member outcomes
Productivity Commission report, which noted that its                                   and not simply reduce the number of funds.
proposed approach would “accelerate desirable industry
consolidation”5.
“We have (conservatively) estimated that cost savings of at
least $1.8 billion a year could be realised if the 50 highest-cost
funds merged with 10 of the lowest-cost funds”.6

1
APRA Annual Superannuation Bulletin, June 2018
2
Investment Company Institute, September 2018
3
Pension Protection Fund, 2017-8
4
https://www.apra.gov.au/media-centre/speeches/super-system-apras-watch-list
5
Superannuation: Assessing Efficiency and Competitiveness – Productivity Commission, December 2018
6
ibid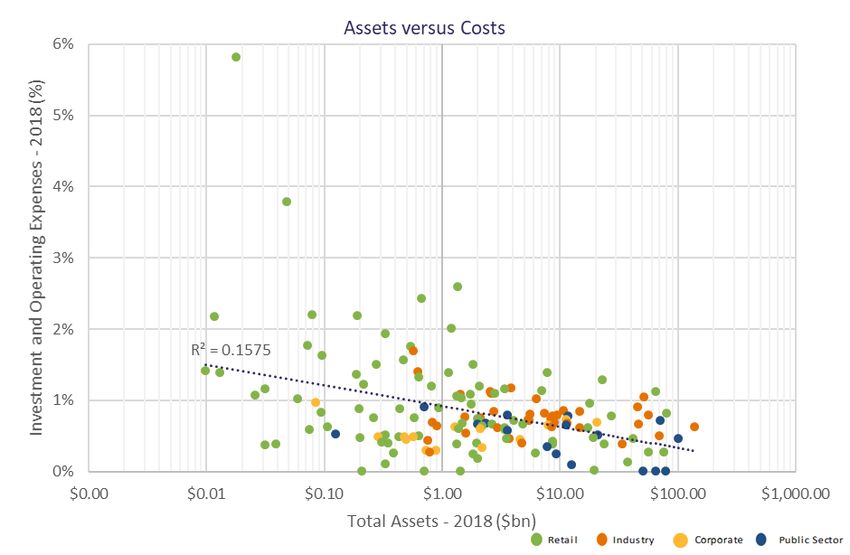
Since 2013, trustees have been required to determine each         The analysis currently shows a clear relationship between the
year whether their MySuper product has access to sufficient       size of a fund and its three year return. Smaller funds have
scale, with respect to both assets and number of members.         returned less than larger funds – funds with less than $1bn in
This requirement seeks to ensure that members of a                assets returned 1% p.a. less on average than funds with more
particular MySuper product are not disadvantaged in               than $1bn.
comparison to members of other MySuper products. 7
                                                                  However, not all smaller funds have underperformed, with
The obvious concern is that smaller funds will not have the       two funds with about $1bn achieving amongst the highest
scale and resources to efficiently provide services to their      returns over the past three years. Additionally, retail super
members; i.e. they will be more expensive than larger funds       funds dominate in the underperforming, smaller fund cohort,
and/or they will provide inferior returns/services.               suggesting more factors than size are driving this
                                                                  performance differential.
To test whether smaller funds have produced inferior
investment returns, Chart 1 plots the relationship between        In the next section we investigate whether this lower return
the assets of each MySuper fund and its net return.               for smaller funds is due to higher costs, or other reasons.

                  Source: SuperRatings, APRA, Frontier Advisors

7
Section 29VN(b) of the SIS Act
One of the reasons larger funds may have achieved higher Whilst the majority of the high cost funds are small, there
returns is because they have lower costs. Whilst not are six funds which have more than $5 billion in assets and
specifically recommended by the Productivity Commission cost ratios greater than 1%.
(PC), there is intuitive appeal in concentrating on the most
This includes Rest, Asgard and BT Funds, which all have
expensive funds to make the superannuation industry more
more than $20 billion in assets – given their size it is difficult
efficient.
for these funds to merge with a larger fund to realise scale
Indeed, if the PC had followed this line of thinking, then the benefits.
obvious recommendation would have dealt with SMSFs.
Retail funds make up the majority of highest cost funds,
As the PC report noted, smaller SMSFs (with less than
accounting for 30 of the 44 high cost funds. This includes
$500,000 in assets) “perform significantly worse on average.
seven Eligible Rollover and Approved Deposit Funds, whose
This is mainly due to the materially higher average costs they
existence is challenged under the Protecting Your Super
incur (relative to assets) due to being small.”8
changes. It also includes a number of the new ‘millennial-
focused’ funds.
Leaving aside SMSFs, there are 44 superannuation funds with Industry funds only account for eight higher cost funds,
expenses (investment, administration and operating) greater and this includes three funds which have announced merger
than 1% of the scheme assets, based on 2018 APRA data. proposals.
Chart 1 highlights that smaller funds are in general more Interestingly, there are five funds which report no
expensive than larger funds, indicating that there are some administration, operating or investment expenses – including
scale benefits. the CSS and PSS funds.
Source: Frontier Advisors, APRA Annual Superannuation Bulletin Statistics – 2018
8
Superannuation: Assessing Efficiency and Competitiveness – Productivity Commission, December 2018A slightly different picture arises when analysing the fees Of course, members will have higher and lower balances than
charged to members of MySuper funds. For a start, not all $50,000 and this will affect the fee they are charged. Industry
funds analysed in the previous section offer a MySuper funds often charge a flat dollar amount (typically $78) for
product. In addition, we compare the fee charged for a administration—this will result in a higher percentage fee for
member with a balance of $50,000 (in line with the APRA low balance members and a lower percentage fee for higher
reporting requirement). balance members. Conversely, retail funds usually charge a
percentage fee for all members, which can appear relatively
Based on the 95 MySuper funds at December 2018, the
cheaper for low balance members and higher for high
average fee charged was $560 per annum – representing a
balance members.
fee of 1.12%. Indeed, only 23 funds offer a MySuper fund
with a fee of less than 1% for a member with a balance of One way a fund can keep its costs lower is to avoid investing
$50,000 – curiously this includes Rest, one of the highest cost in higher cost asset classes, such as property and
funds. infrastructure and/or invest passively. While not replicated
Ultimately, members shouldn’t be concerned if they are in a here, Frontier’s prior research into fees showed that
investment fees have a weak positive correlation to net of fee
high fee fund, if the investment return after those fees more
return outcomes—suggesting that too great a focus on fees
than compensates for the higher costs. It is the net returns
can be to the detriment of investment outcomes.
that members should be comparing, rather than just the fees.
Interestingly, Chart 3 highlights there is no discernible In the next section, we analyse investment performance in
relationship between the fee it charged for a MySuper more detail.
product and the return it achieved after fees over the last
three years. If fees were a key determinant of member
outcomes, it would be expected that lower fee funds would
have achieved higher returns after fees.
Source: Frontier Advisors, APRA Quarterly MySuper Statistics—December 2018The investment returns a fund achieves will be the primary The difference between a “good” fund (as characterised by a
influence on a member’s retirement benefit. Chart 4 fund with upper quartile performance) and a “bad” fund
highlights that there is a significant difference between the (with lower quartile performance) typically averages around
best performing fund and the worst in any year. 2% p.a. If a fund was consistently in the upper quartile, this
would result in significantly higher retirement benefits for
In most years, the difference between the best and worst
that fund’s members.
funds ranges between 6-7% pa. However, the GFC saw a 35%
difference.
Source: Frontier Advisors, SuperRatings, Balanced (60-76) FundsAs Table 1 shows, four of the top funds to June 2018 were no
Whilst not available to consumers, it is relatively easy for
longer in the top ten just six months later.
industry professionals to identify the best performing funds
through surveys conducted by Chant West and SuperRatings. This turn-around reflects how funds can be affected by
Choose your end date, your period of analysis and your peer different market conditions. The three years to June 2018 was
group of funds and voilà. Choose a different end date, period generally characterised by good returns from equities and
or peer group and the results will be different, often other growth assets. During this period, funds with a higher
markedly. allocation to growth assets will have resulted in higher
returns. The most recent six months (with negative equity
For example, the Table 1 identifies the top ten performing
returns) will have seen funds with higher equity allocations
funds over the three years to June 2018, based on the
punished. A fund with a higher allocation to growth assets is
SuperRatings SR50 Balanced Funds9. It also includes the
not necessarily a “better” fund, just a higher risk fund.
ranking of those funds over the next six months and over the
three years to December 2018.
The results of a ‘best in show’ list based on performance over
three years to June 2018 would have been quite different if it
had been based on performance over three years to
December 2018.
Fund Rank: 3 Years to Rank: 6 months to Rank: 3 Years to
June 2018 Dec 2018 Dec 2018
HOSTPLUS - Balanced 1st 35th 1st
Cbus - Growth (MySuper) 2nd 15th 3rd
AustralianSuper - MySuper Balanced 3rd 28th 5th
Catholic Super - Balanced (MySuper) 4th 36th 11th
Mercy Super - MySuper Balanced 5th 4th 2nd
CareSuper - Balanced 6th 20th 9th
Club Plus Super - MySuper 7th 7th 4th
UniSuper Accum - MySuper Balanced 8th 33rd 19th
Sunsuper for Life - Balanced 9th 8th 6th
AustSafe Super - MySuper (Balanced) =10th n/a n/a
th th
MTAA Super - My AutoSuper =10 29 22nd
Source: Frontier Advisors, SuperRatings
9
The SuperRatings SR50 survey does not include every super fund as not all funds elect to be in the survey.
Some funds outside the survey, such as the First Super Balanced, have also performed well.We then tracked the performance of these funds over the
following five years to December 2018. If past performance
Identifying the underperforming funds over the last three was a good guide, it would be expected that above average
years is similarly easy. Whilst not naming the individual funds funds in the first period would remain above average in the
(lest this result in an unjustified run on these funds), eight of second period.
the worst performing funds over the three years to 30 June
2018 were retail funds. The two remaining funds were Table 2 shows that if you chose an above average fund in the
corporate funds. first five years, you had a 50% chance that this fund would be
above average in the second period (i.e. no better than a toss
Looking at the performance of these ten funds over the last of a coin). Almost a third of the above average performers
six months highlights a different picture to the top performing become below average performers, and the remaining 20%
funds. Eight of the worst performing funds over the three were no longer in existence (typically having merged with
year period to June 2018 were also in the bottom ten funds another fund).
over the subsequent six months (interestingly the two
corporate funds jumped into the top 10 in this period). In contrast, if you chose a below average fund based on five
year returns to 2013, 37% of these funds turned their
performance around and become good performers. Similar to
the above average funds, 30% were below average in the
ASIC warns that “it may be misleading to imply that reliance
second period (i.e. poor in both periods) and one-third no
on simple past performance figures would be a good way to
longer existed.
select a financial product or service.”10
Choosing a new fund (i.e. one which didn’t have a five year
To highlight that past performance is not necessarily a guide
track record to 2013) would not have been a good strategy –
to the future, we analysed the outcome of choosing the best
63% of these funds underperformed.
performing funds over the five years to December 2013.
Five Years to December 2018
Above average Below average Exited Total
Above Average 50% 30% 20% 100%
Below Average 37% 30% 33% 100%
New fund 37% 63% - 100%
Source: Frontier Advisors, SuperRatings
10
ASIC RG53, The use of past performance in promotional material, July 2003Another way to analyse performance persistence is to calculate the number of individual years a fund outperforms the
average. Chart 5 below uses data over the last 13 calendar years since 2006, including only those funds which have at least ten
years of history.
Two funds have outperformed in 12 of the 13 years and a further five in all but two years – remarkably consistent
performance. At the other end of the scale, two funds underperformed in 12 of the 13 years and a further five in all but two
years – remarkably persistent underperformance.
Industry funds make up 18 of the top 20 funds based on this measure. In contrast, retail funds account for 17 of the bottom 20
funds.
Above Average Below Average
Source: Frontier Advisors, SuperRatings
Fund
Industry Retail Corporate Public SectorA question to consider is whether the top performing funds Standard Risk Measure – the expected number of negative
are “better” than other funds, or merely higher risk. returns in 20 years is another measure of investment risk.
Similarly, are the worst performing funds just taking less risk
and therefore underperforming in bull markets? Risk can be defined in other ways as well, with the ultimate
risk for members being that their superannuation is not
There is no single definitive measure of risk – the level of risk adequate for their retirement or that the fund is unable to
the funds took to achieve their returns can be calculated in pay benefits (for example due to liquidity issues).
various ways:
Charts 6, 7 and 8 highlight the degree to which each of these
Growth ratio – as growth assets are typically more risky than measures of risk have affected funds’ returns over the last
defensive assets, a fund with a higher growth ratio can be three years.
more risky, although this volatility may not show up in any
particular year. Given funds self-report their growth They also show a mixed view on the effect of risk on
allocation, this measure is open to some interpretation. performance, but in all cases the relationship has been weak
across the universe of funds. As much as anything,
Standard Deviation – calculating the volatility of returns over this reflects the difficulty in measuring investment risk.
the year provides one measure of risk, although measuring Investment risk measures are subject to calculation
over longer periods will provide a better measure. differences between fund, measurement difficulties and
Depending on the period, this measure can understate only provide one perspective on investment risk taking.
the risk taken by funds with higher allocations to unlisted
investments as a result of valuation timeframes.
Source: Frontier Advisors, SuperRatingsSource: Frontier Advisors, SuperRatings Source: Frontier Advisors, SuperRatings, APRA
APRA has recognised that scale is not the only factor that        In addition, APRA expects that forward-looking metrics will be
should be considered in assessing the quality and value of        a key component of the assessment, including:
MySuper products. Any assessment of value for members
needs to take a broader view that encompasses not just            •      Net cash flows as a percentage of average net assets
investment performance and fees, but also the nature and                 (net cash flow ratio).
quality of the benefits and services being provided and the       •      Net member benefit outflow ratio.
adequacy of the fund’s governance and risk management
frameworks and practices.                                         •      Net rollovers as a percentage of average net assets
                                                                         (net rollover ratio).
APRA notes that for many members, investment performance
will be central to the assessment of outcomes achieved.           •      Trends in membership base (such as number of
However, in APRA’s view, relying solely on net returns as a              members and accounts, and account balance size).
measure of outcomes, whether on a relative or absolute
basis, is not sufficient.                                         •      Active member ratio.

Additionally, achieving reduced fees or costs may be an           APRA expects the assessment to be measured versus internal
appropriate objective. However, seeking to provide the            benchmarks and targets and additionally against external
lowest relative fees and costs may not necessarily provide        benchmarks (e.g. against other MySuper products in the
better outcomes for members over the long-term.                   market). The following charts show examples of the types of
                                                                  analysis that APRA is expecting.
In August 2018 APRA wrote to trustees outlining their
proposed methodology for assessing member outcomes and            APRA expects the outcomes assessment will have an integral
fund sustainability. After industry consultation, APRA released   role in informing each fund’s strategic objectives and business
SPS 515 – Strategic Planning and Member Outcomes and SPG          plan. The assessment, as part of the annual review of the
516 – Outcomes Assessment, which will come into effect            business plan, will provide a detailed understanding of
from January 2020.                                                whether a fund’s business operations are delivering the
                                                                  outcomes it has sought for its members and is an important
SPG 516 outlines the metrics trustees need to consider to         tool to identify areas for improvement.
determine their outcomes assessment:
                                                                  Where the outcomes assessment demonstrates a consistent
•      Net investment returns, on an absolute basis, as well      pattern of underperformance in either absolute or relative
       as relative to relevant benchmarks and risk/return         terms, APRA expects the fund to actively consider whether
       targets over different time periods (e.g. one year, 3      continuing to operate in its current form is consistent with
       years, 5 years and 10 years).                              the fund’s obligation to act in the best interests of members.
                                                                  Such funds should consider a merger or wind-up.
•      Fee levels, including costs per member.

•      Administration and operating expenses as a
       percentage of average net assets (operating cost
       ratio).

•      Level and cost of insurance cover (by type of
       insurance), including measures of account erosion
       such as the premium as a percentage of salary or
       superannuation guarantee contribution.
Source: Frontier Advisors, APRA Source: Frontier Advisors, APRA
Source: Frontier Advisors, APRA

   Source: Frontier Advisors, APRA
It is inevitable there will be further consolidation of the      As we’ve highlighted, a robust assessment across a wider
superannuation sector. The confluence of the Productivity        range of factors is needed to be able to be satisfied that each
Commission, Banking Royal Commission and a greater               fund is of appropriate quality and providing good value for its
involvement by APRA will result in an increasing number of       members. This would include:
fund mergers.
                                                                 •      Investment performance measured across multiple
Frontier supports improved efficiencies in the superannuation           time periods, and consideration of the level and nature
system.                                                                 of investment risk.
Up until recently, merger discussions have been targeted at       •     Level of fees and costs, particularly where these are
smaller funds. We think it is important to note that while              increasing.
there are certain efficiencies of scale achieved by larger funds,
smaller funds have their own unique advantages and should         •     Size of assets and cashflow position, especially if the
not be discredited based purely on size.                                cashflow is negative.

We believe that a “best in show” approach as outlined by the     •      Fund governance, business management and trustee
Productivity Commission has the potential to introduce                  oversight.
unintended consequences, such as a heavily peer-focused
                                                                 •      Other factors such as member services and other
mindset, short-termism and diseconomies of scale.
                                                                        qualitative factors.
Frontier believes the focus should be on the “worst” funds.
                                                                  The focus should be on improved outcomes for members, not
However, identifying funds which will underperform in the
                                                                  just less funds for the sake of it.
future is no easier than selecting those which will out perform
in the future. The devil will be in the detail to ensure that any
test is not too prescriptive and easy to game.
You can also read