GDP Forecast of the Biggest GCC Economies Using ARIMA
←
→
Page content transcription
If your browser does not render page correctly, please read the page content below
Munich Personal RePEc Archive

GDP Forecast of the Biggest GCC
Economies Using ARIMA

Youssef, Jamile and Ishker, Nermeen and Fakhreddine, Nour

Beirut Arab University, Beirut Arab University, Beirut Arab
University

17 June 2021

Online at https://mpra.ub.uni-muenchen.de/108912/
MPRA Paper No. 108912, posted 30 Jul 2021 13:22 UTC
ABSTRACT

Gulf Cooperation Council (GCC) members are considered one of the fastest growing
economies. This paper aims to empirically forecast the economic activity of the vastest GCC
countries: Qatar, Saudi Arabia, and the United Arab Emirates. An Auto-Regressive Moving
Average (ARIMA) model for the three countries Gross Domestic Product is obtained using
the Box-Jenkins methodology during the 1980 - 2020 period. The appropriate models for the
three economies are of ARIMA (0,2,1), the forecasts are at a 95% confidence level and
predicts a growth in the three countries for the upcoming five years.

1. INTRODUCTION
Gulf Cooperation Council (GCC) is an economic and political agreement between six Arab
countries; Bahrain, Kuwait, Oman, Qatar, Saudi Arabia, and the United Arab Emirates. It was
established in 1981 (GCC, 2021). These countries differ in size and population but are
located close to one another in the Middle East. The countries acquire low debt, high foreign
reserve and are all rich in oil stocks. The GCC economy is the largest in the Middle East and
the fastest growing in the world. GCC is known to be the biggest oil producer and it has the
largest fuel and gas reserve. The cooperation economic development can be classified into
different eras. During the 1990s, the region witnessed a remarkable economic growth. The
increase in oil prices played a major rule in GCC development, despite the 1991 Gulf war.
Following that in the 2000s, the economy of the GCC members continued to boom, taking
advantage of the rise in oil price. The black gold industry remained a vital source of revenue
accompanied with an industrial and commercial development (Vohra, 2017; Ab Rahman and
Abu-Hussin, 2009). In 2003, Customs Union was officially established for the liberalization
of trade and flow of products with no tariff barriers between GCC countries (GCC, 2021).
Nevertheless, the fall in oil prices since 2008 demonstrated an adverse impact on the budget
and economic growth of the GCC countries (Vohra, 2017).

Forecasting future macroeconomic outcomes of GCC is vital to obtain a better insight of the
macroeconomic indicators and to anticipate economic activity. A standard statistic to forecast
and measure the economy size and activities, and to track cyclical changes is the Gross
Domestic Product (GDP) (Leamer and Leamer, 2009). GDP is the market value of the final

 1
goods and services produced within a specific country or area during a 12-months period. In
that regard, this study aims to obtain accurate forecasts for the GDP of the leading GCC
members for the period 2021 – 2025. The leading members are Qatar, Saudi Arabia (KSA),
and the United Arab Emirates (UAE). While there are different techniques to forecast time
series, this research relies on Auto-Regressive-Integrated-Moving-Average model, known as
ARIMA to anticipate GDP future values.

Numerous studies have been conducted on GDP forecast using ARIMA models and Box and
Jenkins methodology, but it remains the challenge of recent work. The significance of this
research is that it is not limited to the analysis of one specific country, rather a GDP
prediction of three leading GCC members. Furthermore, to the best of our knowledge, there
has not been any previous analysis aimed to forecast the overall economic activity of the
under-study countries; although several researches investigated various aspects of the GCC
economy.

The remaining of the paper is organized as follows. Section 2 describes a brief literature
review while Section 3 discusses and explains the data and methodology followed. In Section
4 the empirical results and forecasting are presented. Section 5 concludes.

2. LITERATURE REVIEW
There are numerous studies that forecast economic activity and growth using ARIMA model
and following Box and Jenkins method. The GDP is a macroeconomic measurement directly
linked to a country’s development. Hence, it is crucial to investigate past statistics and predict
future data (Ning et al., 2010). Overall previous studies can be classified into three groups.
The first includes the GDP growth rate forecast, while the second concentrate on GDP per
capita prediction. The third group contains the studies that investigate and forecast GDP
values.

Among the first group, Dinh (2020) implement an ARIMA model to forecast China and
Vietnam’s economic growth using credit GDP ratio of the 1996 - 2017 period. The best
obtained ARIMA fit models are ARIMA (2,3,5) and ARIMA (2,3,1) for China and Vietnam
respectively. Results indicate that China’s growth rate is faster than that of Vietnam. In
addition, Maity and Chatterjee (2012) examine India’s GDP growth anticipation, through

 2
analyzing 60 years period using ARIMA (1,2,2). Their results indicate a raise in the GDP rate
for the upcoming years. Within the same context Dritsaki (2015) utilize ARIMA (1,1,1)
model for real GDP rate arranged from 1980 to 2013. The author anticipates the GDP growth
of Greece following the Box- Jenkins technique. Results predict a growth for the years 2014,
2015 and 2016 at 1.56%, 2.85% and 3.12%.

On the other hand, Eissa (2020) derives forecast assumptions of GDP per capita while
applying ARIMA model for Egypt and Saudi Arabia, following the Box Jenkin methodology.
The models are ARIMA (1,1,2) and ARIMA (1,1,1) respectively and the result presents a
continuous rise in GDP per capita in both countries for the upcoming 10 years. Moreover,
Voumik and Smrity (2020) forecast in their study Bangladesh real per capita GDP for the
next decade using ARIMA (0,2,1) of a yearly series from 1972 till 2019. The study analysis a
growth in Bangladesh’s economy. Zhang and Rudholm (2013) consider Sweden GDP per
capita of the 1993 - 2009 period to predict future values. The authors employ three models
Auto Regressive Integrated Moving Average (ARIMA), Vector Autoregression (VAR) and
First Order Autoregressive (AR), and conclude that all three methods are adequate in short
run forecasting. Noting that ARIMA and AR performs better.

Within the last group, Abonazel and Abd-Elftah (2019) use annual GDP data of Egypt from
1956 till 2016, to forecast the country’s economic activity for 10 years ahead. ARIMA (1,2,1)
model based on Box- Jenkins approach is applied, and results indicate an increase trend from
2017 to 2026. Agrawal (2018) attempts to forecast the Indian economy using quarterly GDP
time series from 1996 to 2017. The research selects AR (1) and MA (2) specification and find
a long run prediction of the GDP series. Furthermore, Wabomba et al. (2016) examine the
GDP forecast of Kenya using ARIMA (2,2,2) model based on a time period of 1960 - 2012.
The study also follows Box-Jenkins method and predicts an anticipated development from
2013 till 2017, within a 95% confidence range. Likewise, Zakai (2014) follows the Box-
Jenkins approach while considering ARIMA (1,1,0) as the best fit to analyze Pakistan
forecast of annual GDP operating a time series from 1953 till 2012. An increase in Pakistan’s
GDP in the upcoming 13 years is predicted. On the other hand, Judi (2007) projected non-oil
GDP value of the United Arab Emirates employing an ARIMA model. The data spans 1970 -
2006 period. GDP was estimated to raise until the end of the year 2020. Many studies
adopted the ARIMA model to forecast economic activity. This paper uses annual GDP series

 3
to forecast the future economic outcomes of the three leading GCC countries based on the
ARIMA modeling and Box-Jenkins approach.

3. DATA
3.1. Data Selection
To forecast GDP for the next five years (2021 to 2025) of Qatar, Saudi Arabia, and the
United Arab Emirates, we use annual GDP (PPP, international dollars) variable. The data
span the 1980 - 2020 period, indicating 41 observations. The variable is derived from
International Monetary Fund Database. Furthermore, to simplify and compare the GDP
values, the three countries are log transformed.

3.2. Data Description
The visual analysis of GDP in Qatar, KSA and the UAE from 1980 till 2020 is presented in
Figure 1. The time series in the three countries show an exponential increase throughout the
mentioned period. Qatar GDP reached its maximum at 322.99 billion U.S. dollars in 2013
and declined gradually to reach 261.98 billion U.S. dollars in 2020. Whereas in KSA, GDP
extended to its maximum at 1,722.862 billion U.S. dollars in 2014 and decreased to
1,627.305 billion U.S. dollars in 2020. UAE GDP extended to its peak at 678.3 billion U.S.
dollars in 2014 and dropped by 11.7% in 2016, to raise subsequently to 650.829 billion U.S.
dollars in 2020.

Figure 1. Annual GDP of Qatar, KSA and the UAE (in billion U.S. dollars).

Source: International Monetary Fund Database.

 4
A summary statistic of the GDP variable used in our study in presented in Table 1. These
descriptive statistics include the minimum, median, mean, maximum, and the standard
deviation values. Table 1 suggests that Saudi Arabia has the highest GDP on average,
equivalent to 961.3 billion U.S. dollars. In addition, Saudi Arabia experiences the highest
dispersion with 479.873 points. GDP in Qatar ranges from 20.86 to 322.99 billion U.S.
dollars and that of the United Arab Emirates is between 90.06 to 683.52 billion U.S. dollars.

Table 1. Summary Statistics – GDP (in billion U.S. dollars).

 Qatar KSA UAE

Minimum 20.86 315.2 90.06
Median 57.40 821.3 308.18
Mean 114.38 951.3 351.37
Maximum 322.99 1,722.9 683.52
St. Deviation 106.384 479.873 216.206
Observations 41 41 41

4. METHODOLOGY
4.1. Autoregressive Integrated Moving Average (ARIMA) Models
Autoregressive Integrated Moving Average (ARIMA) model have become a popular model
after George Box and Gwilym Jenkins approach in the early 1970s. It is acknowledged as
univariate time series and presents a forecasting approach. The ARIMA model comprises of:
Autoregressive (AR), differencing, and Moving-Average (MA) processes.

4.1.1 Autoregressive Process (AR)
The autoregressive (AR) process states that the time series linearly depends on its own
preceding values and a stochastic term. The model is of order p and it forecasts the variable
when a correlation between time series value and its predecessors exists. The AR (p) model is
expressed as:
 " = + ' "(' + ) "() + … + , "(, + " (1)

 5
4.1.2. Moving Average Process (MA)
A moving average model (MA) process includes q lags and states that the time series relies
on the current and preceding values of a stochastic term. The MA(q) is as follows:
" = " + ' "(' + ) "() + … + 3 "(3 (2)
4.1.3. Autoregressive Moving Average Model (ARMA)
ARMA combines both AR and MA process. The ARMA model (p, q) is estimated as:
" = + ' "(' + … + , "(, + " + ' "(' + … + 3 "(3 (3)
Where = 1, 2, … , is a constant, , and 3 are the coefficients, and the random
variable " is the stochastic term.
4.1.4. Autoregressive Integrated Moving Average Model (ARIMA)
ARIMA (p, d, q) models denote an extension of ARMA process. They are employed in
nonstationary cases, in which one or more initial differentiation step is applied to remove
non-stationarity. The three parameters of ARIMA are: autoregressive order (p), differencing
degree (d), and moving average order (q). The ARIMA (p, d, q) model is expressed as
follows:
∆ " = + ' ∆ "(' + … … + , ∆ "(, + " + ' "(' + … + 3 "(3 (4)
4.2. Box Jenkins Method
George Box and Gwilym Jenkins (1970) propose four steps to conduct ARIMA modeling,
these steps are: identification, estimation, diagnostic checking, and forecasting. They are
recognized as the Box-Jenkins method.
4.2.1. Model Identification
The appropriate model identification starts by evaluating whether the time series is stationary
or not, through plotting the initial data and implementing unit root tests (such as Augmented
Dickey and Fuller). Afterwards, the differencing degree is selected accordingly. Next, the
Autocorrelation (ACF) and the partial autocorrelation (PACF) functions are used to identify
the parameters of the ARMA model.
64.2.2. Model Estimation The parameters estimation of the selected ARIMA (p, d, q) model is through computation of algorithms practice. Non-linear minimum-square estimate or Maximum Likelihood Estimate (MLE) remain the most common methods used. ARIMA models with different orders are estimated. The best fit is selected in the basis of minimum Akaike’s Information Criterion (AIC) and Bayesian Information Criteria (BIC) of the assessed tentative models. 4.2.3. Diagnostic Checking The purpose of this step is to check the adequacy of the selected model, and if it is good fit to forecast. The model residuals should follow a normal distribution, be constant in variance and mean over time, and has no serial correlation with each other. If any of the assumptions are violated, adjustments in step one should be considered to build the best fitted model. 4.2.4. Model Forecasting The selected ARIMA model is considered adequate after the residual diagnosis and it forecasts on the basis of its own past values and that of the stochastic term to predict future time series. 5. EMPIRICAL RESULTS 5.1. Model Identification Graphically the GDP plots over the 1980 - 2020 period for Qatar, KSA, and the UAE demonstrate a nonstationary nature and trend components (see Figure 1). Furthermore, the results of Augmented Dickey and Fuller (ADF) unit root test presented in Table 2 confirms a nonstationary nature of lnGDP under the 1% significance level (p-value > 0.01). The GDP values of the three countries are transformed into stationary at second difference where the p- value is now smaller than 0.01. Therefore, d = 2 presents the differencing degree of lnGDP series for the three cases (Qatar, KSA, and the UAE). 7
Table 2. Augmented Dickey and Fuller (ADF) Unit Root Test

 Level First Difference Second Difference Differencing
Variable
 Statistics p-value Statistics p-value Statistics p-value Degree
lnGDP- Qatar -1.887 0.6179 -1.995 0.5753 -4.669 0.01 d=2
lnGDP- KSA -2.077 0.5433 -3.738 0.03496 -4.937 0.01 d=2
lnGDP- UAE -1.017 0.9233 - 3.283 0.089 -4.710 0.01 d=2
Note: H< : time series have unit root (p-value > 0.01, fail to reject H< ).
 H' : time series do not follow unit root

The plot of lnGDP variable at the second difference of the three understudy countries is
presented in Figure 2. The figure satisfies the stationarity and non-trending pattern for the
adjusted series of the three samples in this study.

Figure 2. Time Series Plot of lnGDP at Second Difference.

After the series transformation to stationary at d=2, the following step is to determine the
other parameters in the ARIMA models (p and q). We consider ACF and PACF for each

 8
country and they are presented in Figure 3. Both ACF and PACF lags recommend significant
autocorrelation at a maximum lag of one for the three cases, suggesting a possible MA (1)
and AR (1). The recommended fit model for GDP series in the three explored countries is
ARIMA (1,2,1). However, since the estimated ACF and PACF are relatively complex and
identification of ARIMA (1, 2, 1) is not certain and straight forward, other tentative models
are estimated. The best fit for each country is selected by comparing different goodness-of-fit
measures (minimum AIC and BIC) of the ARIMA models estimates.

Figure 3. ACF and PACF plot of lnGDP at Second Difference.

 Time Series: Qatar Time Series: Saudi Arabia

 Time Series: United Arab Emirates

 9
5.2. Model Estimation
 The AIC and BIC results of the tentative ARIMA models are presented in Table 3. The best
 fit model for Qatar sample is ARIMA (0,2,1) with a minimum AIC and BIC of -60.33 and -
 5.34 respectively. That of KSA and UAE is ARIMA (0,2,1) as well; with minimum AIC (-
 78.94) and BIC (-72.28) for KSA sample and AIC (-81,273) and BIC for the UAE sample.

 Table 3. Comparison of Tentative ARIMA Models.

 Qatar KSA UAE
 Model
 AIC BIC AIC BIC AIC BIC

 ARIMA (1,2,1) -60.90 -65.90 -78.72 -73.73 -81.72 -76.73

 ARIMA (0,2,1) -62.32 -58.99 -79.47 -76.14 -82.60 -79.23

 ARIMA (1,2,0) -56.61 -53.28 -76.37 -73.04 -73.16 -69.84

 The estimate results, along with the standard error (S.E.) and probability value (Prob.) of the
 best fitted model ARIMA (0,2,1) for Qatar, KSA and the UAE is presented in Table 4. The
 MA coefficient is statistically significant in all three model at the 1% level of significance.
 Indicating that GDP series depends on the past one-year value of the stochastic term.

Table 4. Parameter Estimates.

 Qatar KSA UAE

Coefficients Estimate S.E. Prob. Estimate S.E. Prob. Estimate S.E. Prob.

MA (1) -0.6822 0.1441 0.000*** -0.8248 0.2347 0.000*** -0.8909 0.1216 0.000***

Note: Statistical significance: * = 10%, ** = 5%, *** = 1%.

 The estimated regression equations of ARIMA (0,2,1) for the three countries, comprise as
 follow:

 Qatar: ∆) lnGDPC = −0.6822 "(' (5)
 Saudi Arabia: ∆) lnGDPC = −0.8248 "(' (6)
 United Arab Emirates: ∆) lnGDPC = −0.8909 "(' (7)

 10
Where ∆) lnGDP represents the second difference of Gross Domestic Product natural
logarithms across time and "(' is the stochastic error term of the preceding values from
the previous year.
5.3. Residual Diagnostics
To check the robustness of the estimated model to forecast, a diagnostic checking is
performed according to the Box-Jenkins approach. Results of the residual assumptions are
presented in Figure 4 (see Appendix). The variance of the error terms in the three models are
equal, thus, the assumption of homoscedasticity is not violated. ACF of the residuals show
independence of variance; no autocorrelation among the error terms is concluded.
Furthermore, the Q-Q plot points seem to form a straight line suggests that the residual
follows a normal distribution. Hence, the estimated model is a good fit to forecast.
5.4. Forecasting
Following ARIMA (0,1,2) residual diagnostics checking; equations (5), (6) and (7) are
respectively used to forecast the annual GDP of Qatar, Saudi Arabia and the United Arab
Emirates for the next five years (2021 – 2025).
The predicted GDP values of the three understudy countries are given in Table 4. A high
forecasting power is concluded with a 95% confidence interval. The GDP forecast of Qatar is
expected to gradually increase from 261.98 billion U.S. dollars in 2020, to reach 270.72
billion U.S. dollars in 2025. Whereas Saudi Arabia GDP value is estimated to be 1,734.01
billion U.S. dollars in 2025 compared to 1,627.3 billion U.S. dollars in 2020. The United
Arab Emirates GDP is expected to continue increasing throughout the years and reach 738.25
billion U.S. dollars in 2025.
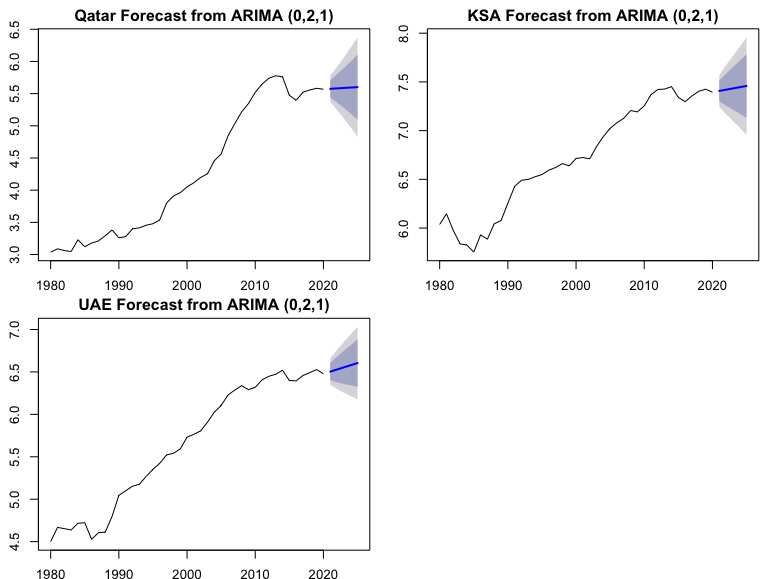
11Table 4. Forecasted Values of GDP in billions U.S. dollars. Qatar KSA UAE Year 95% Confidence 95% Confidence 95% Confidence Forecast Forecast Forecast Interval Interval Interval GDP Lower Upper GDP Lower Upper GDP Lower Upper 2021 263.72 215.13 323.28 1648.11 1401.04 1938.75 667.44 571.48 779.52 2022 265.47 189.54 371.81 1669.18 1299.15 2144.59 684.48 542.86 863.04 2023 267.23 166.39 429.17 1690.51 1211.66 2358.60 701.95 520.46 946.74 2024 268.99 144.91 499.36 1712.13 1130.47 2593.06 719.87 500.61 1035.17 2025 270.78 125.07 586.24 1734.01 1053.19 2854.96 738.25 482.05 1130.61 The actual and forecasted lnGDP for the next 5 years in Qatar, KSA and the UAE is presented in Figure 5 with a 95% confidence interval. The plot indicates a continuous increase and an upward trend in the future predicted values of lnGDP. Comparing the three trends, United Arab Emirates has a steeper increase and the economic growth in Qatar is expected to slightly raise. Figure 5. Time Series plot for Actual and Forecasted lnGDP using ARIMA (0,2,1). 12
6. CONCLUSION
The GDP forecast model is a significant contribution to government and policy makers. It is
critical for future planning and to understand the economy well-being. Forecasting techniques
help in decision making and choosing to implement new ideas and technologies. Many
researchers used the ARIMA model to forecast a country’s GDP (Judi, 2007; Zakai, 2014;
Wabomba, 2016; Abonazel and Abed-Elftah, 2019)

This paper aims to develop an empirical forecast of GDP in Qatar, Saudi Arabia, and the
United Arab Emirates using the ARIMA model. The growth in GCC economies have been of
interest for researchers. An annual GDP series from 1980 to 2020 is used in this study. The
model ARIMA (0, 2, 1) is recognized as the best suited model to predict GDP in the three
countries.

Empirical results show that the forecasted data is reliable, and the series is consistent and
statistically significant. The anaylsis suggest a continuous growth in the three GCC nations
for the upcoming five years. However, many factors and unexpected shock might influence
GDP. For instance, the COVID-19 pandemic had a negative impact on economic activities
globally.

A possible limitation of this study is the number of observations of the GDP series. This
study is restricted to the use of annual GDP from 1980 till 2020 because of data availability.
Although such number of observations is suitable for forecast by means of the ARIMA
model. For future work, researchers are encouraged to compare several forecasting
techniques like exponential smoothing, vector autoregressive and neural networks.

 13
REFERENCES
Ab Rahman, A. B., & Abu-Hussin, M. F. B. (2009). GCC Economic Integration
Challengeand Opportunity for Malaysian Economy. Journal of International Social Research,
2(9).

Abonazel, M. R., & Abd-Elftah, A. I. (2019). Forecasting Egyptian GDP using ARIMA
models. Reports on Economics and Finance, 5(1), 35-47.

Agrawal, V. (2018). GDP modelling and forecasting using ARIMA: an empirical study from
India. Central European University.

Box, G. E. P., and Jenkins, G., (1970). Time Series Analysis, Forecasting and Control,
Holden-Day, San Francisco.

Dinh, D. V. (2020). Forecasting domestic credit growth based on ARIMA model: Evidence
from Vietnam and China. Management Science Letters, 10(5), 1001-1010.

Dritsaki, C. (2015). Forecasting real GDP rate through econometric models: an empirical
study from Greece. Journal of International Business and Economics, 3(1), 13-19.

Eissa, N. (2020). Forecasting the GDP per Capita for Egypt and Saudi Arabia Using ARIMA
Models.

Gulf Cooperation Council (GCC). Available at https://www.gcc-sg.org/en-
us/CooperationAndAchievements/Achievements/EconomicCooperation/TheCustomsUnion/
Achievements/Pages/IITheGCCCustomsUnionJanuary200.aspx (accessed May 4, 2021).

Judi, Y. (2007). Forecasting the Non–Oil GDP in the United Arab Emirates by Using
ARIMA Models. International Review of Business Research Papers, 3(2), 162-183.

Leamer, E. E., & Leamer, E. E. (2009). Gross domestic product. Macroeconomic patterns
and stories, 19-38.

 14
Maity, B., & Chatterjee, B. (2012). Forecasting GDP Growth Rates of India: An Empirical
Study. International Journal of Economics and Management Sciences, 1(2012), 52-58.

Ning, W., Kuan-jiang, B., & Zhi-fa, Y. (2010). Analysis and forecast of Shaanxi GDP based
on the ARIMA Model. Asian Agricultural Research, 2(1812-2016-143365), 34-41.

Vohra, R. (2017). The impact of oil prices on GCC economies. International Journal of
Business and social science, 8(2), 7-14.

Voumik, L. C., & Smrity, D. Y. (2020). Forecasting GDP Per Capita In Bangladesh: Using
Arima Model. European Journal of Business and Management Research, 5(5).

Wabomba, M. S., Mutwiri, M. P., & Fredrick, M. (2016). Modeling and forecasting Kenyan
GDP using autoregressive integrated moving average (ARIMA) models. Science Journal of
Applied Mathematics and Statistics, 4(2), 64-73.

Zakai, M. (2014). A time series modeling on GDP of Pakistan. Journal of Contemporary
Issues in Business Research, 3(4), 200-210.

Zhang, H., & Rudholm, N. (2013). Modeling and forecasting regional GDP in Sweden using
autoregressive models. Dalama University.

 15
APPENDIX

Figure 4. Residual Analysis Plot of the ARIMA (0, 2, 1).

 Qatar

 Saudi Arabia

 United Arab Emirates

 16
You can also read