E-COMMERCE: FASHION - statcdn.com
←
→
Page content transcription
If your browser does not render page correctly, please read the page content below
E-COMMERCE: FASHION

DATA AND ANALYSIS WITHIN THIS REPORT
Overview

Pages      Subject                                                             Essentials
03 – 05    Detailed overview
            ›   Market scope                                                     Ongoing shift from offline to online fashion purchases
            ›   Customer benefit, market size                                    with new services brick and mortar can’t offer

            ›   Future developments, assumptions and sensitivity                 Mobile shopping gains importance

06 – 09    KPI-Comparison
            ›   Market KPI comparison by region in charts
                                                                                 Biggest market is China with US$125.8 billion in 2016
            ›   Market KPI comparison by region in tables
                                                                                 China has the highest average growth rate of 18%
            ›   Market sizing subjects for e-Commerce Fashion forecast

10 – 11    Top Player
            ›   Zalando - Company Profile , KPI Comparison: Zalando vs. Asos
                                                                                 Zalando succeeds with an aggressive marketing
                                                                                 strategy

12         Trend

                                                                                                                                          © Statista Digital Market Outlook
            ›   Curated Shopping                                                 Curated Shopping services gain market traction

13 – 15    Structure, contacts and imprint

                                                                                                                                      2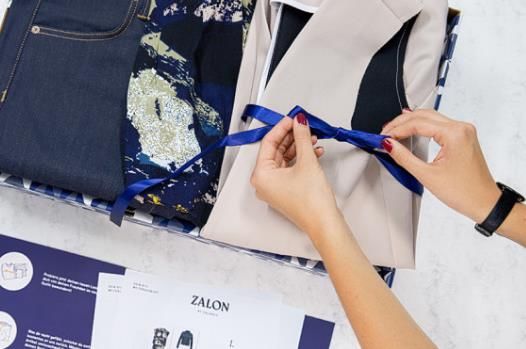
E-COMMERCE MARKET
Market focus: Fashion

                                     Fashion
   Electronics & Media                                         Furniture & Appliances

   Food & Personal Care                                          Toys, Hobby & DIY

                                                                                            © Statista Digital Market Outlook
                                                                                        3
                          Focus Segment        Other Reports
ONLINE FASHION STORES OFFER SERVICES THAT
CONSUMERS CAN’T FIND OFFLINE
Customer benefit                                                             Market size
The fashion segment is a               The consumer can get inspired         The size of the global fashion e-      purchasing power makes it a very
relatively     mature       market     through different means such as       Commerce market is about               attractive market for online
segment in the e-Commerce              personalization              and      US$332.1 billion in 2016 and           merchants.
cosmos. Before the possibility of      recommendations     (based    on      accounts for 28% of the total e-
                                                                                                                    Big online players for fashion in
online    shopping,    clothes   in    personal    taste  or   previous      Commerce market.
                                                                                                                    Europe are Zalando, Vente Privee,
particular were not only purchased     purchases).
                                                                             The three regions covered in this      Asos, the Otto Group and H&M.
in stores but also through mail
                                       Also social influencers play a big    report have an accumulated online
order catalogues.                                                                                                   The US market is valued at US$
                                       role in the fashion segment.          fashion revenue of US$275.8
                                                                                                                    63.3 billion in 2016. The European
The segment covers all men and         Fashion blogs or social media         billion in 2016 and cover more
                                                                                                                    market accounts for 26.1% of the
women’s clothing, accessories (e.g.    platforms like Instagram reach a      than 83% of the global e-
                                                                                                                    global market, while the US has a
hats, scarves, gloves), shoes and      huge audience. Using these,           Commerce fashion market.
                                                                                                                    share of 19.0%. Relevant players in
shoe    accessories     (e.g.   care   influencers can directly advertise
                                                                             The Chinese market has grown to        the US market are online shops of
products) as well as different kinds   certain brands and products or
                                                                             a total volume of US$125.8 billion     retailers Gap and Nordstrom as
of bags (daypacks and purses)          indirectly through paid subtle
                                                                             and is by far the largest online       well as the pure player Amazon.
and luggage purchased online.          product placement.
                                                                             fashion market. The willingness of
                                                                                                                    The market size includes gross
The broader product range              An example of services that go        Chinese consumers to shop
                                                                                                                    merchandise volume, meaning
(colors, sizes, styles) offered in     beyond the standard online            outside of their country (87% of
                                                                                                                    returns have not been deducted.
online shops, free shipping,           shopping is curated shopping:         shoppers) and the strong focus on
                                                                                                                    Particularly in the fashion segment
improved delivery services (e.g.       individual outfits are put together   luxury fashion for certain wealthy
                                                                                                                    high return rates are a cost factor
same day delivery) and hassle free     by personal style advisers. One       consumer      groups,     have    a
                                                                                                                    but for the most part are still
return processes are all factors       example in this niche market is       significant impact on the market.
                                                                                                                    inevitable.
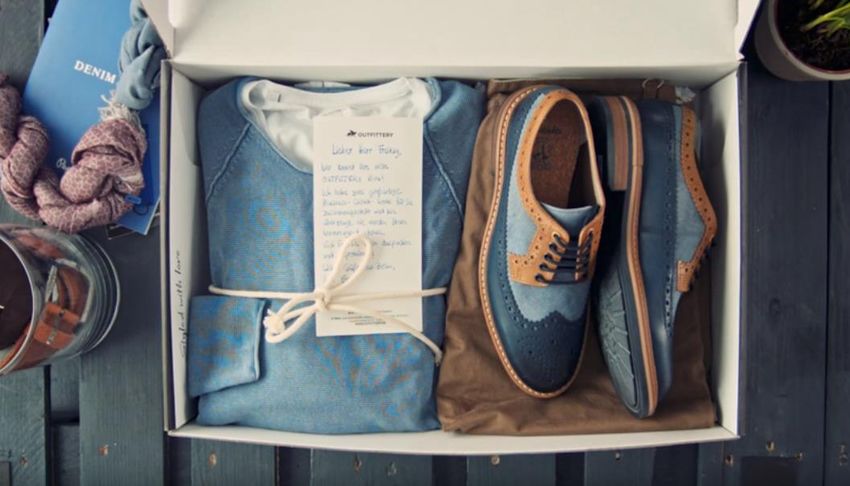
that support the ongoing trend         Outfittery who specialize in men’s
                                                                             The European fashion market is

                                                                                                                                                          © Statista Digital Market Outlook
towards online shopping in the         clothing or Trunk Club for men
                                                                             the second biggest in this
fashion segment.                       and women.
                                                                             comparison with a volume of
Some online shops selling fashion                                            US$86.8 billion in 2016. The large
products offer services that                                                 internet population, relatively high
customers can’t find in ordinary                                             online    shopper      penetration,
brick and mortar businesses.                                                 combined with comparably high

                                                                                                                                                   4
FASHION GOES TECH WITH CHINA AS THE
GLOBAL GROWTH ENGINE
Future developments Assumptions and sensitivity
We expect that e-Commerce in the which means growth is mainly One of our key assumptions is the customers convert to using mobile
global1 fashion segment will grow driven by the continuous shift by shift from offline to online retail. research. Also social networks like
at an average annual growth the existing customer base from But also both “worlds” are Instagram, where social
rate of 13.8% by 2021 to reach a offline to online purchases. increasingly connected as cross- influencers reach huge audiences
total market size of US$633.5 channel services are and try to generate authentic and
New emerging technologies will
billion. implemented. An example of appealing inspirations and
shape the customer experience
seamless integration of online and recommendations, are mostly
The growth potential remains and the efficiency of e-Commerce
offline channels is “Click & Collect”. used on mobile devices.
relevant due to ongoing differen- in different ways: virtual “fitting
tiation in comparison to ordinary rooms” give customers the option The fashion market landscape can As well as known brands, online
offline retail. Additionally existing to create 3D avatars. The shopper be divided into brand shops offer own-label collections
and new niche concepts of online has a better feel for the products marketplaces (Zalando, Zappos), (e.g. Asos). This creates the
retailers are a relevant factor. which results in less returns (and design shops (Net-A-Porter), the advantage of differentiation from
therefore reduced costs for the online presence of ordinary other vendors as well as higher
The fastest growing region is
vendor) as well higher customer retailers (H&M, Gap), generalists margins (no middleman). Also with
China with 17.8% CAGR2 to 2021.
satisfaction. (Amazon) and discount clothing the help of big data and analysis of
China’s online fashion sales is
shops (boohoo). customer shopping behaviors,
expected to reach three times the One of the most important trends
products can be developed with
size of the US market by 2021. This of the segment is “Fast fashion”. It is not a “winner-takes-it-all”
this knowledge in mind.
development is supported by an Fast fashion retailers like Zara or market due to fast-moving
ongoing Chinese internet H&M decrease the “time to fashion trends and niche An easy return process is key to
penetration growth (new market”, i.e. the time between segments where it’s difficult for customer satisfaction. For
potential customers) and picking up trends and making just a few big players to cover all merchants, the best-case scenario
increasing purchasing power them available for their needs. would be to reduce current return
© Statista Digital Market Outlook
especially in the urban areas of the customers through optimized rates in order to keep margins at a
The aspect of mobile shopping is
country. The penetration of 51.3% value chains. substantial level. But due to the
important. The ongoing growth of
in 2016 – compared to the US and remaining growth potential in
Other examples of trend signals smartphone penetration will
Europe – is relatively low. the market, the focus is still on
are: augmented and virtual ensure strong growth rates in
customer acquisition and loyalty in
In Europe and the US internet reality shopping as well as mass mobile shopping. With better and
order to increase overall sales.
penetration is already very high, customization (3D-printed shoes). easier online services, more
1: Only includes countries listed in the Digital Market Outlook.
2: CAGR: Compound Annual Growth Rate/ average growth rate per year. 5FASHION IN MA JOR REGIONS
Market KPI comparison by region
United States China Europe
Revenue forecast
in million US$ by region +8.8% p.a. +17.8% p.a. +10.1% p.a.
Bags & Accessories:
42,073
Shoes: 55,166
Clothing: 17,667 21,969
13,154 12,858 28,030
9,508 26,002 188,075
12,349
19,032
8,880 82,130 90,549
70,906 54,874
44,897
2016 2021 2016 2021 2016 2021
Revenue per user
in US$ by region
105.84 68.05 98.61
2016 119.28 2016 80.39 2016 134.16
357.71 216.87 321.10
© Statista Digital Market Outlook
118.35 96.92 119.50
2021 126.65 2021 113.02 2021 148.38
415.73 312.02 378.47
Source: Digital Market Outlook 2016 6FASHION IN MA JOR REGIONS
Market KPI comparison by region
United States China Europe
Revenue
CAGR1 CAGR1 CAGR1
Segment Unit 2016 2017 2018 2019 2020 2021 2016 2017 2018 2019 2020 2021 2016 2017 2018 2019 2020 2021
16 – 21 16 – 21 16 – 21
Total mUS$ 63,286 69,821 76,846 83,918 90,343 96,408 +8.8% 125,799 159,014 193,897 228,004 260,469 285,313 +17.8% 86,764 96,670 107,676 119,216 130,831 140,548 +10,1%
Clothing mUS$ 44,897 49,973 55,427 60,950 65,933 70,906 +9.6% 82,130 105,992 130,154 152,846 173,867 188,075 +18.0% 54,874 61,535 68,885 76,536 84,173 90,549 +10,5%
Shoes mUS$ 8,880 9,590 10,362 11,130 11,852 12,349 +6.8% 26,002 31,755 37,834 43,790 49,423 55,166 +16.2% 19,032 20,689 22,510 24,409 26,314 28,030 +8.1%
Bags &
mUS$ 9,508 10,258 11,058 11,838 12,558 13,154 +6.7% 17,667 21,268 25,909 31,368 37,179 42,073 +19.0% 12,858 14,446 16,280 18,271 20,344 21,969 +11.3%
Accessories
Users
CAGR1 CAGR1 CAGR1
Segment Unit 2016 2017 2018 2019 2020 2021 2016 2017 2018 2019 2020 2021 2016 2017 2018 2019 2020 2021
16 – 21 16 – 21 16 – 21
Clothing m 126 135 144 154 162 171 +6.3% 379 420 468 519 571 603 +9.7% 171 184 198 213 228 239 +7.0%
© Statista Digital Market Outlook
Shoes m 74 79 85 90 95 98 +5.5% 323 353 385 419 453 488 +8.6% 142 151 161 171 181 189 +5.9%
Bags &
m 90 95 100 104 108 111 +4.4% 260 288 322 361 402 434 +10.8% 130 141 152 164 175 184 +7.1%
Accessories
1: CAGR: Compound Annual Growth Rate/ average growth rate per year.
Source: Digital Market Outlook 2016 7KEY-TAKE-AWAYS BY REGION
Market sizing subjects for Fashion forecast
United States China Europe
› In 2016 second highest single-country › Biggest single-country market globally › Diverse market sizes, though the third
market with US$63.3 billion in revenue with US$125.8 billion in 2016 and fifth largest fashion markets are
located in Europe (UK and Germany)
› Within the fashion market, clothes › Average revenue per user is the
Market size
generate the majority of revenue, smallest when compared to US and › As in China and the US, fashion
about 70% in 2016 Europe, with US$216.9 per user in the revenues are dominated by the
clothing segment clothing segment, generating more
than 60% of the total
› Tmall has an exceptional market
position in the online apparel segment
› Though the US is a pioneer in online › Highest growth rate with a CAGR of › Europe has still a relatively high growth
fashion sales, it still has a high single- 17.8% mainly because of ongoing rate with a CAGR of 10.1%
digit CAGR1 of 8.8% internet penetration and user growth
› Revenue is expected to increase to
Growth rate
› User growth ranges between 4-6%, › Revenue is expected to reach a market US$140.5 billion in 2021
depending on the specific segment, volume of US$285.3 billion in 2021
› Online clothing shoppers will reach
› A significant part of market growth will 239 million by 2021, a 40% increase
be generated through increasing compared to 2016
baskets and higher order frequencies
› Major online shops (Amazon, eBay), › Chinese cross-border online shoppers › Region is a strategic target for online
test ground for new products and should be considered by foreign retailers who want to grow their global
services vendors (e.g. tailored offers) footprint
© Statista Digital Market Outlook
Trend signals › ›
Expansion of same day delivery › Social content-driven commerce Noticeable: Curated shopping players
and inspirational platforms with high
?
availability will increase impulse buying through platforms like WeChat
social media activity are on the rise
› Zalando will become the most relevant
online fashion marketplace
1: Only sales of commercial vendors are in scope of the Digital Market Outlook
2: CAGR: Compound Annual Growth Rate/ average growth rate per year 8
Source: Digital Market Outlook 2016FASHION – 2ND HIGHEST GROWTH SEGMENT
Fashion global segment size and growth rates
Global1 e-Commerce Revenue CAGR2 16 – 21
in million US$ by segment
+12.3% p.a.
2,108,142
440,732 +11.8% p.a.
342,884 +11.5% p.a.
1,179,248
e-Commerce 218,358
252,757 +15.8% p.a.
Toys, Hobby & DIY :
199,040 472,626
Furniture & Appliances:
104,682 +10.2% p.a.
Food & Personal Care:
© Statista Digital Market Outlook
Electronics & Media: 290,622
633,542
Fashion: +13.8% p.a.
332,147
2016 2021
1: Only includes countries listed in the Digital Market Outlook
2: CAGR: Compound Annual Growth Rate/ average growth rate per year 9
Source: Digital Market Outlook 2016TOP PLAYER: ZALANDO
Company profile
Availability Background
Zalando, headquartered in In 2014, Zalando made one of
Berlin, was founded in 2008 and the most significant IPOs in the
has now become a major player history of European internet
in the European online fashion companies when it was valued at
business. US$6.7 billion.
Inspired by U.S. online retailer Following a very aggressive
Zappos, the German venture growth strategy, the company
builder Rocket Internet started became profitable in 2014 for
the company with a strong focus the first time and has had
on footwear, before expanding extraordinary success since
the product range to include then.
clothing and accessories.
Facts Analyst opinion
Active customers 17.9m (2015) Through aggressive marketing As Zalando still owns all
Zalando pursued their primary customer touchpoints, they are
Revenue €2,958.2m (2015) goal to become the largest able to use this data to further
online fashion retailer in Europe. improve their business.
EBIT €89.6m (2015) Now Zalando focuses on brands With several smart acquisitions
© Statista Digital Market Outlook
and develops a marketplace, (e.g. Tradebyte, Metrigo) Zalando
employees 9,987 (2015) which might be the only area additionally underlines its
Amazon is not dominating. capabilities in using customer
Average basket €67.8 (2015) data to boost the business in
The opportunity for brands is to
areas such as mobile commerce,
reach a wide range of customers
# of orders per customer personalized advertising and
3.1 (2015) and to gain customer insights.
social media.
10
Source: Company Information 2016PLAYER KPI COMPARISON: ZALANDO VS. ASOS
Zalando’s aggressive growth strategy outpaces organically growing Asos
Revenue in million € Zalando ›
Marketing spending as Country with
percentage the second
of revenues highest Zalando
revenue (US$ 56.3 billion in 2016)
Asos 26.7%
› Within the fashion market, clothes Asos
4,000 22.6%
generate the majority of revenue,
2,958 about 67%17.5%
in 2016
3,000
2,214 13.3%
1,762 11.2%
2,000 1,409
1,159 1,211
906 5.3% 5.7% 5.0%
1,000 510 704 4.1% 3.6%
466
0
2011 2012 2013 2014 2015 2011 2012 2013 2014 2015
Year-over-Year Revenue Growth EBIT Margin in percent
3 231%
2 4.1% 5.3% 5.7% 5.0%
127% 3.6%
© Statista Digital Market Outlook
1 52%
26% 31%
2.8% 3.0%
0 49% 41% 35% 27% -7.2% -6.5%
18%
-1 -11.6%
2011 2012 2013 2014 2015 2011 2012 2013 2014 2015
Source: Company Information 2016 11TREND: CURATED FASHION & STYLING SERVICES
Remote personal stylists recommend and package individual outfits
Background
Curated shopping players traditional fashion e-Commerce
address people who have no experience without generating
time or desire for shopping or high overhead costs. Though it is
the latest fashion trends. a niche segment, recent fundings
Personal stylists pick complete and acquisitions of players like
outfits including shoes and Trunk Club, Outfittery or
accessories based on a short Modomoto as well as market
survey of personal preferences. entries from players like Zalando
Curated shopping therefore (Zalon) underline the rising
adds a service component to the potential of this shopping trend.
HQ: Chicago (USA)
Founded: 2009
Funding: US$12.4m
Aquired by Nordstrom (US$350m in 2014)
HQ: Berlin (Germany)
Founded: 2012
Funding: US$59.8m
© Statista Digital Market Outlook
HQ: Berlin (Germany)
Founded: 2011
Funding: n.a.
Acquired The Cloakroom in 2016
Source: Company Website, Crunchbase 12FASHION REVENUE STREAMS
Market Structure and definition
Segment Sub-segments Out of segment
Outdoor and sports
clothing, sports shoes
Includes digital sale of almost all types of clothing
articles (e.g. t-shirts, coats, pants, underwear). The main This type of clothing and shoes
Clothing sales channels in this market segment are multi-brand that have a special purpose
merchants (e.g. Asos, Nordstrom) and online shops of are subsumed in the category
individual fashion retailers (e.g. Zara). “Sports & Outdoor”.
Toddler and baby clothes
This kind of clothing can be
This segment includes all types of shoes (e.g. casual found in the segment “Toys &
shoes, slippers, etc.) - with the exception of sports shoes Baby”.
– as well as shoe accessories and care products. The
Fashion Shoes main distribution channels in this market segment are
multi-brand merchants (e.g. Asos, Zappos) and online
reCommerce
shops of individual shoe retailers (e.g. Clarks).
The resale of used, defective
or repaired goods is not
included.
This segment contains various types of bags and
accessories. Included are for example, leather bags,
© Statista Digital Market Outlook
suitcases and purses, jewelry, hats, scarves, and gloves,
Bags & Consumer-to-Consumer
among others. The main sales channels in this market
Accessories segment are online fashion retailers (e.g. Asos, Zalando, Sales between private persons
Nordstrom) or dedicated luggage retailers such as (e.g. via Craigslist) are not
eBags. included.
In scope Other segment Out of scope 13ABOUT DIGITAL MARKET OUTLOOK
9 Markets, 34 segments & 85 sub-segments Details
Digital Media Connected Car › 50 countries
Video-on-Demand, Digital Music, Connected Hardware, Vehicle Services,
Video Games, ePublishing Infotainment Services › Direct access & downloads
› 7-Year coverage: 2015 – 2021
FinTech › Revenue forecasts
Digital Payments, Business Finance,
Smart Home
Personal Finance
Home Automation, Security, Home
Entertainment, Ambient Assisted Living,
eTravel Energy Management
Online Travel Booking, Mobility Services
e-Commerce
› User count & penetration
eServices Fashion, Electronics & Media, Food &
Personal Care, Furniture & Appliances, Toys,
Event Tickets, Fitness, Dating Services, Hobby & DIY
Food Delivery
eHealth Digital Advertising
Diabetes, Hypertension, Heart Failure Banner Ads, Video Ads, Search Ads,
Social Media Ads, Classifieds › Comparable data
© Statista Digital Market Outlook
Exclusive part of the Statista Corporate Account
Access to more than 1,000,000 statistics and all digital markets
more
moreinformation
information
14IMPRINT
Contacts and author
Tobias Bohnhoff
Managing Analyst
Tobias Bohnhoff studied Geography and Innovation Management.
He gathered deep knowledge of digital transformation processes
and innovative business models in numerous research and E-MAIL
consulting projects before he started to build up the Digital Market tobias.bohnhoff@statista.com
Outlook team at Statista.
WEB
statista.com/outlook
Released: September 2016
Imprint
Statista ▪ Johannes-Brahms-Platz 1 ▪ 20355 Hamburg ▪ +49 40 413 49 89 0 ▪ www.statista.com
Disclaimer
This study is based on survey and research data of the previously mentioned sources. The forecasts and market analysis presented were researched and prepared by Statista with great
care.
For the presented survey data, estimations and forecasts Statista can not assume any warranty of any kind. Surveys and forecasts contain information not naturally representing a reliable
basis for decisions in individual cases and may be in need of further interpretation. Therefore Statista is not liable for any damage arising from the use of statistics and data provided in this
report.You can also read


