KENO HILL SILVER DISTRICT PRE-FEASIBILITY STUDY OVERVIEW - March 29, 2019 NYSE AMERICAN: AXU
←
→
Page content transcription
If your browser does not render page correctly, please read the page content below
KENO HILL SILVER DISTRICT
PRE-FEASIBILITY STUDY OVERVIEW
           March 29, 2019
TSX: AXR           NYSE AMERICAN: AXU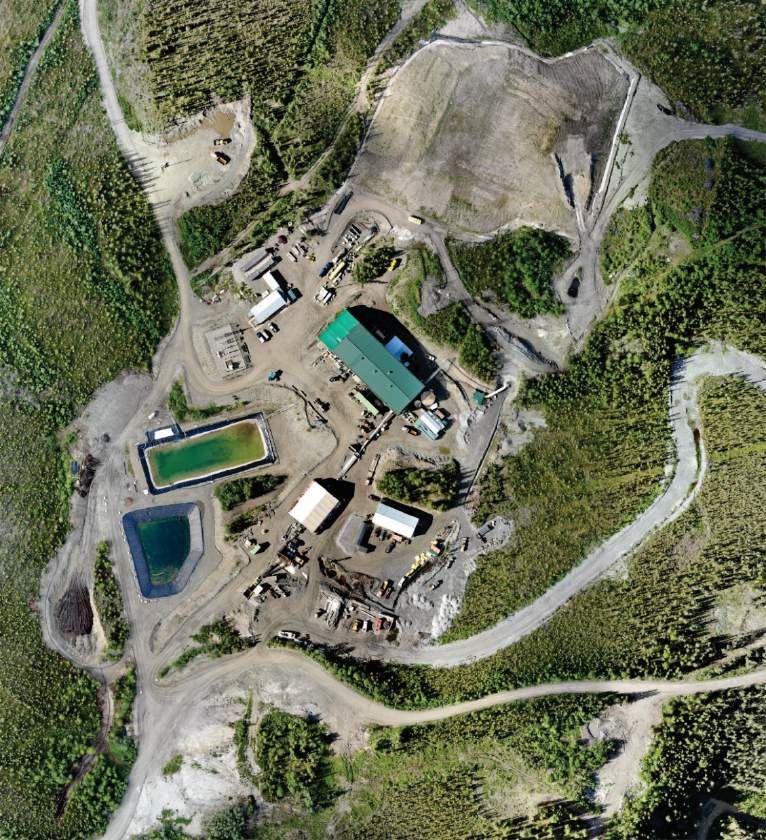
Cautionary Notes
Forward-Looking Statements
This presentation contains forward-looking statements within the meaning of the United States Private Securities Litigation Reform Act of 1995 and forward-looking information within the meaning of applicable Canadian securities
laws (together, “forward-looking statements”) concerning Alexco's business, including but not limited to statements with respect to results of the independent pre-feasibility study on Alexco’s Keno Hill Silver Project in Yukon,
Canada (the “PFS” or the “2019 PFS”); future mineral exploration including the estimation of mineral reserves and mineral resources and the realization of mineral reserve and mineral resource estimates; future mine construction
and development activities; future mine operation and production; the timing of activities and reports; the amount of estimated development and operational expenses; projected operational and economic metrics; the success of
exploration and development activities; the potential upside and growth in respect of certain deposits comprising the Keno Hill Silver Project; anticipated permitting time lines; anticipated installation of certain infrastructure;
projected equipment and production capacity; and potential capital, revenue and sources and uses of funds. Forward-looking statements are subject to a variety of known and unknown risks, uncertainties and other factors which
could cause actual events or results to differ from those expressed or implied by the forward-looking statements. Such factors include, among others, risks related to actual results and timing of exploration and development
activities; actual results and timing of mining activities; actual results and timing of environmental services activities; actual results and timing of remediation and reclamation activities; conclusions of economic evaluations; changes
in project parameters as plans continue to be refined; future prices of silver, gold, lead, zinc and other commodities; possible variations in mineable resources, grade or recovery rates; failure of plant, equipment or processes to
operate as anticipated; accidents, labour disputes and other risks of the mining industry; First Nation rights and title; continued capitalization and commercial viability; global economic conditions; competition; and delays in
obtaining governmental approvals or financing or in the completion of development activities. Forward-looking statements are based on certain assumptions that management believes are reasonable at the time they are made. In
making the forward-looking statements included in this news release, Alexco has applied several material assumptions, including, but not limited to, the assumption that Alexco will be able to raise additional capital as necessary,
that the assumptions, projections and estimates in the PFS will proceed as planned, and that market fundamentals will result in sustained silver, gold, lead and zinc demand and prices. There can be no assurance that forward-
looking statements will prove to be accurate and actual results and future events could differ materially from those anticipated in such statements. Alexco expressly disclaims any intention or obligation to update or revise any
forward-looking statements whether as a result of new information, future events or otherwise, except as otherwise required by applicable securities legislation. Alexco does not intend, and does not assume any obligation, to
update these forward-looking statements, except as required by applicable law. To the extent that such information may constitute a financial outlook within the meaning of applicable securities laws, such information has been
approved by management and is provided for the purposes of providing information relating to management and Alexco's current expectations and plans. Readers are cautioned that any such financial outlook information contained
herein should not be used for purposes other than for which it is disclosed herein.
The PFS was compiled by Mining Plus with contributions from a team of Qualified Persons as defined by National Instrument 43-101 – Standards of Disclosure for Mineral Projects (“NI 43-101”) as follows: Zach Allwright, P.Eng. of
Mining Plus, Adrian Churcher, P.Eng. of Mining Plus, Hassan Ghaffari, P.Eng of TetraTech, Paul Hughes, PhD, P.Eng. of Mining Plus, Gilles Arseneau, Ph.D., P.Geo. of SRK Canada Inc., Cliff Revering, P. Eng. of SRK Canada Inc. All mineral
resources are classified following the CIM Definition Standards for Mineral Resources and Mineral Reserves (May 2014), in accordance with the CIM Estimation of Mineral Resources and Mineral Reserves Best Practice Guidelines
and NI 43-101.
The disclosure in this presentation of scientific and technical information regarding exploration has been prepared by or under the supervision of Alan McOnie, FAusIMM, Alexco’s Vice President, Exploration, while that regarding
mine development and operations has been prepared by or under the supervision ofby Neil Chambers, P.Eng., Mine Superintendent, each of whom is a Qualified Person as defined by NI 43-101 and has approved the disclosure
herein. The technical information in this document was reviewed by Zach Allwright, P.Eng. and Adrian Churcher,P.Eng. both of Mining Plus, Gilles Arseneau, Ph.D., P.Geo. and Cliff Revering, Ph.D., P. Geo both of SRK Canada Inc. and
Hassan Ghaffarhi, P.Eng of Tetra Tech, each of whom is a Qualified Person and has approved the disclosure herein.

TECHNICAL DISCLOSURE CAUTIONARY STATEMENT
The PFS as summarized in Alexco’s news release dated March 28, 2019 titled “Alexco Announces Positive Pre-Feasibility Study for Expanded Silver Production at Keno Hill Silver District” (the “PFS News Release”) and this
presentation was compiled by Mining Plus Canada Consulting Ltd. with contributions by a team of Qualified Persons as set out in the PFS News Release and will be incorporated into a NI 43-101 technical report which will be filed on
SEDAR under Alexco’s profile within 45 days of the PFS News Release. References to information contained in the “PEA” or “2017 PEA” in this presentation pertain to the technical report dated March 29, 2017 with an effective date
of January 3, 2017, as amended September 14, 2018, titled “Technical Report Preliminary Economic Assessment of the Keno Hill Silver District Project, Yukon Territory, Canada”. All disclosure contained in this presentation regarding
the mineral resource and reserves estimates and economic analysis on the property is fully qualified by the full disclosure contained in the PEA and the PFS as applicable.
Readers are cautioned that mineral resources are not mineral reserves and do not have demonstrated economic viability . A production decision which is made without a feasibility study of mineral reserves demonstrating economic
and technical viability carries additional potential risks which include, but are not limited to, the risk that additional detailed work may be necessary with respect to mine design and mining schedules, metallurgical flow sheets and
process plant designs, and the noted inherent risks pertaining to the inclusion of approximately 2% inferred mineral resources in the mine plan.
This presentation has been prepared in accordance with the requirements of the securities laws in effect in Canada, which differ from the requirements of United States securities laws. The terms “mineral reserve”, “proven mineral
reserve” and “probable mineral reserve” are Canadian mining terms as defined in accordance with NI 43-101 and the Canadian Institute of Mining, Metallurgy and Petroleum (the “CIM”) - CIM Definition Standards on Mineral
Resources and Mineral Reserves, adopted by the CIM Council, as amended. These definitions differ materially from the definitions in SEC Industry Guide 7 (“SEC Industry Guide 7”) under the United States Securities Act of 1933, as
amended. Under SEC Industry Guide 7 standards, a “final” or “bankable” feasibility study is required to report reserves, the three-year historical average price is used in any reserve or cash flow analysis to designate reserves, and
the primary environmental analysis or report must be filed with the appropriate governmental authority. In addition, the terms “mineral resource”, “measured mineral resource”, “indicated mineral resource” and “inferred mineral
resource” are defined in and required to be disclosed by NI 43-101; however, these terms are not defined terms under SEC Industry Guide 7 and are normally not permitted to be used in reports and registration statements filed
with the SEC. Investors are cautioned not to assume that all or any part of a mineral deposit in these categories will ever be converted into SEC Industry Guide 7 reserves. “Inferred mineral resources” have a great amount of
uncertainty as to their existence, and great uncertainty as to their economic and legal feasibility. It cannot be assumed that all or any part of an inferred mineral resource will ever be upgraded to a higher category. Under Canadian
rules, estimates of inferred mineral resources may not form the basis of feasibility or pre-feasibility studies, except in rare cases. Investors are cautioned not to assume that all or any part of an inferred mineral resource exists or is
economically or legally mineable. It is reasonably expected that the majority of inferred mineral resources could be upgraded to indicated mineral resources with continued exploration. Disclosure of “contained ounces” in a
resource is permitted disclosure under Canadian regulations; however, the SEC normally only permits issuers to report mineralization that does not constitute “reserves” by SEC Industry Guide 7 standards as in place tonnage and
grade without reference to unit measures. Accordingly, information contained in this presentation regarding descriptions of the Corporation’s mineral deposits may not be comparable to similar information made public by U.S.
companies subject to the reporting and disclosure requirements under the United States federal securities laws and the rules and regulations thereunder, including SEC Industry Guide 7.

                                                                                                                                                                                                                                 2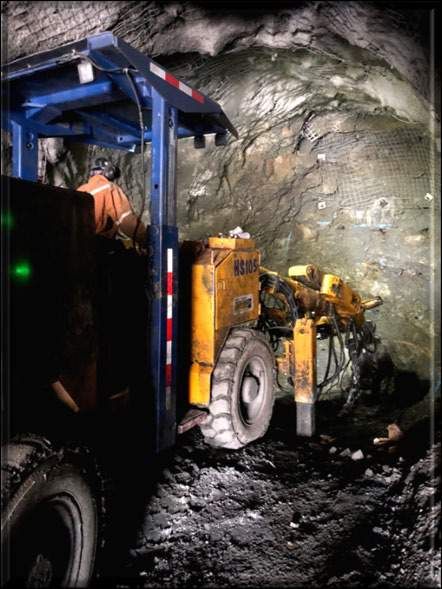
2019 Pre-Feasibility Study (“PFS”)

                                                                                           •      Expanded mineral resource
                                              Higher Ag production                         •      1.18 M tonnes of ore at 804 g/t Ag
                                                                                           •      Annualized Ag in concentrate 4.0 M oz

                                                                                           •      Initial capital costs of $23.2 M including $17.9 M of
                                               Lower initial capital                              development cost, and
                                                                                           •      Working capital – ramp up of $5.3 M
                   Relative
                                                                                           •      Direct operating costs of $321 per tonne of ore
                                             Lower operating costs
                         to                                                                •      LOM AISC/oz Ag of USD10.86*

                                                                                           •      Pre-tax NPV (5% DR) $136.4 M
                   2017 PEA                  Improved economics                            •      After-tax NPV (5% DR) $101.3 M
                                           (using lower silver price)                      •      Pre-tax IRR 84%
                                                                                           •      After-tax IRR 74%
                                                                                           •      ~1,000 meters underground development
                                                  Project de-risked                               completed, infrastructure in place
                                                                                           •      Mill modifications underway

                       A robust project in today’s pricing environment with longer term
                                     scalability and growth opportunities
* Calculated as of March 22, 2019 using the following prices: Ag USD 15.46/oz, Au USD 1,311.30/oz, Pb USD 0.9187/lb, Zn USD 1.2961/lb, and USD/CAD FX of $0.7457

                                                                                                                                                                   3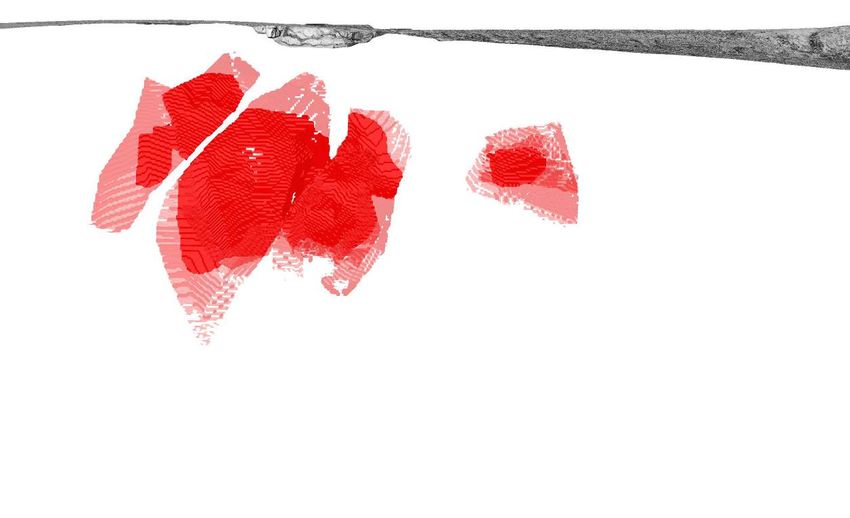
2019 PFS vs 2017 PEA
         LOM Metric (amounts in CAD)                                                              PFS 2019 (2)                  PEA 2017 (3)                      Δ
         LOM (years)                                                                                    8                           7.5                          7%
         LOM ore tonnage                                                                            1.18 M                        1.00 M                        18%
         Average silver grade (g/t)                                                                   804                           843                         (5%)
         Throughput (tonnes per day)                                                                  430                           375                         15%
         Average annual payable Ag ounces                                                            3.8 M                         3.5 M                         9%
         LOM Ag price (USD/oz)                                                                      $17.90                        $19.08                        (6%)

         Initial capital costs                                                                       $17.9 M                       $27.0 M
                                                                                                                                                                14%
         Working capital – ramp up                                                                    $5.3 M                         n/a
         Sustaining Capital (1)                                                                      $76.5 M                       $75.5 M                       3%

         Total NSR per tonne ore                                                                      $554                          $566                        (2%)
         Total cost per tonne ore (Capex + Opex)                                                      $402                          $425                         5%
         Total cash flow (pre-tax)                                                                   $174.1 M                     $139.7 M                      25%

         NPV (5% DR) pre-tax                                                                         $136.4 M                     $104.3 M                      31%
         NPV (5% DR) after tax                                                                       $101.3 M                      $79.4 M                      28%

         IRR pre-tax                                                                                      84%                          89%                      (5%)
         IRR after tax                                                                                    74%                          75%                      (1%)
(1)   After initial capital of $23.2 M
(2)
(3)
      PFS Average Metal Price and Discount Rate Assumptions: Ag USD/oz 15.75 initially and $18.25 long term, Zn USD/lb $1.22, Pb USD/lb $1.00 Au USD/oz $1,321, 5% Discount Rate.
      PEA Average Metal Price and Discount Rate Assumptions: Ag USD/oz 17.65 initially and $19.35 long term, Zn USD/lb $1.09, Pb USD/lb $0.97, Au USD/oz $1,294, 5% Discount Rate.
                                                                                                                                                                                     4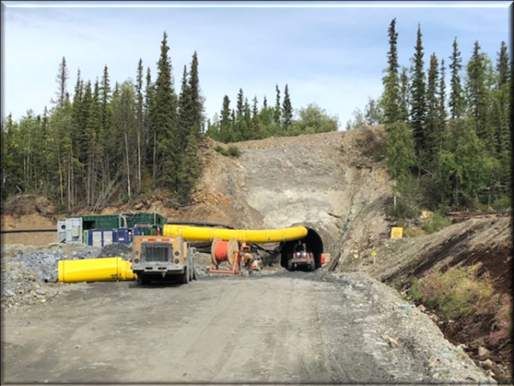
Keno Hill Silver District
    Located in the traditional territory of First Nation Na-Cho Nyäk Dun
    LOM Mineral Reserves by Deposit                             TOTAL LOM MINERAL RESERVE
                                                                                                1,177,379 Tonnes
                                                                                          804 g/t Ag, 2.98% Pb, 4.13% Zn
                                Indicates Area of 2019 PFS                                       (1,133 g/t AgEq)
                    NWT

Alaska

         YUKON

                                                             KENO DISTRICT MILL

                 FLAME & MOTH            BERMINGHAM                       LUCKY QUEEN             BELLEKENO
                    TONNES                  TONNES                           TONNES                TONNES
                    704,211                 362,343                           70,717                40,109
                     GRADE                   GRADE                            GRADE                 GRADE
                   672 g/t Ag              972 g/t Ag                      1,244 g/t Ag           843 g/t Ag

                                                                                                                   5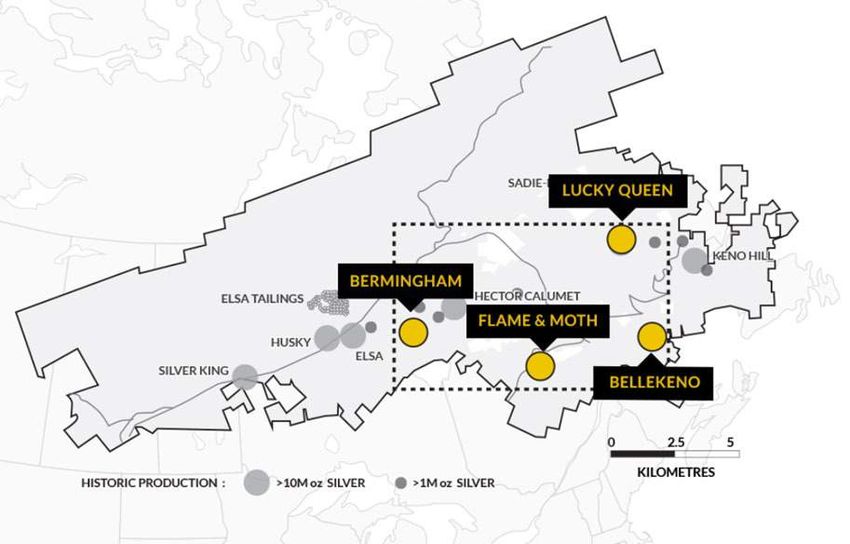
A High Margin, Low Capital Project

LOM (amounts in CAD)
Total project years                                     8
Pre-production / development capital cost           $17.9 M
Working capital ramp up                              $5.3 M
Net LOM revenue (Net Smelter Return “NSR”)          $652.0 M
Sustaining capital (PP&E + UG development)          $76.5 M
Total cash flow                                     $174.1 M
NPV (5% DR) pre-tax                                 $136.4 M
NPV (5% DR) after-tax                               $101.4 M
IRR pre-tax                                           83.7%
IRR after-tax                                         74.2%
LOM NSR (per tonne of ore)                            $554
LOM operating cost (per tonne of ore)                 $321
Sustaining capital cost (per tonne of ore)             $68

                        2019     2020     2021     2022     Long Term

              Ag        $15.75   $17.00   $17.50   $18.25   $18.25
Price         Au        $1,275   $1,315   $1,325   $1,325   $1,325
Assumptions
              Pb        $0.96    $1.00    $1.00    $1.00    $1.00
$US
              Zn        $1.25    $1.25    $1.22    $1.22    $1.22

              USD/CAD   $0.75    $0.76    $0.76    $0.76    $0.77
                                                                        6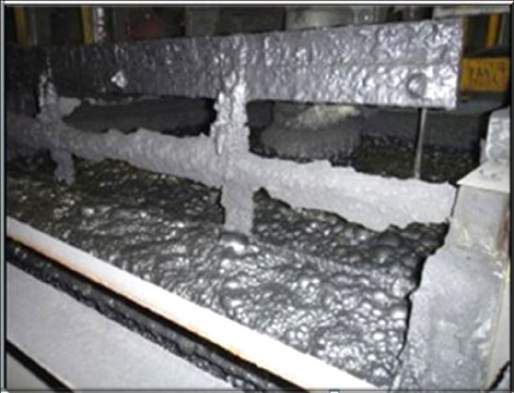
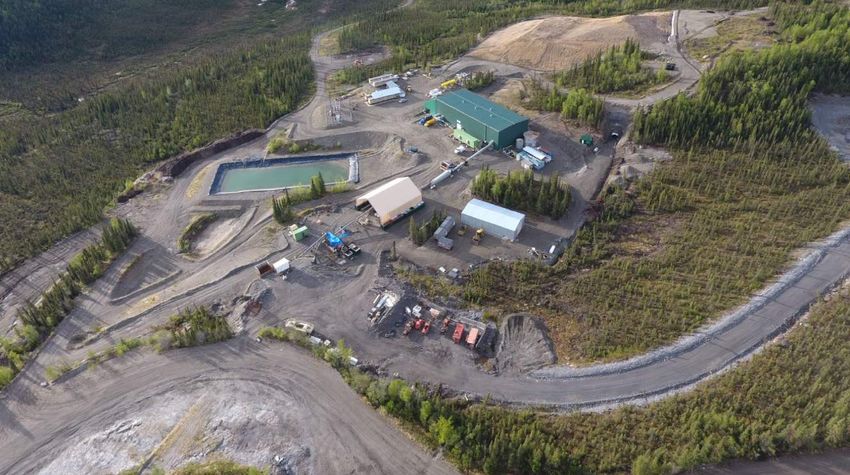
A De-Risked Project
~1,000 m primary ramp completed at
Bermingham and Flame & Moth 2018
4,200 m close spacing drilling and mineral
resource update Bermingham
Unit costs derived from 2018 actual
performance at Bermingham and Flame &
Moth
Flame & Moth water treatment plant
commissioned and operating to
compliance
Mill upgrades underway
Flame & Moth Water Use Licence
completed, Bermingham Water Use
Licence in progress ~Q3 2019
Experienced site management and staff
An established strong working relationship
with FNNND
7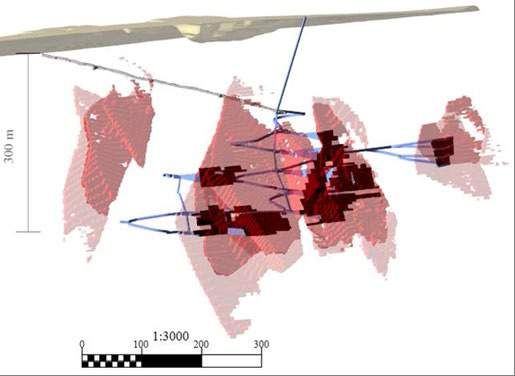
Capital and Operating Summary
All figures in CAD

            Capital Requirements                               Operating Costs Per Tonne

                                                                                       Sustaining
                                     Working                                            Capital
                                     Capital                                              $68
                                     $5.3 M

      Mine
                                                             Mining                                 G&A
   Development                               Owners Costs,
                                                              $201                                   $59
      PP&E                                    Contingency
     $11.8 M                                    $1.9 M

                                         Site PP&E
                                           $1.4 M
                                                                                       Processing
                                  Mill                                                    $61
                             Refurbishment
                                 $2.8M

                                                                        LOM NSR $/Tonne: $554
 Pre-production/Development Capital Costs: $17.9 M
                                                                 Total Operating $/Tonne: $321
                Working Capital – Ramp-Up: $5.3 M
                                                                Sustaining Capital $/Tonne: $68
                   Total Initial Capital Cost $23.2 M
                                                                        Margin per Tonne: $165
                                                                                                           8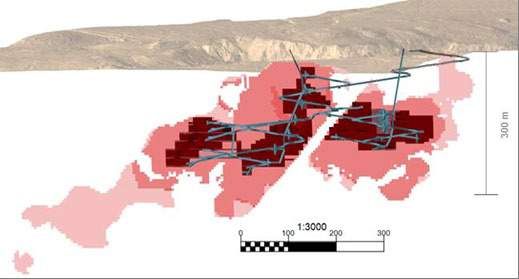
Production Profile

    Ag Ozs                                Payable Silver Ounces
  5,000,000

  4,500,000

  4,000,000

  3,500,000

  3,000,000

  2,500,000

  2,000,000

  1,500,000

  1,000,000

   500,000

         -
              Year 1   Year 2    Year 3      Year 4        Year 5     Year 6   Year 7   Year 8   Year 9

                                               Total Payable Ag Ozs

                                Total LOM Payable Ag Oz = 27.2 M

                                                                                                          9
By-Product Production Profile
Pounds Payable Zinc and Lead
12,000,000
10,000,000
8,000,000
6,000,000
4,000,000
2,000,000
-
Year 1 Year 2 Year 3 Year 4 Year 5 Year 6 Year 7 Year 8 Year 9
Payable Pb lbs Payable Zn lbs
10Keno Hill Average AISC – LOM
At Current Metals Prices2 and USD/CAD FX
USD/oz AISC1 per Produced (Contained) Oz Ag
$12.00
$0.80
$10.00
$2.40
$8.00 $3.50
($5.00)
$6.00
$1.60 ~$10 - $11
$4.00
$7.40
$2.00
$-
Direct Operating TCRCs By-Product Credit WPM Stream Site G&A and Corporate G&A and
Costs Sustaining Capital Exploration
1 AISC calculated on a produced (contained) basis net of by-products, as defined by the World Gold Council.
2 Calculated as of March 22, 2019 using the following: Ag USD 15.46/oz, Au USD 1,311.30/oz, Pb USD 0.9187/lb, Zn USD 1.2961/lb. and USD/CAD FX of $0.7457
11Flame & Moth LOM Plan
402 m complete
2018
Category Property Tonnes Ag (g/t) Au (g/t) Pb (%) Zn (%) Contained Ag (Oz)
March 2019 Mineral Reserve Flame & Moth 704,211 672 0.5 2.7 5.7 15,213,490
2015 Indicated Resource* Flame & Moth 1,679,000 498 0.4 1.9 5.3 26,883,000
2015 Inferred Resource Flame & Moth 365,200 356 0.3 0.5 4.3 4,180,000
* Indicated Resource is inclusive of Mineral Reserve 12Bermingham LOM Plan
550 m complete
2018
Category Property Tonnes Ag (g/t) Au (g/t) Pb (%) Zn (%) Contained Ag (Oz)
March 2019 Mineral Reserve Bermingham 362,343 972 0.1 2.6 1.3 11,323,635
2018 Indicated Resource* Bermingham 1,102,290 930 0.1 2.1 1.7 33,004,090
2018 Inferred Resource Bermingham 509,360 717 0.2 1.7 1.5 11,746,040
13
* Indicated Resource is inclusive of Mineral ReserveProcessing and Metallurgy
Premium Lead Concentrate
Average LOM Mill Recoveries
(Payable)
% Into Pb-Ag concentrate
Ag 91.0
Pb 88.6
Au 49.0
% Into Zn concentrate
Ag 4.6
Flame and Zn 73.6
Moth Portal
Concentrate Production*
Pb-Ag concentrate
Dry Tonnes 52,772
Ag g/t 17,316
Pb% 54.0
Zn-Ag concentrate
Dry Tonnes 65,436
Ag g/t 704
Zn% 53.0
* At full production
14PFS Project Execution Schedule
Short Runway to Production, Low Capital Costs
Months
PFS Process Timeline 1 2 3 4 5 6 7 8 9 10 11 12
Detailed Planning, Operational Readiness
Bermingham Permitting
Surface Infrastructure
Mill Modifications
Bellekeno Development
Flame and Moth Development
Bermingham Development
Mill Commissioning and Ramp-up
Production
CAD 17.9M Pre-Production/Development CAD 5.3M
Capital Working Capital
15Silver Producers Landscape Overview
Asset Benchmarking – Silver Developers – Total Resource (AgEq)
Grade (g/t AgEq) Deposit size
1,200
2019 PFS AgEq Mill Head
1,100 Grade
1,000 Keno Hill 800 Moz
900
800 Juanicipio
700 Las Chispas 400 Moz
600
Velardena
500
200 Moz
Mangazeisky
400
Cerro Las Mintas
300
Dolly Varden Sierra Mojada
200
San Acacio Corani
100 Bowdens
La Cigarra
-
- 50.0 100.0 150.0 200.0 250.0 300.0
Tonnage (Mt)
Source: Fort Capital, Public disclosures.
16PFS Mine Deposits (BM, FM, LQ)
Indication of Remaining Mineralized Material by Deposit
Tonnes Ag Ag Contained Contained
(g/t) (Oz/t) Ag (Moz) Ag-Eq (Moz)
Bermingham (Indicated) 738,000 835 26.8 19.8 22.3
Tonnes Ag Ag Contained Contained
(g/t) (Oz/t) Ag (Moz) Ag-Eq (Moz)
Flame & Moth (Indicated) 320,340 440 14.1 4.5 7.1
Lucky Queen (Indicated) 60,423 867 27.9 1.7 1.8
Remaining indicated mineral resources at CAD 400/tonne dollar-equivalent cut-off
1. Lucky Queen, Onek and Flame & Moth Mineral Resources are reported at a value per tonne cut-off of CAD$400/t using the following metal prices and recoveries; Ag US$20.00/oz,
recovery 96%; Pb US$0.95/lb, recovery 97%; Zn US$1.00/lb, recovery 88%; Au $1,300/oz, recovery 72%. Foreign exchange rate of 0.8 US$/CAD$.
2. Bermingham Mineral Resources are reported at a value per tonne cut-off of CAD$400/t using the following metal prices and recoveries; Ag US$20.80/oz, recovery 96%; Pb
US$1.05/lb, recovery 97%; Zn US$1.20/lb, recovery 88%; Au US$1450/oz, recovery 72%. Foreign exchange rate of 0.8 US$/CAD$.
3. Contained Ag-equivalent calculated using the parameters listed in notes 1 and 2.
4. Mineral Resources that are not Mineral Reserves do not have demonstrated economic viability. 17
5. Numbers may not add due to rounding.2018 Exploration – Selected Results
Bermingham Deposit Exploration Potential Oblique Longitudinal (looking NW)
Surface Etta Zone Arctic Zone Bear Zone Northeast Zone
Termination of BM Vein
against Ruby Vein
2018 Indicated Resource
2018 Inferred Resource
2019
Exploration
Target Areas
Termination of BM Vein
against Aho Vein
Bermingham Resource
200 m Indicated 1.10 Mt 930 g/t Ag
Inferred 0.51 Mt 717 g/t Ag
See slide 2 for PEA cautionary statement, news release dated March 29, 2017 entitled “Alexco and Silver Wheaton Amend Silver Purchase Agreement and Alexco Announces Positive Preliminary
Economic Assessment for Expanded Silver Production at Keno Hill” and news release dated September 20, 2018 entitled “Alexco Updates Bermingham Mineral Resource.”
18
See slide 22 for a full view of the Resource Table associated with the Keno Hill Silver District.You can also read