Full Year Results for the year ended 31 December 2018 - 1 March 2019 - Rightmove Investor Centre
←
→
Page content transcription
If your browser does not render page correctly, please read the page content below

1 March 2019

Full Year
Results
for the year ended
31 December 2018
Disclaimer
    This presentation has been prepared by Rightmove plc (the “Company”). No representation or warranty (express or implied) of any nature is
    given nor is any responsibility or liability of any kind accepted by the Company or any of its directors, officers, employees, advisers,
    representatives or other agents, with respect to the truthfulness, completeness or accuracy of any information, projection, representation or
    warranty (expressed or implied), omissions, errors or misstatements in this presentation, or any other written or oral statement provided.

    In particular, no responsibility or liability is or will be accepted and no representation or warranty is or is authorised to be given as to the
    accuracy, reliability or reasonableness of any forward-looking statement, including any future projections, management targets, estimates or
    assessments of future prospects contained in this presentation, or of any assumption or estimate on the basis of which they have been given
    (which may be subject to significant business, economic or competitive uncertainties and contingencies beyond the control of the management
    of the Company). Any such forward looking statements have not been independently audited, examined or otherwise reviewed or verified and
    nothing in this presentation should be construed as a profit forecast.

    All views expressed in this presentation are based on financial, economic, market and other conditions prevailing as of the date of this
    presentation. The Company does not undertake to provide access to any additional information or to update any future projections,
    management targets, estimates or assessment of future prospects or any other forward-looking statements to reflect events that occur or
    circumstances that arise after the date of this presentation, or to correct any inaccuracies in this presentation which may become apparent. Past
    performance is not indicative of future results and forward-looking statements are not guarantees of future performance.

    This presentation is for information purposes only and does not constitute an offering document or an offer of transferable securities to the
    public in the UK. This presentation is not intended to provide the basis for any credit or other evaluation of any securities of the Company and
    should not be considered as a recommendation, invitation or inducement that any investor should subscribe for, dispose of or purchase any
    such securities or enter into any other transaction with the Company or any other person. The merits and suitability of any investment action in
    relation to securities should be considered carefully and involve, among other things, an assessment of the legal, tax, accounting, regulatory,
    financial, credit and other related aspects of such securities.

    This presentation is being communicated or distributed within the UK only to persons to whom it may lawfully be communicated, and has not
    been approved for the purposes of section 21 of the Financial Services and Markets Act 2000. It may not be reproduced (in whole or in part),
    distributed or transmitted to any other person without the prior written consent of the Company. In particular this presentation is not intended for
    distribution to, or use by, any person or entity in any jurisdiction or country where such distribution or use would be contrary to local law or
    regulation. Any recipients of this presentation outside the UK should inform themselves of and observe any applicable legal or regulatory
    requirements in their jurisdiction, and are treated as having represented that they are able to receive this presentation without contravention of
    any law or regulation in the jurisdiction in which they reside or conduct business.

2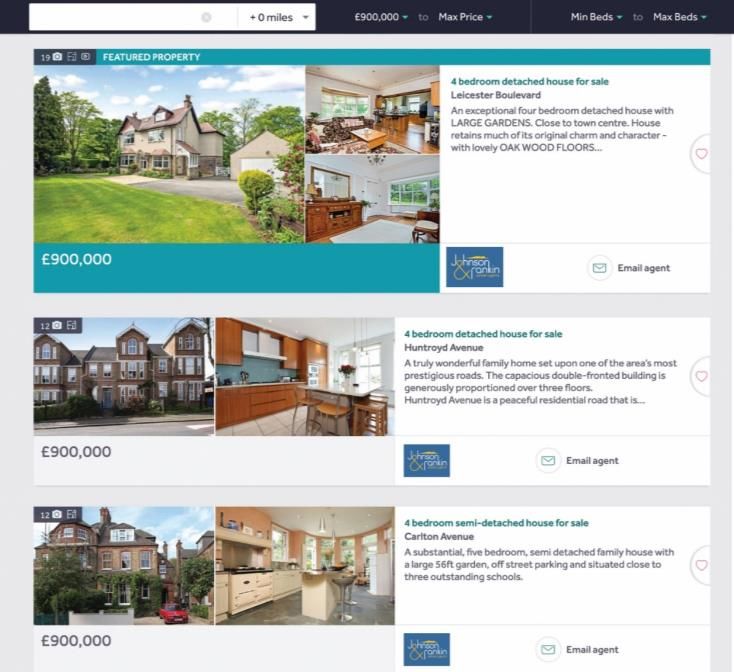
Highlights

              Revenue:                                   Profit:                                 EPS:                           Dividend:

         +10%                                    +10%                                    +12%                             +12%
     Revenue up to £267.8m                   Underlying operating profit1           Underlying basic EPS2            Final dividend increased by
     (2017: £243.3m)                         increased to £203.3m                   grew to 18.3p                    0.4p to 4.0p (2017: 3.6p*)
                                             (2017: £184.4m)                        (2017:16.3p*)                    making a total dividend of 6.5p
                                                                                                                     (2017: 5.8p*) per ordinary share

          Cash returned:                            Advertisers3:                            Site traffic4:                     ARPA4:

    £168.5m 20,454                                                                      12.3bn £1,005
     Free cash flow returned                 Stable membership as at                Time in minutes up 5% year         Per month, up £83
     to shareholders through                 31 December 2018                       on year (2017: 11.7bn)             (2017: £922)
     dividends and buybacks                  (2017: 20,427)
     (2017: £140.4m)
    * 2017 comparatives have been restated for ease of comparability to reflect the 10:1 share split effective 31 August 2018
    1. Before share-based payments and NI on share-based incentives
3   2. Before share-based payments, NI on share-based incentives and no related adjustment for tax customers
    3. For Agency and New Homes customers
    4. Source: Google Analytics
Revenue
    Revenue                                                         Revenue bridge
                 275                           267.8                300

                                       243.3                                                           2.0     267.8
    £ millions

                                                       £ millions
                 250                                                               20.4      2.1
                               220.0                                      243.3
                                                                    250
                 225

                       192.1
                 200
                                                                    200
                 175

                 150
                                                                    150
                 125

                 100
                                                                    100
                  75

                  50                                                 50

                  25

                   0                                                  0
                       2015    2016    2017    2018                       2017    ARPA     Customer   Other    2018
                                                                                  growth    growth    growth

4
Cost, profits and margins
                          1                                                                                               1
                  Costs                                                                Underlying operating profit
                                                                                       Margin:   75.1%   75.5%    75.8%       75.9%
                 70                                                                     250
    £ millions

                                                                          £ millions
                                                              64.5

                                                58.9
                 60
                                                                                                                          203.3
                                  53.8
                                                                                        200
                                                                                                                 184.4
                      47.8
                 50
                                                                                                         166.2

                                                                                                 144.3
                                                                                        150
                 40

                 30
                                                                                        100

                 20

                                                                                         50
                 10

                  0                                                                       0
                      2015       2016           2017          2018                               2015    2016    2017         2018

5       Source: Rightmove
        1. Before share-based payments and NI on share-based incentives
Income statement
                                                Year ended          Year ended
                                          31 December 2018    31 December 2017
                                                        £m                  £m

     Revenue                                         267.8               243.3

     Operating costs                                 (64.5)              (58.9)
     Underlying operating profit                     203.3               184.4
     Underlying operating profit margin             75.9%               75.8%

     Share-based payments                             (4.3)               (4.9)
     NI on share-based incentives                     (0.4)               (1.2)
     Operating profit                                198.6               178.3

     Net financial expense                            (0.3)               (0.1)
     Profit before tax                               198.3               178.2

     Income tax expense                              (37.8)              (34.1)

     Profit for the year                             160.5               144.1

6   Source: Rightmove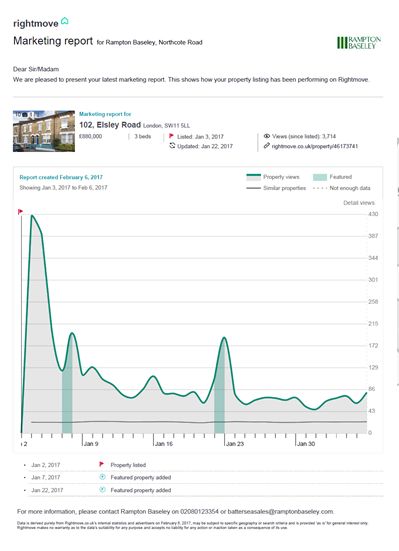
Summary balance sheet
                                                 As at               As at
                                     31 December 2018    31 December 2017
                                                   £m                  £m
    Property, plant and equipment                 15.2                 2.7
    Intangible assets                              2.9                 3.3
    Deferred tax assets                            2.8                 5.7
    Total non-current assets                      20.9                11.7
    Trade and other receivables                   22.5                35.1
    Contract assets                                0.4                   -
    Cash and money market deposits                19.9                25.0
    Total current assets                          42.8                60.1
    Trade and other payables                    (18.1)              (38.9)
    Contract liabilities                         (2.1)                   -
    Lease liabilities                           (13.0)                   -
    Income tax payable                          (16.8)              (14.7)
    Provisions                                   (1.1)               (1.0)
    Total liabilities                           (51.1)              (54.6)
    Net assets                                   12.6                 17.2

7   Source: Rightmove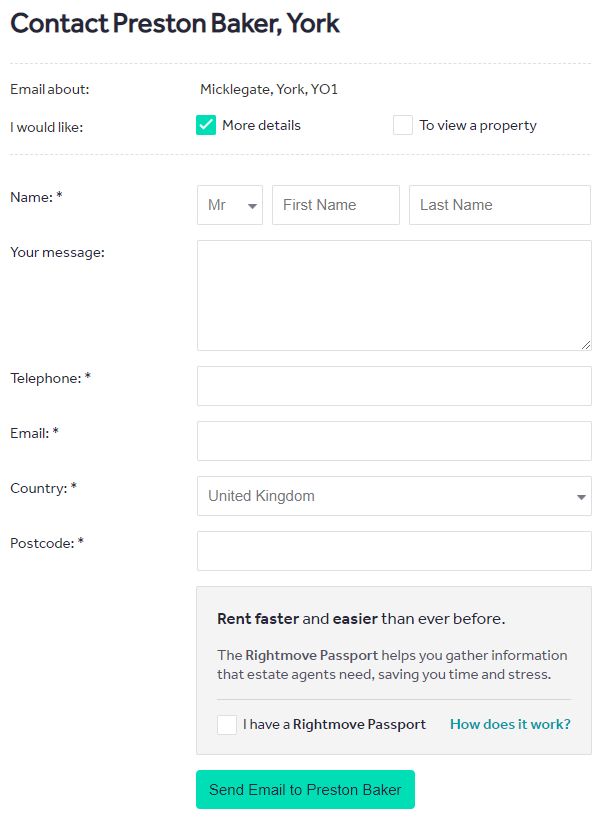
Cash bridge and dividend
                 Full year 2018
                                                                                                                                     • £168.5m (2017: £140.4m)
                 250
                                    206.8
                                                                                                                                       returned to shareholders in
                                                                                                                                       the year
                                               (6.3)
                                                                                                                                     • 25.0m (2017: 22.2m1)
    £ millions

                 200
                                                          (32.8)                                                                       shares bought back and
                                                                     (1.7)
                                                                                                                                       cancelled
                 150                                                                                                                 • 10:1 share split effected on
                                                                                                                                       31 August 2018

                 100
                                                                                                                                     • Closing cash and money
                                                                                                                                       market deposits of £19.9m
                                                                              (114.3)
                                                                                                                                       (2017: £25.0m)
                  50                                                                                                                 • Final dividend increased by
                         25.0
                                                                                                                           19.9
                                                                                                                                       0.4p to 4.0p bringing the full
                                                                                          (55.0)
                                                                                                      (1.5)      (0.3)                 year dividend to 6.5p
                   0                                                                                                                   (2017: 5.8p1) up 12%
                       Cash Dec    EBITDA    Working    Tax         Capex    Share buy Dividends Lease          Other    Cash Dec
                         2017      before    capital payments                backs incl         payments                   2018
                                    IFRS 2                                     costs

                 Source: Rightmove
8
                 1. 2017 comparatives have been restated for ease of comparability to reflect the 10:1 share split effective 31 August 2018
Making home moving easier in the UK
Our aim is to create a simpler and more efficient property marketplace
The three pillars of our strategy:
• The place consumers ‘turn to first’ and engage with most
• Offer unrivalled exposure, leads and products for our customers
• Innovate to create a better marketplace
9The UK housing market is stable
Housing Transactions 2006-2018 (UK)
1,800
1,600
1,670
Transactions (thousands)
1,613
1,400
1,200
1,235
1,230
1,220
1,219
1,192
1,000
1,073
933
800
900
886
885
858
600
400
200
0
• The number of housing transactions in Year on Year Transactions
102%
2018 was only 2% lower than 2017
101%
• Second half of 2018 showed more
100%
positive momentum
99%
• Commission rates are unchanged and
the overall Agency revenue pool is stable 98%
97%
• Two-thirds of our Agency customers also
96%
generate recurring revenue from lettings
95%
2018 Q1 2018 Q2 2018 Q3 2018 Q4
10 Source: HMRCUncertainty is causing hesitation
• Underlying demand is stable. The time spent on site in January 2019 was the
same as 2018
• January leads are 10% down showing an increasing hesitation to commit
• However, history shows the market recovers quickly once certainty returns
• Lettings market is unaffected
Leads June – July 2016
1.04
EU Referendum
Index to Week of 6 June 2016
1.02
1.00
0.98
0.96
0.94
0.92
0.90
06 June 2016 13 June 2016 20 June 2016 27 June 2016 04 July 2016 11 July 2016
11 Source: RightmoveConsumer demand remains strong
1
Traffic Record engagement, up 5% to 12.3 billion
14 1.8
minutes
11.7 12.3
11.1 11.7 1.6
12
1.4
• Nearly 1.6 billion visits in 2018, up 4%
Billions of Minutes
10 year on year
Billions of Visits
1.2
8 1
• Growth driven by continued mobile
6 0.8
0.6
adoption with 70% of time spent on
4
0.4 mobile
2
0.2
• Traffic to our research tools grew 8%
0 0
2015 2016 2017 2018 with consumers spending 450 million
Time Visits
minutes on features such as sold prices
Instant property alerts sent2 • We sent over 42 million leads to our
1000 customers, 3% down on 2017 mirroring
800
781 property market transaction levels
Millions of alerts
638 600
510
600
400
200
0
2015 2016 2017 2018
12 Source: 1. Google Analytics & Rightmove 2. RightmoveMore consumers and more engagement
Market share of top 4 property portals
90.0%
80.0%
70.0%
60.0%
50.0%
40.0%
30.0%
20.0%
10.0%
0.0%
Rightmove Zoopla.co.uk Primelocation OnTheMarket
13 Source: comScore (time spent on all platforms)Britain moves at Rightmove 14
Customers are resilient
       Agency and New Homes                                                  Stable membership numbers
                     22
                                                                             • Agency branches down 2% to 17,328
     Thousands

                                                  20,427       20,454
         Thousands

                          19,752         20,121
                     20

                     18                                                      • New Homes developments at their highest
                     16
                                                                               level since 2009, up to 3,126
                     14                                                      • Customers advertising one million UK
                     12                                                        residential properties on Rightmove
                     10                                                      • We continue to be the only place to see
                          2015             2016   2017          2018
                                                                               virtually the whole UK property market
       Agency customer size
                                                           100+ Branches          100+ Branches          100+ Branches
                          100+ Branches
                                                           21-100 Branches        21-100 Branches       21-100 Branches
                          21-100 Branches
                                                            3-20 Branches          3-20 Branches         3-20 Branches
                           3-20 Branches
                            2 Branches                       2 Branches             2 Branches            2 Branches

                           Single Branch                    Single Branch          Single Branch         Single Branch

                           January 2013                    December 2016         December 2017          December 2018

15     Source: Rightmove
Rightmove enables businesses to be more
efficient
Growth packages Training & support
Rightmove’s
audience and
data
The marketplace Efficiency tools
16Helping agents win business efficiently
The marketing funnel Performance of Rightmove customers
Brand visibility on Rightmove
4.0
Visibility (index)
Awareness 2.0
Rightmove package
performance
0.0
Essential Enhanced Optimiser
3.0 Valuation leads
Leads (index)
2.0
Consideration 1.0
0.0
Essential Enhanced Optimiser
Agent conversion
New instructions
performance
2.0
Instructions
(index)
Decision 1.0
0.0
Essential Enhanced Optimiser
Average across all customers
17 Source: RightmoveHelping agents operate efficiently
Embedded in ways of working
• 90% of agents log into the Rightmove
reporting and insight software every month
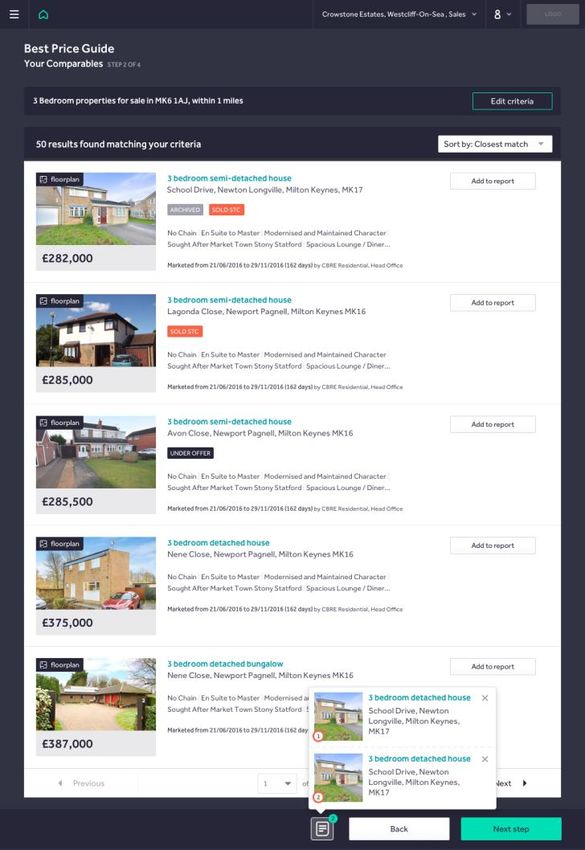
• Spending over 100 million minutes
• The Best Price Guide was used over ten
24 Acacia Avenue
million times in 2018
• The Marketing Report was run on
700,000 unique properties, 50% more
than 2017
• Rightmove has delivered over one million
minutes of training to agents in 2018:
• Over half a million minutes spent
watching live webinars
• Half a million minutes on the Rightmove
Hub watching on demand videos
18Innovating for efficiency
Contact Bell & Daughter, Tamworth Phase one of the Tenant Passport, “pre-
Orchard Grove, Tamworth
qualification” in roll out
• Includes full property requirements and basic
household details
• Reduces wasteful repetition for both agent and
tenant
• Early roll out with no above the line marketing
• Passport creation rate illustrates demand
Cumulative Passports Created
8,000
7,000
6,000
5,000
4,000
3,000
2,000
1,000
Send Email 0
Nov-18 Dec-18 Jan-19
19Product innovation
Featured Property doubles the interest a property receives creating more leads, more sales and
more opportunities to win the next instruction
Auto Featured Property will make it
easier for larger customers to make
the most of their valuable asset – their
stock:
• Automatically features properties in
their first week of marketing when
interest is highest
• Automatically relaunches properties
which fall through
• Automatically supports price
reductions by maximising exposure to
buyers at a new price point
• Simpler pricing for larger agents,
approximately four times the cost of a
single Featured Property
• Launching Q2 2019
20Customers value efficiency in uncertain
times
1
ARPA • ARPA up £83 to £1,005 per month
£1,005 (2017: £922)
per month
• ARPA growth driven by package sales and
£ per office/development per year
12,000
£922
10,000
£842 membership price increases
£754
8,000 • First full year of Enhanced package sales
6,000 ahead of plan with over 1,500 upgrades in
4,000 the year at an average uplift of over £175
2,000 • Opportunity to grow revenue through more
0 product sales, product innovation and
2015 2016 2017 2018 pricing
• Delivering efficiency savings for our
Optimiser and Enhanced packages customers allows more spend on marketing
3,000 • 2019 product sales and pricing progressing
2,500
2,000 according to plan
1,500
1,000
500 Optimiser
0 Enhanced
2015 2016 2017 2018
21 Source: Rightmove
1. Agency and New Homes customersSummary
• Record traffic, over 12 billion minutes
• Resilient customer numbers at over 20,400
• Record ARPA driven by pricing and customers spending more on
packages to secure efficient marketing in uncertain times
1
• Revenue and underlying operating profit both up 10%
• £168m cash returned in the year
22 1. Before share-based payments and NI on share-based incentivesThe proportion of revenue spent on
Rightmove varies
Spend on Rightmove as a proportion of revenue
50%
45%
40%
35%
30%
25%
20%
15%
10%
5%
0%
Agent Commission Spend on Rightmove
Proportion of branches
Proportion of commission pool
Businesses who spend a higher proportion of revenue on Rightmove tend to be newer businesses and
greater users of efficiency tools
23 Source: RightmoveDriving efficiency drives growth
January 2010
January 2014
January 2018
Percentage of Independent Estate Agency Offices
January 2019
£1000/m+ £1500/m+
56% 19%
45% 14%
9% 1%
Total spend per month
24
Source: RightmoveOutlook
• Underlying housing demand unchanged with traffic stable in January
year on year
• Political and economic noise leading to consumers hesitant to commit
• Overall membership stable in January. Continued uncertainty and
tenant fee ban may impact the viability of small numbers of agents at
the margins, conversely tighter market increases number of new home
developments advertised
• Efficiency of Rightmove advertising continues to support growth in
ARPA
• Rightmove Tenant Passport phase one – “pre-qualification” a focus on
innovation to make renting process more efficient
• Confident of meeting our expectations for the year
25You can also read