BLS Thailand Corporate Day - 8 January 2021 - Noble Development
←
→
Page content transcription
If your browser does not render page correctly, please read the page content below
BLS Thailand Corporate Day
                  8 January 2021
                               1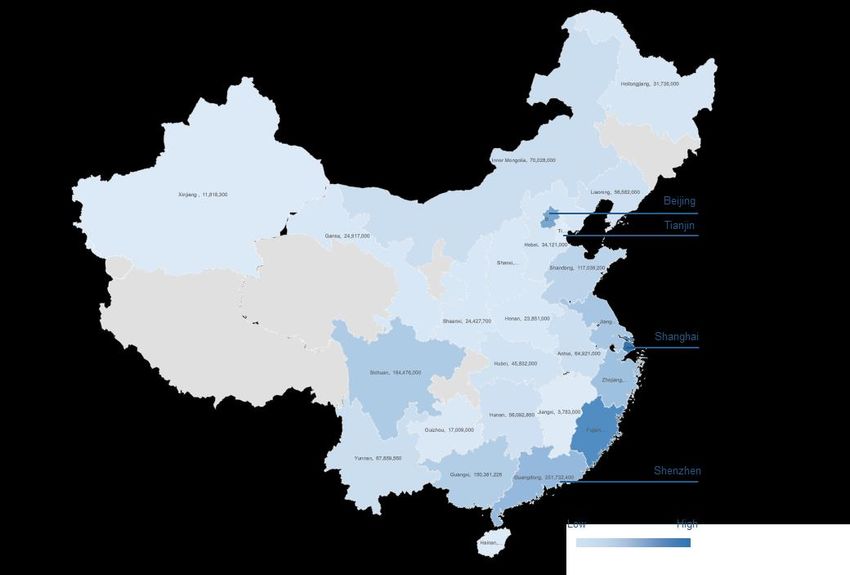
Disclaimer
The information (“Confidential Information”) contained in this presentation is strictly confidential and is provided by Noble Development Public Company Limited (the “Company”) to you solely
for your reference. Such information is subject to change without notice, its accuracy is not guaranteed and it may not contain all material information regarding the Company. None of the
Company, or any of their respective members, directors, officers, employees or affiliates nor any other person accepts any liability (in negligence, or otherwise) whatsoever for any loss
howsoever arising from any use of this presentation or its contents or otherwise arising in connection therewith. By using this presentation, you are agreeing to be bound by the below.
The information in this presentation has not been independently verified. No representation, warranty, express or implied, is made as to, and no reliance should be placed on, the fairness,
accuracy, completeness or correctness of the information and opinions in this presentation. It is not the intention to provide, and you may not rely on these materials as providing a complete
or comprehensive analysis of the Company or trading position or prospects. The information and opinions contained in these materials are provided as at the date of this presentation and are
subject to change without notice. Nothing contained herein or therein is, or shall be relied upon as, a promise or representation, whether as to the past or the future and no reliance, in whole or
in part, should be placed on the fairness, accuracy, completeness or correctness of the information contained herein.
This presentation is for information purposes only and does not constitute or form part of any offer or invitation for sale or subscription of or solicitation or invitation of any offer to or
recommendation to buy or subscribe for any securities, nor shall it or any part of it form the basis of or be relied on in connection with any contract, commitment or investment decision in
relation thereto in Thailand, United States or any other jurisdiction. Any such purchase should be made solely on the basis of the information contained in the announcements to the Stock
Exchange of Thailand relating to such securities. No reliance may be placed for any purposes whatsoever on the information set forth in this presentation or on its completeness.
This presentation contains projections and forward‐looking statements that reflect the Company's current views with respect to future events and financial performance. These views are
based on a number of estimates and current assumptions which are subject to business, economic and competitive uncertainties and contingencies as well as various risks and these may
change over time and in many cases are outside the control of the Company. No assurance can be given that future events will occur, that projections will be achieved, or that the Company's
assumptions are correct. The actual results, financial condition, performance or achievements of the Company may differ materially from those forecasted and projected. All forward-looking
statement are subject to change and should not be relied upon.

                                                                                                                                                                                                       2
Total of 65 Residential Projects
worth more than 149,800 THB mm
Forward Looking 2021
Total of 18 active projects , Inventories approximately 29,000 THB mm
Total of 11 new projects worth more than 45,100 THB mm
32020 Achievements
02 04
01 03 05
07 09
06 08 10
4Agenda
1 New Noble - at a glance
2 Corporate Strategy
3 News Alert
4 Operation Performance for 2020
5 Financial Performance for 3Q’20
5Key Achievements in 2020
KEY ACHIEVEMENTS IN 2020 KEY RESULTS IN 2020
1) Total Pre-Sales 2020 stands at THB 6,602
mm Total Revenue Net Profit ROE
2) Successful Inventory Sale - YTD worths
THB 3,290 mm - mainly thanks to the TBD TBD TBD
series of more aggressive sale campaign
from early June till now worth THB 1,600
mm
3) Launch 5 new Projects worth THB 10 Pre-Sales Backlog Inventory
billion mainly from Nue Noble
Ngmawongwanm Nue Noble Ratchada-
Lat Phrao, Nue Noble Fai Chai Wang Lang 6,602 12,785 12,883
THB mm THB mm THB mm
6New Projects in 2021
11 Project Value
45,100
Projects THB mm
High Rise 4 Projects : 25,000 THB mm
Low Rise 7 Projects : 20,100 THB mm
7Target Deliverables
FORWARD-LOOKING 2020 BEYOND 2021
Target Growth of Pre-Sales
22% 50%
+142% 16,000 NOBLE
THB mm
VS
NUE
6,602
THB mm
Low Rise 10% Low Rise 34%
High Rise
VS High Rise High Rise
2020 2021F Low Rise
Remark: low rise consists of horizontal project,8-storey condominium project, and land plot
8Target Growth of Total Revenue
+10% 11,000
10,000++ THB mm
THB mm
2020LV 2021F 2022F 2023F
9Agenda
1 New Noble - at a glance
2 Corporate Strategy
3 News Alert
4 Operation Performance for 2020
5 Financial Performance for 3Q’20
10Inventory Concentration by Value
INVENTORY DISTRIBUTION
47.0%
41.8%
40.1% 40.2%
2018
36.1%
2019
2020E
20.1%
16.5% 16.3%
10.8%
8.6% 8.9%
6.4% 6.4%
0.8% 0.0%
< 3 THB mm. 3-5 THB mm. 5-10 THB mm 10-20 THB mm > 20 THB mm
11Developing Brand Pyramid
We plan to develop three separate brands to broaden the Company’s appeal beyond Noble’s traditional customer set.
• Traditional “Noble” brand • Develop JV with international developers to target
to continue to address the customers with different value proposition
High End mid-to-high end segment • 2019: JV with Hongkong Land
x
• ”NUE” brand to develop into
Greater Bangkok alongside rail
infrastructure expansion
• Establish JVs to get access to
strategic land plots
Mass Market
12Overview of Overseas Market 2020
Despite a difficult year globally, Thailand is still the top performing market for property purchases by overseas investors
Top Investment Destinations for Chinese Investors
Rank 2016 2017 2018 2019 2020
1 United States United States Thailand Thailand Thailand
2 Australia Australia Canada United States Australia
3 Canada Thailand Australia Australia Japan
4 United Kingdom Canada United States Canada United States
5 New Zealand United Kingdom United Kingdom New Zealand Canada
6 Thailand New Zealand Malaysia United Kingdom Malaysia
7 Japan Germany Greece Vietnam United Kingdom
8 Germany Japan Japan Malaysia UAE
9 Spain Malaysia New Zealand Japan Vietnam
10 Singapore Spain Singapore Philippines Philippines
Source: Juwai IQ Data
13Overseas Market KPIs: Noble Development vs Market
Among our competitors, Noble’s conversion rate and drop rate outperform the rest of the market by an order of
magnitude margin.
Noble
Market Average
Development
Physical Visit in 2020 246 groups 285 groups
Online Visit in 2020 1,572 groups 1,539 groups
Total Groups/ Individuals 1,818 Groups 1,824 Groups
Visited in 2020 3,982 Individuals 3,826 Individuals
Drop Rate 29.2% 9.5%
Conversion Rate 4.2% 13.7%
Noble has emerged as the clear market leader amongst developers
in the overseas segment.
14Noble Brand Recognition in Overseas Market
Noble Development’s brand recognition ranks third in the overseas market, and has the highest positive brand
perception among Thai developers
Perceived Brand Awareness Among Relative Perception of Developer Amongst
Chinese Consumers Chinese Consumers
(Distribution Survey Results, n = 205, Top 7 Developers only) (Distributor Survey Results, n = 210)
A Noble
B B
Noble A
C D
D E
E F
F C
Lower Higher Less More
Recognition Recognition Positive Positive
Source: Distributor survey with sample size = 223, TNS.
15Sales distribution
Our regional sales distribution continue to be widespread – sales have come from all across China, which in turn accounted for
roughly 76% of sales
Geographic Distribution of Units Sold Total In China Units Sold Total Divided by Country
China
Hong Kong
2% Taiwan
Singapore
4%
Macau
USA
13%
Japan
Malaysia
France
Philippine
76%
Slovakia
Germany
Others
16Noble’s Overseas Market Share
Noble Development has further built on its overseas presence as the market share leader in the overseas segment
Noble Pre-Sales Y2020 Share of Overseas Market 9M’20
Overseas,
27%
Noble,
37%
Rest of the
market, 63%
Local,
73%
At THB 1,757 mm, Overseas pre-sales accounted for 27% of total In 9M20, Noble accounted for 37% of the overseas market for
pre-sales of the company in 2020 Bangkok condominiums.
17Overseas Transfers
Overseas customers have continued to transferred, and we have maintained drop rates
Transfers of Overseas Customers by Quarter
Unit : THB mm
2,500
2,062
2,000
1,500
1,000 754
500 416
0
1Q20 2Q20 3Q20 4Q20
1Q’20 2Q’20 3Q’20
Drop Rate1 5% 7% 3%
As % of BKK Condo Transfer by
19% 14% 43%
Overseas
Note : /1 - Drop Rate = Value of Dropped Sales/Value of Transferred Unit within a given period
18Overseas Transfers by nationality
Based on 3Q20 records, there is little evidence that FOREX controls from China have impacted buyers’ ability to transfer
China
Hong Kong
Taiwan
Taiwan, 11%
Singapore
USA
China, 50% Spain
Malaysia
Hong Kong, 29% Slovakia
United Kingdom
Japan
Others
19Distributors Sales Focus in 2021
Going forward, distributors are betting on a strong recovery for the Thai market in 2021 and have chosen the country as
their key area of focus.
Key Markets of Focus in 2021
(Distribution Survey Results, n = 210, multiple choices)
1%
1% 1% 2%
2%
5% Thailand
Japan
8%
United Kingdom
Malaysia
Vietnam
Canada
13%
Singapore
Australia
Others
67%
Source: Distributor survey with sample size = 223, TNS.
20Emerging Needs 2021: Project requirements
Coming out of the pandemic, overseas customers have articulated new and emerging needs which will
be critical in the “new normal”.
Emerging Needs Rationale
Preference over suburban area rather than city • Comparative lower entry cost
center locations • Rise in remote working
Unit layout with more living space and • Enable social distancing
privacy, for example townhouses and villas • More private and safe environment
Spacious environment in the neighbourhood, • Enable social networking space in the community
especially outdoor space even during quarantine/lock-down
Availability of co-working space and essential • Enable effective home working without the need of
facilities such as high speed wifi public transport
Centralized management and • Overcome travel restrictions
lettings services • No need to deal with individual tenant on day-to-day
basis, along with other inconveniences of
management property from afar
21Emerging Needs 2021: Outsourcing Management
Customers are increasingly looking for an integrated solution when making condominium purchases.
1 2 3 4 5 6
Buying a Sign Create Settle Mortgage Snagging
Condo SPA Bank Account Payment
7 8 9 10 11
Title Furniture Letting Resell Referral
Transfer Package Management
22Agenda
1 New Noble - at a glance
2 Corporate Strategy
3 News Alert
4 Operation Performance for 2020
5 Financial Performance for 3Q’20
23New Projects in 2021
Total Value Expected
Project Product % Equity Expected Launch
THB mm Completion
1. Noble Form Thonglor Condo High Rise 100% 5,400 1Q’21 1Q’24
2. Nue Noble Centre Bangna Condo Low Rise 100% 700 1Q’21 3Q’22
3. The Embassy at Wireless Condo High Rise 26% 10,700 2Q’21 2Q’24
4. Nue Condo @ Don Mueang Condo Low Rise 100% 1,900 2Q’21 4Q’23
5. Nue Townhouse @ Don Mueang Townhouse 100% 1,300 3Q’21 1Q’22
6. Nue Evo Ari Condo High Rise 100% 3,000 4Q’21 3Q’25
7. Ekkamai-Ram Inthra - Townhouse Townhouse 50% 3,700 4Q’21 1Q’22
8. Ekkamai-Ram Inthra – Land Plot Land Plot 50% 1,300 4Q’21 1Q’22
9. Suksawat Townhouse / Semi-Detach 50% 1,200 4Q’21 1Q’22
10. Khu Khot Condo Low Rise 50% 10,000 4Q’21 4Q’23
11. Rama 9 Condo High Rise 50% 5,900 4Q’21 4Q’24
Total Projects 45,100
24New Projects with BTS Group 2021-2023
New Projects in 2021 New Projects in 2022 New Land Acquisition in 2023
x x x
50% 50% 40% 41% 19%
1 Suksawad 2 Khukhod 3 Unilever - Rama 9 4 Ratburana 5 Thana City Venture
Co.,ltd
P1: 4Q2021 P1: 2Q2022 Registered
Launch Timing : Launch Timing : 4Q2021 Launch Timing : 3Q2021 Launch Timing : THB 1,000 mm
P2: 3Q2022 P2: 1Q2023 Capital:
280 m from BTS Khukhot 350 m from MRT 1.5 m from Rat Bang Na-Trat
Location : Location : Location : Location : Location:
Ratburana Station Station Rama 9 Station Burana Station Road KM. 14
P1: THB 1,200 mm Project Size : THB 10,000 mm Project Size : THB 5,900 mm Project Size : P1: THB 1,900 mm
Project Size :
P2: THB 1,400 mm P2: THB 2,700 mm
P1: Townhouse/ Product: Condo Low Rise Product: Condo High Rise Product: P1: Townhouse/
Product: Semi-Detach Semi-Detach
P2: Condo High Rise P2: Condo High Rise
Expected P1: 1Q2022 Expected Expected Expected P1: 2Q2022
4Q2023 4Q2024
Transfer P2: 3Q2024 Transfer Transfer Transfer P2: 3Q2025
25Agenda
1 New Noble - at a glance
2 Corporate Strategy
3 News Alert
4 Operation Performance for 2020
5 Financial Performance for 3Q’20
26Pre-Sales Performance of 2020
Pre-Sales Performance
Unit : THB mm
17,850 17,064
12,785
9,902 9,729
6,602
5,287
9,654
5,168 6,335
267
248 - 119
2018 2019 2020
/1 /2
Pre-Sales Horizontal Project Condominium Backlog Extra Items
Note : /1 Total Pre-Sales not included pre-sales from land plots, /2 Extra items consists of land plots and commercial property sales
27Backlog & Inventory Recognition
Backlog Recognition (2021-2023) Inventory Recognition* (2021-2023)
2023,
2023,
2021, 4,594 THB mm, 2021,
4,751 THB mm,
5,182 THB mm, 36% 12,883 5,501 THB mm,
37% 12,785 41% 43%
THB mm THB mm
2022, 2022,
2,853 THB mm, 2,788 THB mm,
22% 21%
Note : Figures as of December 2020 Note : Inventory Recognition including completed inventory and project under construction
28Agenda
1 New Noble - at a glance
2 Corporate Strategy
3 News Alert
4 Operation Performance for 2020
5 Financial Performance for 3Q’20
29Financial Highlight
TOTAL REVENUE /1 GROSS PROFIT – REAL ESTATE
Quarterly YTD Quarterly YTD
12,116 28.5% 37.8% 37.6% 37.8%
64 37.8% 37.2% 37.8%
39.6%
12,052
7,598 7,412
11 8,451
263
-
7,587 7,149
6,768 3,389
3,315 4,530
- 75 7,149
2,702
3,315 3,601 2,165 1,251
820
3Q'19 3Q'20 9M'19 9M'20 3Q'19 3Q'20 9M'19 9M'20
Revenue from /2
Residential Sale Land & Commercial Properties Sale Others Revenue Revenue Gross Profit % Gross Profit % Gross Profit (Residential Sales)
Sale – Real Estate
• Revenue from residential sale for 3Q’20 and 9M’20 was THB 3,315 mm and THB 7,149 % Gross Profit Margin – Real Estate 3Q’19 3Q’20 9M’19 9M’20
mm, respectively, or increased 304% YoY and 99% YoY, respectively. The increase was
mainly from higher transfer of condominium and horizontal projects. Residential Sales 39.6% 37.8% 37.2% 37.8%
• Total Revenue for 3Q’20 and 9M’20 was THB 3,389 mm and THB 7,412 mm, Land & Commercial Property 27.2% - 37.7% -
respectively, or decreased 55% YoY and 39% YoY, respectively. The decrease was
% Average Gross Profit Margin –
mainly from no revenue from land & commercial sale in 9M’20 28.5% 37.8% 37.6% 37.8%
Real Estate
Note : /1 Total Revenue consists of Revenue from Sale-Real Estate, Revenue from Service & Rental, and Other Income
/2 Other Revenue consists of Revenue from Service and Rentals, and Other Income
30Peers Comparison of 9M’20
Total Revenue
Unit: THB mm
23,945 24,723 26,881
19,801
13,065
7,412 8,690
5,223 4,785
ANAN AP LH LPN NOBLE ORI PSH SIRI SPALI
Net Profit
Unit: THB mm
4,788
3,284
2,019 1,942 2,387
1,238 1,085
-132 473
ANAN AP LH LPN NOBLE ORI PSH SIRI SPALI
31Peers Comparison of 9M’20
Total Gross Profit Margin
Unit: %
37.3% 40.6%
33.4% 36.3%
30.6% 30.1% 31.0%
21.8%
8.3%
ANAN AP LH LPN NOBLE ORI PSH SIRI SPALI
Net Profit Margin
Unit: %
23.2%
19.4% 18.3%
16.7%
13.7%
9.9% 9.8%
4.0%
-2.5%
ANAN AP LH LPN NOBLE ORI PSH SIRI SPALI
32Peers Comparison of 9M’20
Return on Equity (ROE)
Unit: %
32.8%
29.4%
15.5% 18.5%
9.0% 12.1%
4.7% 7.2%
-0.1%
ANAN AP LH LPN NOBLE ORI PSH SIRI SPALI
Asset Turnover
Unit: %
54.1%
47.3%
35.2% 31.3% 32.8%
28.1% 26.8% 27.0%
14.6%
ANAN AP LH LPN NOBLE ORI PSH SIRI SPALI
33Financial Position
BALANCE SHEET NET IBD/E
Unit: THB mm
Net IBD/E stands lower than covenant of 2.50x
21,631 21,631 20,165 20,165
3,016 1.58x
5,479 2,467 1.28x
899 5,217
899
5,852
5,632
13,123 11,517
2019 Sep'20
10,299 9,316
2,925 2,628
1,667 2,653 RETURN ON INVESTMENT
Dec'19
Total Assets Total Liabilities & Equity Total Assets
Sep'20 Total Liabilities & Equity
2019 3Q’20
45.7%
Cash Inventories Real Estate Development Cost 32.8%
Investment Properties Others Financial Liabilities
Non-Financial Liabilities Equity
12.9%
10.3%
• As of 3Q’20, we have cash on hand up to THB 2,653 mm, thanks to sale of inventories 2019 Sep'20
• Financial liabilities decreased by THB 983 mm from from refinance of existing bond (net) of THB
1,017 mm in May’20, and issue new project financing (net) THB 29 mm for project under ROE* ROA*
construction.
Note : * Normalized trailing 12 months
34Debt Profile
Amid historically low interest rate environment, the credit facilities from the financial institutions with MLR base currently offer lower
cost of funding compared to bond issuance.
Debt Breakdown Fixed Vs Floating Credit Facility & Utilization
Drawn
Long-Term Long- Floating Undrawn Facility
Bonds Term Loan Fixed 51% Facility
49% 5,730 4,799
4,533 9,332 4,799 9,332 THB mm
10,529 THB mm
THB mm THB mm THB mm THB mm THB mm
Weighted Average Cost of Fund Bond Maturity Profile
Unit : THB mm
4.49%
4.23%
1,500 1,500
1,050
483
2019 3Q'20 2020 2021 2022 2023
35Capital expenditure
CAPITAL EXPENDITURE (2020LV – 2021F)
Unit : THB mm
9,660
3,995
5,619
1,072
4,864
3,618
930 801
2020LV 2021F
Land Development Investment
36Dividend Payout
Expected Strong Dividend Payout From Now On
• Interim Dividend Payment of THB 1.10 per share will pay on 9 September 2020 on a
result of first-half performance of 2020.
• With higher liquidity as a result of asset optimization, it is expected that the dividend
payout will be passed through shareholders.
Unit : Baht/Share
6.90
5.20
2.20
1.10
0.30 0.30 0.30 0.10 0.00 0.00 0.17
2012 2013 2014 2015 2016 2017 2018 Mar'19 Oct'19 May'20 Sep'20
Dividend Payment Date 2012 2013 2014 2015 2016 2017 2018 Mar’19 Oct’19 May’20 Sep’20
Dividend Payout Ratio (%) 39.6% 42.2% 42.4% 28.0% - - 3.8% 319.1% 110.0% 70.3%
37Information
For more information, please contact:
K.Benjawan Munikorn
Investor Relations
Noble Development Public Company Limited
Noble Building, 1035 Ploenchit Rd., Lumpini, Pathumwan, Bangkok 10330, Thailand.
ir@noblehome.com
+66 2 251 9955
+66 2 251 9977
38You can also read