COMPANY PRESENTATION - ri.sonae

Page created by Yolanda Coleman
 
CONTINUE READING
COMPANY PRESENTATION - ri.sonae
COMPANY
PRESENTATION

May 2016
COMPANY PRESENTATION - ri.sonae
Agenda

01. THE COMPANY

02. FINANCIAL AND OPERATING PERFORMANCE

03. NEW GENERATION OF MALLS AND EXPANSIONS
COMPANY PRESENTATION - ri.sonae
1.
THE COMPANY
COMPANY PRESENTATION - ri.sonae
SONAE SIERRA AT A GLANCE
    A leading developer, owner and operator of top quality and regionally dominant
    shopping centers in Brazil

                    •   9 shopping centers owned and managed, with over 445 thousand sqm of total GLA
     OPERATING
                    •   Occupancy rate at 98.0%*
     EXPERTISE
                    •   Greenfield Expertise (83% of GLA)

                            •   Leverage on the expertise, tenant relationships and market recognition of our
            STRONG              majority shareholders
         SHAREHOLDERS’      •   Controlling shareholders with significant expertise in the sector
             BASE
                            •   Free Float = 33.35%

                                     •   Roughly 90% of rental revenue is fixed, providing significant foreseeability
                                     •   Lowest occupancy cost in the sector, as a result of malls’ formats and
                 COMPETITIVE             Company’s efficiency
                 ADVANTAGES          •   Centralized back office structure
                                     •   Substantial organic growth
4
                                                           *Excludes Uberlândia Shopping, Boulevard Londrina Shopping and Passeio das Águas Shopping   4
COMPANY PRESENTATION - ri.sonae
OWNERSHIP STRUCTURE
    Sonae SGPS                                                            Grosvenor
    •   Largest business group of Portugal, with operations in            •   British company with over 300 years of history in the
        over 40 countries                                                     properties market
    •   Retail, properties, shopping centers and                          •   Over 1,000 properties under management with a total
        telecommunications business                                           value of £10.9 billion
    •   Market value: €1.9 billion(1)                                     •   Properties in retail, commercial and residential segments

                                   50%                                                                    50%

    Sonae Sierra                                                          Alexander Otto
    •   Over 21 years of history
                                                                          •   Mr. Alexander Otto is the CEO of ECE Projektmanagement
                                                                              GmbH & Co. KG
    •   One of the largest developers and operators of shopping
                                                                          •   Audit Board Member of Otto Group and DES Deutsche
        centers in Europe
                                                                              EuroShop AG
    •   NAV: €1.1 billion
                                                                          •   Mr. Otto is also the chairman of the ICSC Europe

                                   50%                                                                    50%

                                                           Sierra Brazil 1 B.V.                               Free Float
                                                                 66.65%                                                33.35%

                  Note: (1) As of May 2016
5                 Source: Reuters, Sonae Sierra
                                                                                                                                          5
COMPANY PRESENTATION - ri.sonae
PORTFOLIO TIMELINE
    Own GLA in thousand sqm                                                                                             Uberlândia Shopping
                                                                                                                             expansion

                                                             CAGR                         Boulevard Londrina                                363
                                                                                                                           354     354               347
                                                                                         Shopping and Passeio
     Sonae Sierra enters                                     +18%                         das Águas Shopping
          the Brazilian                                                                        opening
       shopping center
      market, creating a
                                                                                           Parque D. Pedro                                     Sale of
      joint-venture with
                                                                                              expansion                                       Boavista
            Enplanta
     Engenharia, Sonae                                                                                                                        Shopping
                                                                      Shopping                                  231
         Enplanta. The                                              Campo Limpo
         portfolio was                                                                            204     209
                                Parque D.                              opening           200
         composed by:                             Boavista
                                  Pedro           Shopping
       Franca Shopping,
                                Shopping           opening
        Shopping Tivoli,                                                     150 149
                                 opening
       Shopping Penha,
            Shopping                                                 128
        Metrópole and                                103     108                          Manauara              •   Uberlândia Shopping Opening;
          Pátio Brasil.                                                                    Shopping             •   Swap: acquisition of additional 30%
                                    80       81                        Acquisition of    opening and                in Plaza Sul & sale of 22% in Penha
                                                                         additional      acquisition of         •   Acquisition of additional 9.5% in
                                                                         ownership        additional                Franca
                                             Acquisition of 20%         interests in      ownership
             25      25    25                                                                                   •   Sale of total ownership interests in
                                            ownership interest in     Metrópole, Plaza    interest in               Penha, Tivoli and Pátio Brasil
                                             Shopping Plaza Sul        Sul and Tivoli     Metrópole

           1999 2000 2001 2002 2003 2004 2005 2006 2007 2008 2009 2010 2011 2012 2013 2014 2015 2016
                                                                           Own GLA ('000 sqm)
6
                                                                                                                                                           6
COMPANY PRESENTATION - ri.sonae
PORTFOLIO
    9 operating malls, 1,980 stores, 445 thousand sqm of total GLA and 347 thousand sqm of
    own GLA. SSB also manages Shopping Penha totaling 475 thousand sqm of GLA under
    management.

                                                   Shopping centers                         City          GLA (tsd sqm) Occupancy Stores

                                                   1    Parque D. Pedro Shopping      Campinas (SP)          124.9       98.2%     399
             6
                                                   2    Franca Shopping                 Franca (SP)           18.6       97.8%     109
                                                                                      Sã o Berna rdo do
                                                   3    Shopping Metrópole                                    30.0       96.4%     191
                                                                                         Ca mpo (SP)

                                                   4    Shopping Plaza Sul            São Paulo (SP)          23.7       97.6%     215

                                                   5    Shopping Campo Limpo          São Paulo (SP)          22.3       98.6%     147

                           9                       6    Manauara Shopping              Manaus (MA)            47.0       98.4%     232

                           7                       7    Uberlândia Shopping           Uberlândia (MG)         52.4       94.3%     211

                                                   8    Boulevard Londrina Shopping    Londrina (PR)          48.3       93.9%     220

                       8                           9    Passeio das Águas Shopping     Goiânia (GO)           77.9       76.7%     256

                                                   Total                                                     445.1       93.4%    1,980
                                       2
                                                   Managed third-party shopping
                                                                                            City          GLA (tsd sqm) Occupancy Stores
                                                   centers
                                                   A    Shopping Penha                São Paulo (SP)          29.6                 209
                                               A
                                           4
                                      1        5   Data on 3/31/16
                                           3

8
                                                                                                                                           8
COMPANY PRESENTATION - ri.sonae
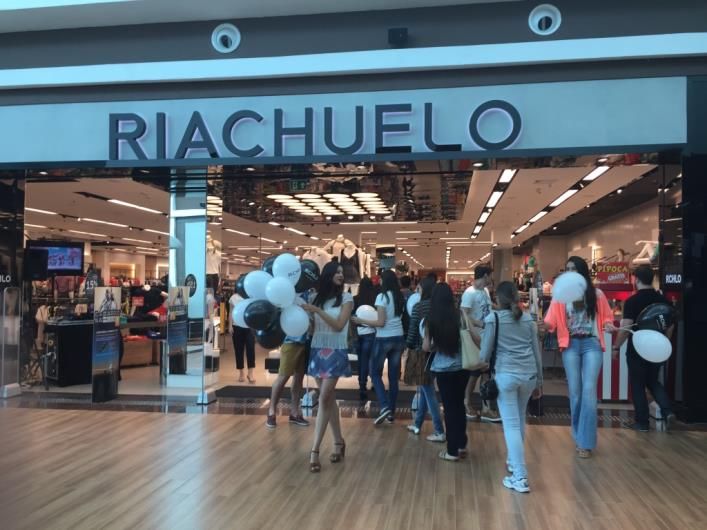
CONTROLLING INTERESTS IN
    MOST OF SHOPPING CENTERS
    Sonae Sierra Brasil’s average ownership is 78% in its 9 properties

    Shopping center               GLA (tsd sqm) % SSB   Management

    Parque D. Pedro Shopping         124.9     51.0%           √
                                                                                                                      STRATEGIC
                                                                                                                     CONTROL OF
    Franca Shopping                   18.6     76.9%           √
                                                                                                                      THE MALLS
    Shopping Metrópole                30.0     100.0%          √

    Shopping Plaza Sul                23.7     60.0%           √

    Shopping Campo Limpo              22.3     20.0%           √

    Manauara Shopping                 47.0     100.0%          √

    Uberlândia Shopping               52.4     100.0%          √

    Boulevard Londrina Shopping       48.3     88.6%           √
                                                                                      Ability to                                                       Controls the
                                                                                     expand and                                                        management
    Passeio das Águas Shopping        77.9     100.0%          √
                                                                                      adapt to                                                          services of
    Average                                    77.9%                                   market                                                         100% of owned
                                                                                       trends                                                             malls

9
                                                        Note: Sonae Sierra and Alexander Otto hold an additional 25.9% indirect ownership in Parque D. Pedro through another structure.   9
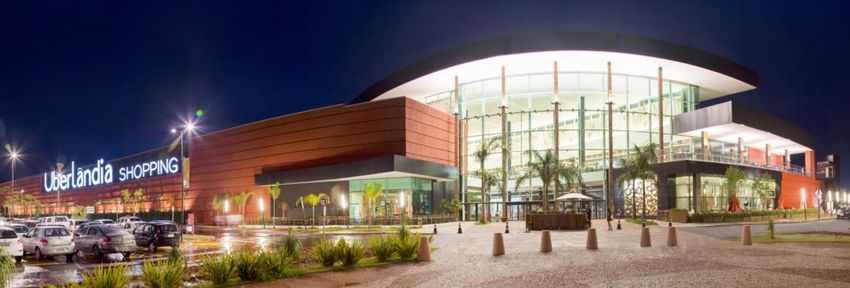
COMPANY PRESENTATION - ri.sonae
2.
     FINANCIAL AND
     OPERATING
     PERFORMANCE

10
COMPANY PRESENTATION - ri.sonae
SHOPPING CENTER SALES
                            R$ million
                            Shopping Center Tenant Sales                 1Q16       1Q15          ∆             2015               2014         ∆
                            Shopping Metrópole                           74.2       78.5      -5.6%            350.7              361.5     -3.0%
                            Franca Shopping                              48.8       50.9      -4.2%            216.3              219.1     -1.3%
                            Parque D. Pedro Shopping                    329.4      326.7       0.8%          1,432.9            1,400.3      2.3%
                            Shopping Plaza Sul                           96.5       95.4       1.2%            433.7              438.9     -1.2%
                            Shopping Campo Limpo                         81.1       80.9       0.3%            370.2              371.2     -0.3%
                            Manauara Shopping                           173.5      181.3      -4.3%            793.5              832.4     -4.7%
                            Uberlândia Shopping                          72.7       70.7       2.9%            302.3              280.9      7.6%
                            Boulevard Londrina Shopping                  64.8       62.6       3.5%            268.8              230.8     16.4%
                            Passeio das Águas Shopping                   87.8       78.7      11.6%            374.6              263.3     42.3%
                            Total                                    1,028.8    1,025.7       0.3%          4,542.9            4,398.5      3.3%

                                  SSB SALES EVOLUTION                                                     SSB SALES VS RETAIL SALES

                                                                                                  19.2%
                                                                                                                       16.5%
                     CAGR                                            4.543
                                                             4.399                                          12.8%
                     +12%
                                                     4.013
                                                                                                                                  11.0%
                                             3.614                                                15.1%                                    9.6%
                                                                                   7.6%
                                     3.101
                                                                                                                       9.5%      8.9%
                           2.748                                                           7.8%            9.4%
                                                                                                                                                    3.3%
                   2.305
      R$ million

                                                                                                                                          3.9%              0.3%

                                                                                                                                                            -0.7%
                   2009    2010      2011    2012    2013    2014    2015                                                                         -1.9%
                                                                                     2009         2010      2011       2012      2013     2014    2015     1Q16

                                                                                                                   SSB Sales       Retail Sales
11
                                                                                                                                                                    11
SSR & SSS
     SSB’s same-store rents has been benefiting from the combination of strong leasing
     spreads and high occupancy rates in our malls, growing at a healthy pace.

                     SAME-STORE RENTS (SSR)                                               SAME-STORESales
                                                                                         Same-store  SALES(SSS)
                                                                                                           (SSS)
                     Same-store Rents (SSR)
                            11.0%   10.8%                                                       10.2%
     10.1%   10.3%
                     9.7%                                                  7.9%   7.6%
                                            8.4%                                         6.5%           6.4%

                                                      6.4%
                                                             5.8%                                               2.1%
                                                                    5.0%

                                                                                                                          -1.6%   -2.2%   -2.1%
     1Q14    2Q14    3Q14   4Q14    1Q15    2Q15      3Q15   4Q15   1Q16   1Q14   2Q14   3Q14   4Q14    1Q15    2Q15      3Q15    4Q15    1Q16
                             Same-store Rents (SSR)                                              Same-store Sales (SSS)

12
                                                                                                                                                  12
OTHER OPERATING INDICATORS
                               OCCUPANCY RATE                                            OCCUPANCY COST

                                                                                                                          10.2%
                                96%   96%   96%                                                         9.5%   9.7% 10.0%
             94%   94%   95%                                        9.4%   9.4%   9.4%    9.5%   9.4%
                                                  93%   93%   93%
     % GLA

        1Q14 2Q14 3Q14 4Q14 1Q15 2Q15 3Q15 4Q15 1Q16                1Q14 2Q14 3Q14 4Q14 1Q15 2Q15 3Q15 4Q15 1Q16

                               LEASING SPREADS
                                                                                          LATE PAYMENT
                                  (renewals)
                                                                                                                             4.9%
         31%                                                                                            4.2%
                                                                                                 4.1%
                                                                                  3.4%                                3.7%
                   22%          23%                                 3.3%   3.2%           3.2%                 3.4%
                         21%
                                                  19%
                                      17%
                                            10%
                                                        8%    8%

        1Q14 2Q14 3Q14 4Q14 1Q15 2Q15 3Q15 4Q15 1Q16                1Q14 2Q14 3Q14 4Q14 1Q15 2Q15 3Q15 4Q15 1Q16

13
                                                                                                                                    13
GROSS REVENUE
     Our gross revenue reported consistent growth in the last years.
                                                                GROSS REVENUE EVOLUTION

                             CAGR
                             +15%                                                   367    382
                                                                                                               5.1%
                                                                             316
                                                                283
                                                240                                                                             97
                                         202                                                                   92
                            169
               R$ million

                            2009         2010   2011        2012             2013   2014   2015               1Q15            1Q16

                                                       GROSS REVENUE BREAKDOWN (2015)
                                                                      1.2%
                                                            2.9%

                                                         9.7%
                             Rent                                                                  7.5%
                                                                                            7.5%
                             Rent contract        6.8%                                                                   Fixed rent
                             straight-lining
                             Service Revenue                                                                             Turnover rent

                                                                                                                         Kiosks and
                             Parking Revenue                                                          85.0%
                                                                       79.3%                                             Merchandising
                             Key money

14
                                                                                                               Data considers 100% of Parque D. Pedro Shopping.   14
RENTAL REVENUE
     In our malls, tenants rental contracts have a minimum 5-year term and are annualy
     adjusted by inflation (IPCA), which brings more previsibility to our cash flow.

                                     RENTAL CONTRACTS RENOVATION SCHEDULE

                                                     24%

                                                              20%
                                         17%
                                                                                        16%

                                                                             12%
                              10%
                % of rental
                contracts

                              2016       2017        2018     2019           2020   2021 onwards

                                         Tenant             Contract term
                                         Satellite              5 years
                                         Anchor             10 to 15 years
15
                                                                                                   15
COSTS & EXPENSES
     Temporary occupancy costs reduction expected as the new malls ramp-up.

           R$ million
            Costs and Expenses                                                    1Q16        1Q15              ∆           2015          2014                ∆
            Depreciation and amortization                                          0.7         0.7           1.5%            2.7           2.5             8.2%
            Personnel                                                              9.7         9.5           2.8%           40.3          36.9             9.4%
            External services                                                      1.7         2.4         -32.3%            9.0           9.1            -0.9%
            Occupancy expense (vacant stores)                                      6.6         5.0          29.9%           22.8          21.9             4.1%
            Cost of contractual agreements with tenants                            2.5         2.7          -5.2%           11.6          11.0             4.9%
            Provision for bad debts                                                2.8         2.3          22.4%            7.5           5.5            37.3%
            Other                                                                  2.7         3.1         -12.6%           13.8          13.9            -0.5%
            Total                                                                 26.7        25.8           3.8%          107.7         100.7             6.9%

                                                              COSTS & EXPENSES BREAKDOWN
                                                                     Costs and Expenses

                                                                                                                   11.7%
                                                                                                                            27.9
                                                                                                       25.0

                                                                                                                   5.3%
                                                      -7.6%
                                                                                                       75.7                 79.7
                                  R$ million

                                                7.5              6.9
                                                      8.4%
                                               18.3              19.8

                                               1Q15             1Q16                                   2014                2015
                                                               Cost of rentals and services   Operating expenses
16
                                                                                                                               Data considers 100% of Parque D. Pedro Shopping.   16
FINANCIAL PERFORMANCE
                                      Net Revenue                                                                                                    Net Revenue

                                                                                                                                                            331

                                             84                                                                                                             +3.9%
                                                  +2.9%

                                                                                                                                                        319
                                             81

     FFO                                                                               Rent Revenue   Adj. FFO                                                                                    Rent Revenue
                    -3.5%                                           +6.6%                                                                                                          +4.8%
                                                                                                                       145                                                                  303
                36                                                                77
                                                                73                                                                     143                                   289
                            35
                                                                                                                               -1.7%

                                 58                       77                                                                                 227                     304
                                                      +4.0%
                             +10.7%                                                                                                      +2.6%                       +3.8%
                                                               80
                                                                                                                                   233
                       64                                                                                                                                                    315
           EBITDA                                                           NOI                                  Adj. EBITDA                                                        NOI
                                      1Q15          1Q16                                                                                             2014         2015

17
                                                                                                                                                   Data considers 100% of Parque D. Pedro Shopping.      17
FINANCIAL PERFORMANCE
     PROPORTIONAL CONSOLIDATION (51% PDP)
                                   Net Revenue                                                                                              Net Revenue
                                                                                                                                                   278

                                                                                                                                                   +3.5%

                                        69                                                                                                      268
                                               +2.1%

                                          68

     FFO                                                                              Rent Revenue   Adj. FFO                                                                         +4.6%    Rent Revenue
                                                                       +7.3%                                     92      -6.2%                                                                252
                23                                                                                                                                                              241
                          -13.2%                                  60             64
                                                                                                                                 86
                                   20

                            45                         62
                                                                 +1.7%
                          +10.0%                            63
                                                                                                                                  176                              249
                                                                                                                                  +2.2%                           +2.3%
                     50                                                                                                                                                   254
                                                                                                                              179
           EBITDA                                                          NOI                                  Adj. EBITDA                                                     NOI
                                   1Q15            1Q16                                                                                     2014           2015

18
                                                                                                          Data considers 51% of Parque D. Pedro Shopping and 20% of Shopping Campo Limpo.             18
CASH POSITION & LEVERAGE
      SSB’s balance sheet remains one of the                                                               DEBT PROFILE
      strongest in the sector, with a
                                                                                                              CDI       Fixed
      consolidated net debt to EBITDA ratio                                                                   12%       10%

      of 2.4 times (3.2 times with the
                                                                                                           IPCA
      proportional consolidation of our                                                                    28%
                                                                                                                            TR
      malls) and with a debt average cost of                                                                               50%

      12.21%.

                                  NET FINANCIAL DEBT                                          FINANCIAL DEBT AMORTIZATION SCHEDULE

                      825                                                                                         207           207
                      122                                                                                                                             168
                                             249
                                                                                                    114
                                                                                              62                                        66
      R$ million

                                                                                R$ million

                      702
                                                                       576

                   Total Debt            Cash and cash               Net Debt                2016   2017      2018              2019   2020        2021 and
                                          equivalents                                                                                               beyond

                                Short-term               Long-term

19
                                                                                                                                             Data on 12/31/15   19
LEVERAGE STRATEGY

                                              Financing
                                           through bank
                                          loans up to 50%
                                          of the total cost
                                          for each project
         No exposure to                                                 Debt guaranteed
             foreign                                                    by Sonae Sierra
           currencies                                                    Brasil’s assets

                      Management of cash
                          and financial                    Amortization
                        leverage indexes                  schedule highly
                      (restricted to 3.0x of                manageable
                      Net Debt/ EBITDA in
                              2016)
20
                                                                                           20
PAYMENT OF DIVIDENDS
     SSB has been providing a consistent shareholders’ remuneration in dividends.

              60.0                                                                                                       4.00%
                                                                 3.00%                                  3.09%
              50.0                                                                                                       3.00%
                                                                                    2.26%
                                                                                                                         2.00%
              40.0             1.23%          1.29%
                                                                  34.8                34.8               34.8
                                                                                                                         1.00%
              30.0   0.18%                     26.7
                               24.5
                                                                                                                         0.00%
              20.0
                                                                                                                         -1.00%

              10.0                                                                                                       -2.00%
                      2.9
               0.0                                                                                                       -3.00%
                      2011     2012           2013                2014               2015                2016*

                                 Dividends payed (R$ million)                   Dividend Yield

21                                      *To be approved at the Company’s 2016 Annual Shareholders’ Meeting, which is to be held on April 27 th, 2016.   21
3.
NEW
GENERATION OF
MALLS AND
EXPANSIONS
UBERLÂNDIA SHOPPING
              Opened in March 2012, the mall stands out for its innovative architecture. The
              mall brought renowned brands to Uberlândia and its region.

                                 Uberlândia Shopping
                          UBERLÂNDIA SHOPPING SALES

                                                               90
                                    85

                                          71     70     71            73
               64    65     67
 R$ million

              1Q14   2Q14   3Q14   4Q14   1Q15   2Q15   3Q15   4Q15   1Q16

23
                                                                                               23
BOULEVARD LONDRINA SHOPPING
              Boulevard Londrina has a privileged location, in the city’s downtown, and is
              part of an imposing mixed-use project. The shopping center gathers a tenant
              mix of diversified stores, with high appeal to the public.

                                 Boulevard Londrina Shopping
                    BOULEVARD LONDRINA SHOPPING SALES

                                    78                         83

                                          63     61     62            65
                      52    54
               46
 R$ million

              1Q14   2Q14   3Q14   4Q14   1Q15   2Q15   3Q15   4Q15   1Q16

24
                                                                                             24
PASSEIO DAS ÁGUAS SHOPPING
              Passeio das Águas is the second largest shopping of Sonae Sierra Brasil and
              the largest mall in Brazil’s Mid-West region and has a diversified tenant mix,
              with renowned brands.

                     PASSEIO DAS ÁGUAS
                             Passeio     SHOPPING
                                     das Águas      SALES
                                               Shopping
                                                               115

                                   95            90     90            88
                                          79
                            65
                      57
               46
 R$ million

              1Q14   2Q14   3Q14   4Q14   1Q15   2Q15   3Q15   4Q15   1Q16

25
                                                                                               25
UBERLÂNDIA SHOPPING EXPANSION
     Uberlândia Shopping’s expansion aims to complement the mall’s tenant mix by bringing renowned
     fashion anchor stores to the mall. The expansion, which adds 8 thousand sqm of GLA to Uberlândia
     Shopping, also includes a fitness center and a technology service provider office, both expected to
     start operations in the beginning of 2016.

                    C&A STORE OPENING                            RIACHUELO STORE OPENING

26
                                                                                                           26
EXPANSION AND REFURBISHMENT
     OF PARQUE D. PEDRO SHOPPING
     We opened Parque D. Pedro’s last refurbishment and expansion phases in November 2015, with the
     conclusion of the Alameda coverage and the opening of the new restaurant area of the mall, which
     has exclusive brands in the region, such as Jamie’s Italian and Bacio di Latte.
                  PDP’s NEW RESTAURANT AREA                      ALAMEDA COVERAGE

                     New l’Entrecote de Paris restaurant         Alameda before its refurbishment

27                     New Jamie’s Italian restaurant            Alameda after its refurbishment
                                                                                                        27
EXPANSION AND REFURBISHMENT
     OF PARQUE D. PEDRO SHOPPING
     With the new restaurant area and the Alameda coverage we concluded the refurbishment on some
     areas of Parque D. Pedro, one of Brazil’s main shopping centers. Sonae Sierra Brasil works constantly
     to perpetuate the mall’s dominant position at its market.

                                                             1. Refurbishment of aisle
                                                             currently dedicated to
                                                             furniture stores and
                                                             fitness center
                            2

                                                                1
                                                                     4

2. 13.8 k sqm area leased                                                          5                              3. New dining area,
                                                                                                                  featuring 7 new sit-down
to a convention center
                                                                                                                  restaurants and new
operator
                                                                                                                  entrance
                                                                                                           3

                                4. Refurbishment of
                                movie theater, adding 2                                  5. Coverage of Alameda
                                VIPs screens and the first                               Parque D. Pedro (PDP
                                IMAX theater in the                                      first expansion)
28                              region                                                                                                  28
NEW STORES IN OUR MALLS
     We continue to improve and adapt the tenant mix of our malls to their markets. These
     are examples of stores that opened recently in our malls.

         @Parque D. Pedro   @Parque D. Pedro

                                                                  @Plaza Sul

            @Plaza Sul      @Passeio das Águas

                                                    @Uberlândia                @Uberlândia
            @Uberlândia       @Uberlândia

29
                                                                                             29
COOP STORE®
     We opened a new store format that offers a solution for small operators to develop their
     business, the Coop Store, a shared sales space. The first Coop store was opened at
     Shopping Metrópole in November 2015.

     •   The project comes under the Sustainability view of Sonae Sierra
         Brazil and aims to help the development of small businesses.

     •   Shopping Metrópole’s Coop Store is shared by seven tenants at
         the same time.

     •   Com layout adaptável, a loja conta com mobiliário modular que
         permite o uso conforme a necessidade de cada operador. With an
         adaptive layout, the store has modular furniture that fit each
         tenant’s needs.

     •   The first SSB’s Coop Store brought a big diversity of goods that are
         not easily found in shopping malls, such as liquors, cosmetics and
         Amazon bio-jewels, embroidery and handmade jewelry.

30
                                                                                                30
SALE OF BOAVISTA SHOPPING
     In March 2016 we concluded of the sale of our subsidiary Pátio Campinas Shopping
     Ltda., which owns 100% of Boavista Shopping.

     •   The final sale price, which included Pátio Campinas’ cash
         balance, working capital and receivables, totaled R$64.2
         million, already received in cash.

     •   With only 15.9 thousand sqm of GLA and no expansion
         potential, Boavista was a non-strategic asset and we managed
         to get a compelling offer for this mall.

     •   The sale of this non-strategic asset is in line with our recycling
         capital policy.

31
                                                                                        31
Investor Relations
     +55 11 3371-3692
     ribrasil@sonaesierra.com
     ir.sonaesierra.com.br
32
DISCLAIMER
     •   The material that follows is a presentation of general background information about Sonae Sierra Brasil S.A.
         and its subsidiaries (the “Company”) as of the date of the presentation. It is information in summary form and
         does not purport to be complete. It is not intended to be relied upon as advice to potential investors and does
         not form the basis for an informed investment decision. This presentation is strictly confidential and may not
         be disclosed to any other person. No representation or warranty, express or implied, is made concerning, and
         no reliance should be placed on, the accuracy, fairness or completeness of the information presented herein.

     •   This presentation may contain statements that are forward-looking within the meaning of Section 27A of the
         U.S. Securities Act of 1933, as amended (the “Securities Act”) and Section 21E of the U.S. Securities Exchange
         Act of 1934. Such forward-looking statements are only predictions and are not guarantees of future
         performance. Investors are cautioned that any such forward-looking statements are and will be, as the case
         may be, subject to many risks, uncertainties and factors relating to the operations and business environments
         of the Company and its subsidiaries that may cause the actual results of the Company to be materially
         different from any future results expressed or implied in such forward-looking statements. No person has any
         responsibility to update any such information.

     •   This presentation does not constitute an offer, or invitation, or solicitation or an offer, to subscribe for or
         purchase any securities. Neither this presentation nor anything contained herein shall form the basis of any
         contract or commitment.

33
                                                                                                                           33
You can also read